Beyond Video Quality: Evaluation of Spatial Presence in 360-Degree Videos
2024-01-12ZOUWenjieGUChengmingFANJiaweiHUANGChengBAIYaxian
ZOU Wenjie, GU Chengming, FAN Jiawei,HUANG Cheng, BAI Yaxian
(1. School of Telecommunications Engineering, Xidian University, Xi’an 710071, China;2. ZTE Corporation, Shenzhen 518057, China;3. State Key Laboratory of Mobile Network and Mobile Multimedia Technology, Shenzhen 518055, China)
Abstract: With the rapid development of immersive multimedia technologies, 360-degree video services have quickly gained popularity and how to ensure sufficient spatial presence of end users when viewing 360-degree videos becomes a new challenge. In this regard, accurately acquiring users’ sense of spatial presence is of fundamental importance for video service providers to improve their service quality. Unfortunately, there is no efficient evaluation model so far for measuring the sense of spatial presence for 360-degree videos. In this paper, we first design an assessment framework to clarify the influencing factors of spatial presence. Related parameters of 360-degree videos and headmounted display devices are both considered in this framework. Well-designed subjective experiments are then conducted to investigate the impact of various influencing factors on the sense of presence. Based on the subjective ratings, we propose a spatial presence assessment model that can be easily deployed in 360-degree video applications. To the best of our knowledge, this is the first attempt in literature to establish a quantitative spatial presence assessment model by using technical parameters that are easily extracted. Experimental results demonstrate that the proposed model can reliably predict the sense of spatial presence.
Keywords: virtual reality; quality assessment; omnidirectional video; spatial presence
1 Introduction
In the past decade, multimedia streaming services have had an explosive growth[1]. Among a variety of multimedia types, 360-degree videos become the major type of virtual reality (VR) content in the current stage. Major videosharing websites such as YouTube and Facebook have already started to offer 360-degree video-on-demand and live 360-degree video streaming services.
In contrast to traditional 2D videos, 360-degree videos can provide full 360-degree scenes to end users, using the Head-Mounted Display (HMD) as a display device. With a higher degree of freedom (DoF) and wider field of view (FOV) during the viewing process, end users are provided with a stronger sense of immersion and a feeling of being in a perceptible virtual scene around the users. Different from the experience of traditional 2D videos[2-3], this type of feeling is usually termed as presence[4-7]. According to the classification of presence in Refs. [8] and [9], presence covers a broad range of aspects including spatial presence, social presence, self-presence[10], engagement, realism, and cultural presence. In the field of 360-degree video processing, researchers are more interested in spatial presence, which describes the feeling, sense, or state of “being there” in a mediated environment[4]. This feeling occurs when part or all of a person’s perception fails to accurately acknowledge the role of technology that makes it appear that she/he is in a physical location and environment different from her/his actual location and environment in the physical world[11].
Over the last twenty years, a variety of work has been conducted to investigate the users’ sense of presence in VR environments, especially for scenes rendered by computers[12-13].These studies mainly focused on measuring specific influencing factors of the sense of presence and revealing the qualitative relationship between presence and specific human perceptual aspects in a generalized VR environment. Directly quantifying the sense of presence is, however, outside the scope of these studies. On the other hand, some researchers managed to evaluate the sense of presence using physiological signals[14-17]. However, this type of method requires professional equipment and the reliability of experimental results strongly relies on the accuracy of the devices.
To the best of our knowledge, most human perception research carried out for 360-degree videos only focused on the perceptual video quality instead of the spatial presence. Recently, we conducted a subjective evaluation experiment on the spatial presence of end users when watching 360-degree videos displayed on VR devices[18]. We aimed to quantitatively investigate the relationship between various impact factors and the spatial presence.
In this paper, based on the research outcomes of Ref. [18],the characteristics of the display device of 360-degree videos are considered. We propose a framework in hierarchical structure to clarify the influencing factors of the spatial presence,where both the features of 360-degree video and HMD are considered. A series of rigorous subjective experiments are designed to reveal the relationship between various influencing factors and the spatial presence. Furthermore, a quantitative evaluation model of spatial presence is built in this work. Contributions of this paper can be concluded as follows:
1) We propose the first framework to identify the components of spatial presence. This framework provides valuable input for establishing models of assessing the spatial presence of VR services.
2) We reveal the relationship between spatial presence and various related impact factors based on subjective ratings,which can be used as recommendations for further improving the quality of 360-degree video services.
3) We propose the first quantitative model to measure the spatial presence when watching 360-degree videos on the HMD. The parameters employed in the proposed model can be easily extracted, hence the model would be conveniently deployed on the network or client to assess the user’s presence.
The rest of this paper is organized as follows. Section 2 introduces the related work. Section 3 illustrates the assessment framework and the subjective experiments. Section 4 introduces the proposed model in detail. In Section 5, the performance of the proposed model is evaluated. Conclusions are drawn in Section 6.
2 Related Work
Over the last thirty years, researchers have explained and defined the concept of presence in several different ways. For instance, LOMBARD et. al.[8]defined it as the experience of being engaged by the representations of a virtual world in 2002. Very recently, presence was defined as the feeling of being in a perceptible external world around the self[4-7]. The evolution of understanding and definition of the presence was summarized in Refs. [7] and [9]. As the above research is more related to psychoanalysis, straightforward solutions to the measurement of presence were outside the scope of these studies.How to measure the presence in practice is still unknown.
To acquire the subjective sense of presence, some researchers resorted to the design of subjective response questionnaires[19-24]. More specifically, authors in Ref. [19] designed a questionnaire, called the immersive tendencies questionnaire(ITQ), to investigate the relationship between users’ sense of presence and some handcrafted influential aspects in virtual environments. Authors in Ref. [22] designed a spatial presence questionnaire, named MEC Spatial Presence Questionnaire(MSC-SPQ), to investigate the influence of possible actions, selflocation, and attention allocation on users’ sense of spatial presence. However, these studies only focused on revealing the qualitative relationship between specific human perceptual aspects and presence in the generalized VR environment. On the other hand, some researchers tried to evaluate the presence using physiological signals[14-17]. This type of measurement requires the deployment of professional equipment which is impractical for real-world applications. Therefore, designing accurate and implementation-friendly experimental methods to measure presence is of fundamental importance.
As for the human perception research specifically carried out for 360-degree videos, to our best knowledge, most studies only focused on evaluating the quality of experience aspects[25-33]instead of assessing the sense of presence. For instance, authors in Ref. [25] investigated how to assess the video quality of 360-degree videos corresponding to different projection approaches. A quality metric, called spherical peak signal to noise ratio (SPSNR) was proposed to summarize the average quality over all possible viewports as the video quality. In Ref. [26], authors proposed an objective video quality assessment method using a weighted PSNR and special zero area distortion projection method for 360-degree videos. In Ref. [30], authors measured viewport PSNR values over time to assess the objective video quality of 360-degree video streaming. Recently, authors in Ref.[33] introduced visual attention in assessing the objective quality of 360-degree videos with the assumption that not all of the 360-degree scene is actually watched by users. However, as discussed above, the spatial presence of end users was not fully considered in existing research. Our recent work[18]conducted a preliminary experiment for assessing the spatial presence of end users when viewing 360-degree videos displayed on VR devices.However, modeling the spatial presence of end users is not covered. How to quantitatively evaluate users’ sense of spatial presence when viewing 360-degree videos remains an open issue.
3 Subjective Evaluation Framework and Subjective Experiments
In this section, a hierarchical framework with five perception modules is first proposed to assess spatial presence.Based on this framework, five subjective experiments were designed and conducted according to each module in the framework. Results of subjective experiments are used to investigate each type of human perception and facilitate the establishment of the assessment model.
3.1 Proposed Assessment Framework
As shown in Fig. 1, the proposed framework consists of three layers, namely the factor layer, the perception layer, and the presence layer from left to right. The factor layer includes several sensory cues of relevant parameters such as video, audio, VR device, and latency. These parameters can be conveniently extracted from the current VR systems. In the perception layer, users’ perception is characterized into multiple dimensions including visual[34], auditory[34], and interactive perception[21-22,35]. Detailed definitions of the components of perception and presence layers are discussed as follows.
1) Perceptual video quality
Perceptual video quality refers to the overall perceived quality of videos displayed on the HMD. In our previous work,three technological parameters of the video, i.e., video bitrate,video resolution and video frame rate, are extracted to assess the video quality. Two parameters corresponding to the HMD(screen resolution and refresh rate) are added in the assessment of perceptual video quality.
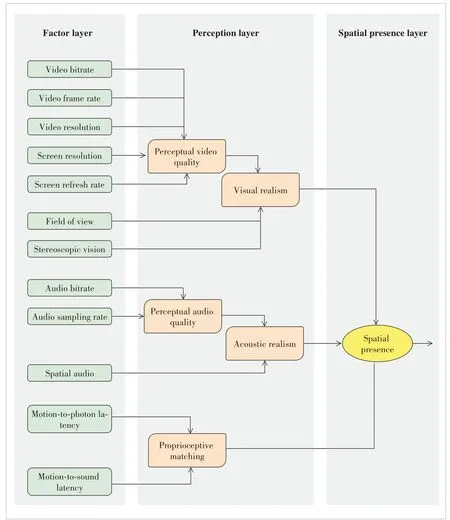
▲Figure 1. Proposed assessment framework for assessing spatial presence
2) Perceptual audio quality
Perceptual audio quality refers to the overall perceived quality of audios offered by the VR system. The audio bitrate and audio sampling rate are extracted to assess the perceptual audio quality.
3) Visual realism
Visual realism (VRE) refers to how close the system’s visual output is to real-world visual stimuli. This perception not only depends on the video quality, but also depends on how wide the FOV provided by HMD is and whether a stereoscopic vision is offered. These two additional factors have been verified to be important for the overall capability of an immersive system[36].
4) Acoustic realism
Acoustic realism (ARE) represents how close the system’s aural output is to real-world aural stimuli. Perceptual audio quality is the basic experience of the audio. Moreover, spatial audio provides the capability to track sound directions and update the head movement in real time. Hence, the spatial audio and perceptual audio quality are combined to assess the overall acoustic realism.
5) Proprioceptive matching
Proprioceptive matching refers to the matching degree between the head movement and the picture/sound refresh of the HMD. As for a VR system, the tracking level is much more important in regard to the spatial presence formation[36]. Similarly,the mismatch can also occur in the spatial audio. These two mismatches, called motionto-photon (MTP) latency and audio latency(AL)[37], are utilized to assess the capability of proprioceptive matching.
6) Spatial presence
Spatial presence refers to a user’s subjective psychological response to a VR system[35]. It is correlated with VRE, ARE, and proprioceptive matching, which represents the main aspects of the experience provided by 360-degree video services.
3.2 Subjective Experiments for Obtaining Spatial Presence
To explore the spatial presence, six subjective quality scoring experiments were conducted, corresponding to the five perception modules in the perception layer and one towards the spatial presence.
3.2.1 Overview of Experimental Design
A total number of 30 non-expert subjects participated in this experiment, including 16 males and 14 females aged between 22 and 33 years. All of them have normal or corrected-to-normal sight. The experiments were conducted in the test environment following ITU-T P.913[38]. A flagship HMD, i.e., HTC VIVE Pro, was employed as the display device, which has a screen with an original resolution of 2 880×1 600 pixels, a refresh rate of 90 Hz, and a horizontal FOV of 110 degrees. Moreover, a 360-degree video player with the Equirectangular projection was developed to display the videos on the HMD. The display FOV, length of the MTP latency, and audio latency can be set as desired. Our study adopted a single-stimuli scoring strategy[38].
3.2.2 Experiment 1: Obtaining Perceptual Video Quality
In this experiment, ten YUV420 original videos were employed to form a video database, including four 360-degree videos (i.e., denoted as O1 to O4) proposed by Joint Video Exploration Team (JVET) of ITU-T VCEG and ISO/IEC MPEG[39-40]and six 2D videos (i.e., denoted as V1 to V6) provided by the Ultra Video Group[41], as shown in Fig. 2. The 360-degree videos have a spatial resolution of 3 840×1 920 pixels, a framerate of 30 fps and a length of 10 s. The 2D videos have a spatial resolution of 3 840×2 160 pixels, a framerate of 120 fps and a length of 5 s. The experiment was divided into 2 sub-experiments, which were designed to investigate the impact of bitrate and frame rate on the perceptual video quality. Details of the experiment settings are introduced as follows:
1) Investigating the impact of video bitrate
Four 360-degree videos, i.e., O1 to O4, were utilized to investigate the relationship between the video bitrate and the perceptual video quality. The bits per pixel (BPP) were employed to unify the coding bitrates under different resolutions.It can be calculated by
whereBrandfare the video bitrate and frame rate, respectively.RHandRVare the horizontal and vertical source resolutions. The original 360-degree videos were down-sampled and encoded using an x265 encoder according to the settings listed in Table 1.
During the experiment, video sequences were displayed in random orders using the HMD. Subjects can change their viewport by rotating their head. There was a 10-second interval between each two video sequences. Subjects could rate the perceptual video quality using the Absolute Category Rating(ACR) 5-point scale (corresponding to the perceived quality of“excellent,” “good,” “fair,” “poor,” and “bad” from 5 to 1 point) during the 10-second interval. Before the formal test,the subjects were asked to rate a few example videos to get familiar with the scoring scale and the scoring tool.
2) Investigating the impact of frame rate
To the best of our knowledge, there is no 360-degree video database containing videos with a frame rate higher than 60 fps. As the screen refresh rate of the current HMDs can reach 90 Hz, we have to use six 2D videos with a high frame rate, i.e.,V1 to V6, to study the impact of frame rate. Each original video was repeated twice to generate a video of 10 s. Then, they were down-sampled to 60 fps, 30 fps, and 15 fps. These videos (including the original 120 fps) were further spatially downsampled to 960 × 540. Videos generated from V1 to V4 were encoded with a fixed quantization parameter (QP), i.e., 22, us-ing the x.265 encoder to generate high-quality videos. To investigate whether the QP can influence the impact of framerates on the perceptual video quality, V5 and V6 were encoded with four different QPs, i.e., 22, 32, 36, and 39, to generate four quality levels. During the experiment, video sequences were displayed in their resolution in random orders. It is noted that videos with 120 fps were displayed at 90 fps on the HMD since the refresh rate of the HMD is only 90 Hz.
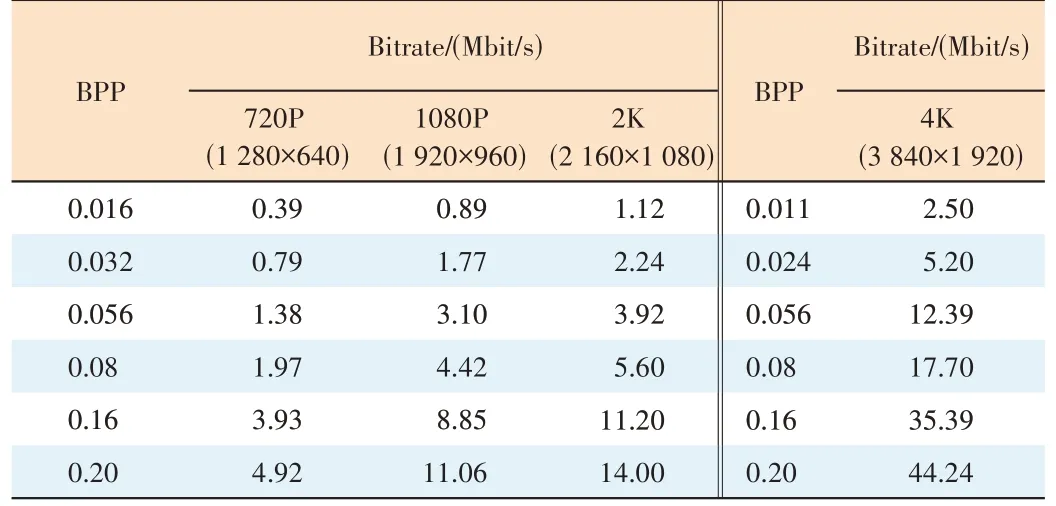
▼Table 1. Experimental setup

▲Figure 2. Content of test sequences: (a) Basketball, (b) Harbor, (c) KiteFlite, (d) Gaslamp, (e) Beauty, (f) Bosphorus, (g) Honeybee, (h) Jockey, (i)ReadySetGo, and (j) YachRide
3.2.3 Experiment 2: Obtaining Visual Realism
Three high-quality stereoscopic videos (3 840×3 840 resolution) were downloaded. Note that the audio tracks were not used in this experiment. These videos last for 20 s and have a frame rate of 30 fps. The projection mode is equirectangular.They were firstly separated into two monoscopic videos, namely the left and right videos, separately. To investigate the impact of stereoscopic vision, the left videos and stereoscopic videos were utilized as the test materials that were further encoded into three quality levels: 1 Mbit/s, 5 Mbit/s and 14 Mbit/s for monoscopic videos and 2 Mbit/s, 8 Mbit/s and 18 Mbit/s for stereoscopic videos. The FOV was set to be 60 degrees, 90 degrees and 110 degrees, respectively. The ACR 5-point scale was also used in this experiment to record the evaluation scores for the perceptual video quality and visual realism. To obtain visual realism, the subjects were asked a question: “To what extent are your visual experiences in the virtual environment consistent with that in the real world?”.
3.2.4 Experiment 3: Obtaining Perceptual Audio Quality
The audio tracks from the perceptual evaluation of audio quality (PEAQ) conformance test listed in ITU-R BS.1387[42]were employed as the reference. More specifically, six samples, four music pieces and two speeches, were used, as summarized in Table 2. The sampling frequency of all audio files is 48 kHz. Stereo (two-channel) audio files were used for the test. They were encoded using the Advanced Audio Codec(AAC) encoder with a bit rate of 8 kbit/s, 16 kbit/s, 32 kbit/s,64 kbit/s, 128 kbit/s, 256 kbit/s, and 320 kbit/s, respectively and a sampling rate of 48 kHz. The generated audio sequences were displayed to subjects on a high-fidelity headphone in a random order. After each display, the subjects were asked to rate the quality levels of audio files in ACR 5-point scales.
3.2.5 Experiment 4: Obtaining Acoustic Realism
The left videos in Experiment 2 encoded with 14 Mbit/s and corresponding audio files were used in this experiment to in-vestigate the influence of the audio quality and spatial audio on acoustic realism. The audio component of these videos was in eight channels with each representing the sound from one direction. The original audio files were encoded using the AAC codec with a bit rate of 128 kbit/s and a sampling rate of 44.1 kHz. The sound from front-left and front-right was firstly mixed into the stereo audio. Then, the stereo audio files and original spatial audio files were encoded with 16 kbit/s, 32 kbit/s, 64 kbit/s, and 128 kbit/s to generate four quality levels. After the display of each audiovisual sequence, two questions were asked: “How do you rate the quality of the audio you just heard?” and “To what extent are your acoustic experiences in the virtual environment consistent with that in the real world?”. Then, the subjects used the ACR 5-point scale to score the audio quality and acoustic realism of the test sequences separately.
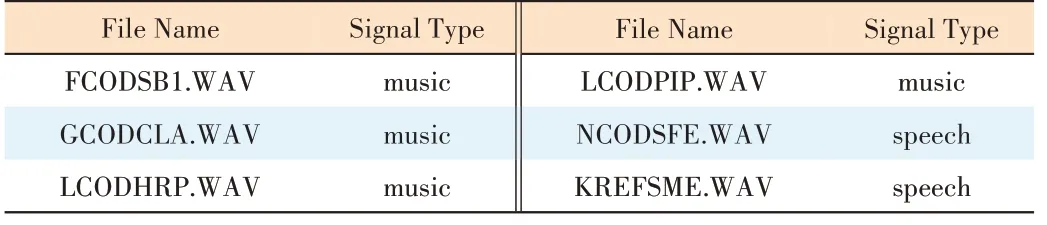
▼Table 2. Experimental setup
3.2.6 Experiment 5: Obtaining Proprioceptive Matching
In this experiment, the influence of the MTP latency and AL on proprioceptive matching was investigated. First, three left vision videos in Experiment 2 with “excellent” video quality were displayed with seven lengths of MTP latency, i.e., 0 ms,20 ms, 60 ms, 100 ms, 200 ms, 300 ms, and 500 ms, in a random order. Their audio files (high quality, 128 kbit/s) were displayed with no audio latency. Then, these videos were displayed with no MTP latency while the corresponding spatial audio files (high quality, 128 kbit/s) were displayed with eight different lengths of audio latency, i.e., 0 ms, 20 ms, 60 ms,150 ms, 300 ms, 500 ms, 1 000 ms, and 2 000 ms, respectively. The subjects were asked to score the degree of proprioceptive matching for the test sequences with the ACR 5-point scale.
3.2.7 Experiment 6: Obtaining Spatial Presence
As listed in Table 3, the original stereoscopic videos (i.e.,denoted as S1 to S3) and corresponding stereo audio files in Experiment 2 were first encoded and displayed on the HMD with no MTP latency and AL. Then, the original audiovisual files were encoded with high quality and displayed with six MTP latencies, i.e., 0 ms, 20 ms, 80 ms, 150 ms, 300 ms, and500 ms, respectively. We adopted the 5-point spatial presence scale proposed in Ref. [43] where a point from 5 to 1 indicates the degree of being there from “very strong” to “not at all”. The question designed in the experiment was“To what extent did you feel like you were really inside the virtual environment?”.
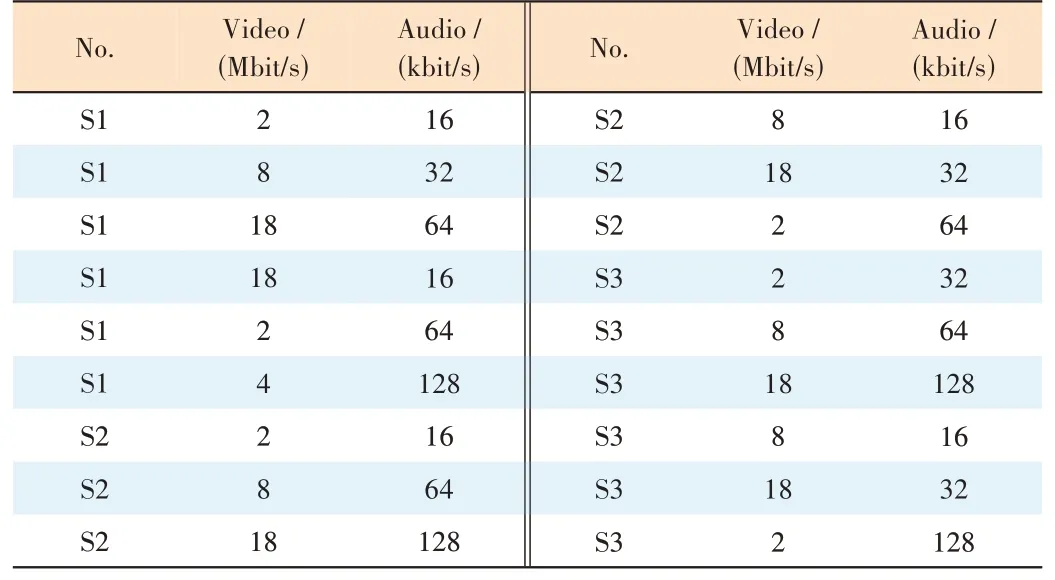
▼Table 3. Experimental setup
After the subjective tests, the reliability of the subjective results in each experiment was checked using the Pearson Linear Correlation Coefficient (PLCC) adopted by ITU-T Recommendation P.913[38]. According to the suggested threshold of 0.75[38], only the results from two subjects were discarded.
4 Spatial Presence Assessment Model
In the previous section, we construct several test scenarios under different impact factor settings and launched subjective experiments to obtain users’ rating scores. These scores are the ground truth of spatial presence under different impact factor settings. In this section, the characteristic of users’ perception in each module is analyzed based on the preliminary observation of the experiment results. The weight of each impact factor is determined using the linear regression method.
4.1 Perceptual Video Quality Assessment Module
As studied in Refs. [44] and [45], the impact of frame rate and quantization is separable. We follow this conclusion and hypothesize that the perceptual video quality can be predicted as follows:
wherefrepresents the frame rate and BPP is the bits per pixel. SQF and TCF are the spatial quality factor and temporal correction factor, respectively. The first term SQF (BPP) measures the quality of encoded frames without considering the impact of frame rate. The second term models how the Mean Opinion Score (MOS) varies with the change of frame rate.
4.1.1 Temporal Correction Factor
Fig. 3 shows the relationship between the frame rate and the perceptual video quality. We can see that the perceptual video quality increases along with the rise of frame rate. Fig. 4 presents the experimental results of the two videos encoded with four different QPs. It can be found that no matter what the QP level is, MOS reduces consistently as the frame rate decreases. In order to examine whether the decreasing trend of MOS against the frame rate is independent of the QP, the MOS scores were normalized and shown in Fig. 5, where the normalized MOS (NMOS) is the ratio of the MOS with the MOS at 30 fps. More specifically, the NMOS is calculated as

▲Figure 3. Relationship between the frame rate and perceptual video quality
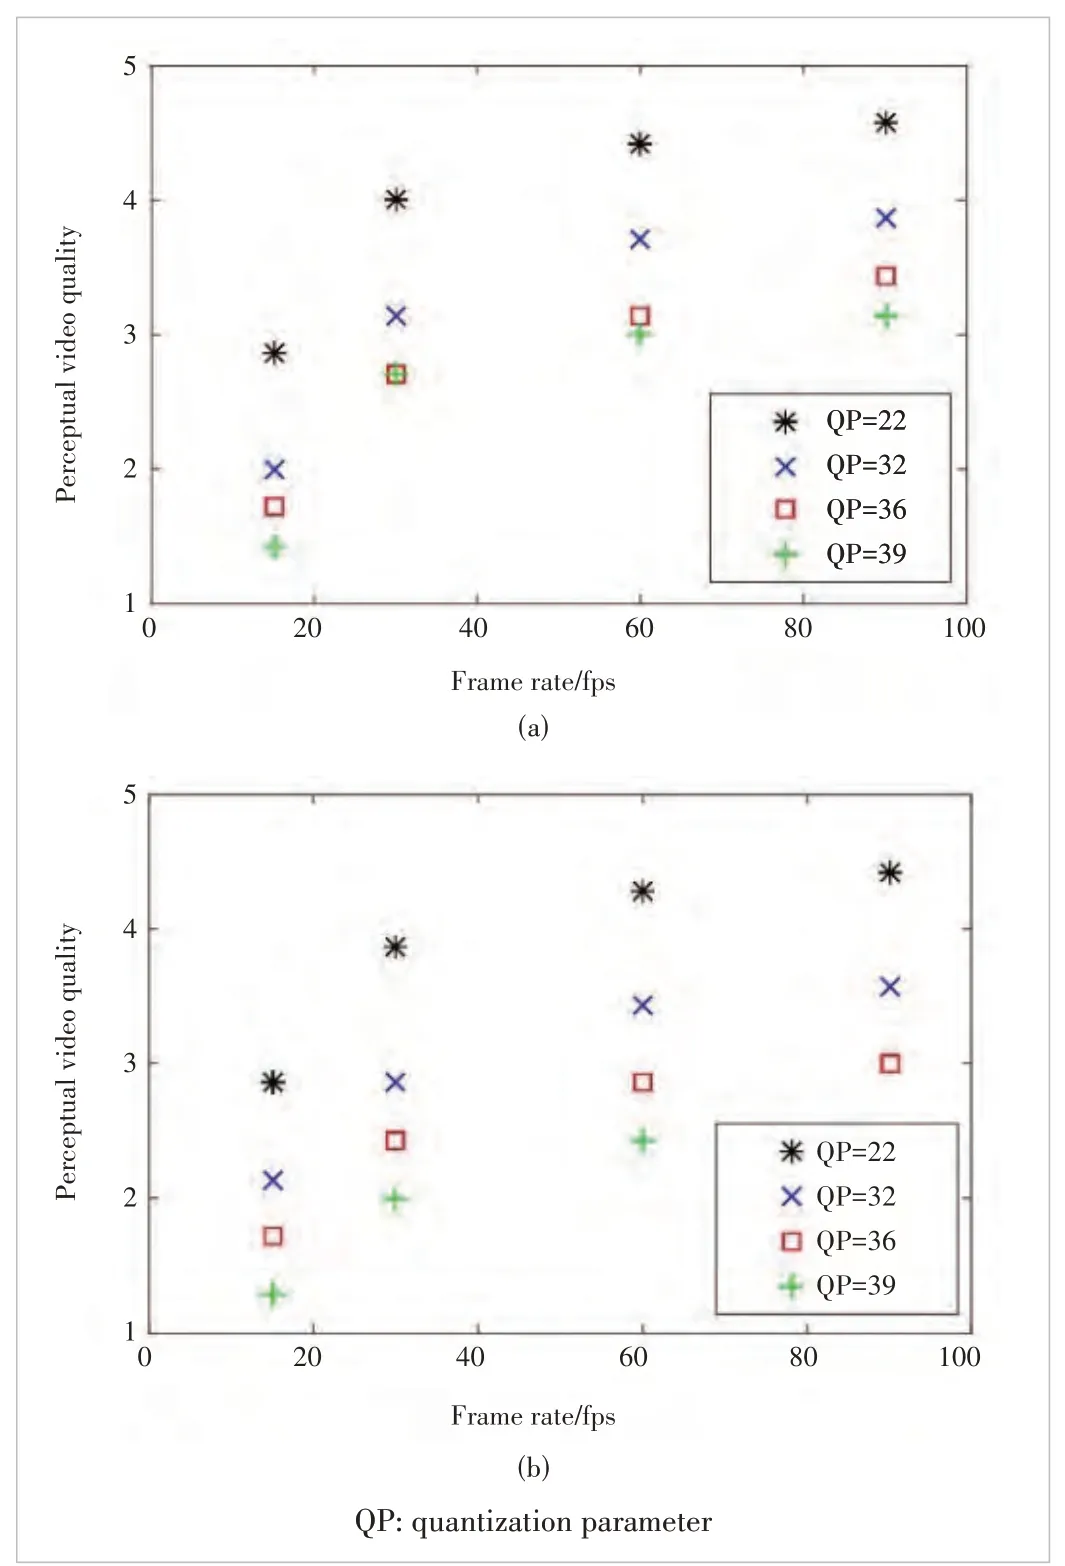
▲Figure 4. Experimental results of (a) ReadySetGo and (b) YachRide encoded with four different QPs
As can be seen in Fig. 5, these NMOS scores corresponding to different QPs almost overlap with each other, indicating that the decrease of MOS with the frame rate is independent of the QP. This observation follows the conclusions drawn in Refs. [44] and [45] and confirms our hypothesis. The trend in Fig. 5 can be fitted using the function as
wherev1,v2, andv3are -1.672, -0.095 31 and 1.112, respectively, which were obtained by regression.
4.1.2 Spatial Quality Factor
In this subsection, we investigate and modeled the spatial quality, which is mainly influenced by the bitrate, video resolution, and screen resolution. Fig. 6 shows the relationship between the BPP and the perceptual video quality of four 360-degree videos. It can be seen that the perceptual video quality increases with the rise of BPP. However, as for videos at different resolutions, the increasing trends of the perceptual video quality are different. This trend can be represented as
wherev4andv5are the model coefficients that can be obtained by regression. The values ofv4andv5are listed in Table 4. It can be seen that the values ofv4are very close to each other while that ofv5are quite distinct for different video resolutions. Hence, the average value ofv4is used as a fixed coefficient. The value ofv5is then regressed again.
To reflect the impact of video resolution and screen resolution on perceived video quality, we employ the integrated assessment parameter that we proposed in the previous work[46],i.e., the number of effective video pixels per degree (ED-PPD)displayed on the screen of HMD. The effective pixels do not include the pixels interpolated by the up-sampling process.This parameter is calculated as
whereRHandRSHare the horizontal resolution of 360-degree video and screen, respectively. When the horizontal pixels of the video displayed on the screen are more than the horizontal pixels on the screen, the ED-PPD will be saturated.
Fig. 7 shows the relationship between the ED-PPD andv5.It can be seen that the values ofv5and ED-PPD are in accordance with the power function relationship, which can be expressed as
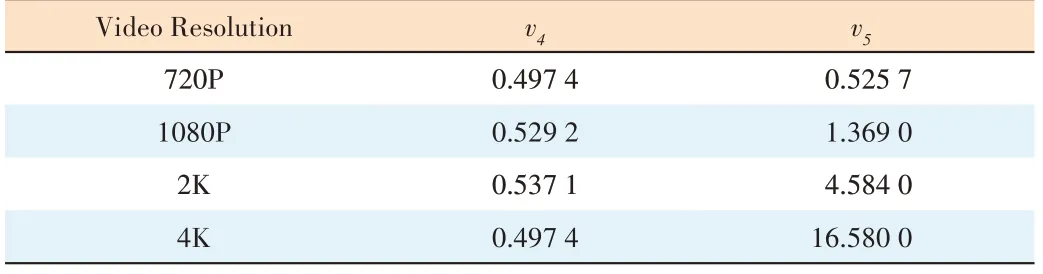
▼Table 4. Values of v4 and v5

▲Figure 7. Relationship between ED-PPD and v5
wherev6andv7are equal to 0.011 7 and 2.962, respectively.
By substituting Eqs. (4), (5) and (7) into Eq. (2), the perceptual video quality of 360-degree videos can be modeled.
4.2 Visual Realism Assessment
According to the results of Experiment 2, Fig. 8 shows the relationship between perceptual video quality and visual realism. It can be seen that there is a strong correlation between the perceptual video quality and visual realism. For the influence of FOV, it can be observed that a higher FOV leads to a higher visual realism. The Kruskal-Wallis H test showed that there is a significant effect of FOV on visual realism, withp=0.001 for monoscopic videos andp= 0.039 for stereoscopic videos. A one-way analysis of variance (ANOVA) test indicates that there is no significant effect of the type of vision on visual realism. Based on the results above, the video quality and FOV appear to have a more significant impact on visual realism than the type of vision. Thus, the relationship of perceptual video quality, FOV, and visual realism can be calculated by

▲Figure 8. Relationship between the perceptual video quality and visual realism: (a) 60 FOV (field of view), (b) 90 FOV, and (c) 110 FOV
wherev8,v9andv10are equal to 0.595, 0.02 and -0.735, respectively.
4.3 Perceptual Audio Quality and Acoustic Realism Assessment
We first model the perceptual audio quality using the experimental results of Experiment 3. Fig. 9 shows the logarithmic relationship between the audio bitrate and the perceptual audio quality. This relationship can be represented as
wherev11,v12andv13are equal to 4.103, 42.36 and 1.251, respectively.
As for AR, Fig. 10 shows the relationship between the perceptual audio quality and acoustic realism. It can be found that there is a significant linear relationship between the audio quality and acoustic realism for stereo audio (R2= 0.881,F=213.251, andp= 0.000 < 0.05) and for spatial audio (R2=0.955,F= 73.791, andp= 0.000 < 0.05). The relationship in Fig.10 can be expressed as

▲Figure 9. Relationships between the audio bit rate and perceptual audio quality
wherev14andv15are equal to 0.733 and 0.634 for the stereo audio, and equal to 0.682 and 1.167 for the spatial audio.
4.4 Proprioceptive Matching Assessment
Fig. 11 shows the relationship between the two types of delay and proprioceptive matching. It can be seen that the proprioceptive matching decreases with the increase of both the MTP latency and AL. Here, the degradations of proprioceptive matching caused by the MTP latency and AL are calculated by
Fig. 12 shows the relationship between the two types of delay and the degradation of proprioceptive matching. This relationship can be represented by
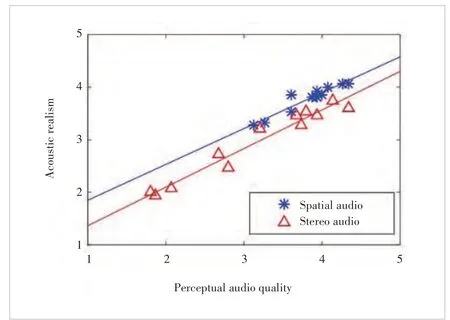
▲Figure 10. Relationship between the perceptual audio quality and acoustic realism rated on Head-Mounted Display (HMD)
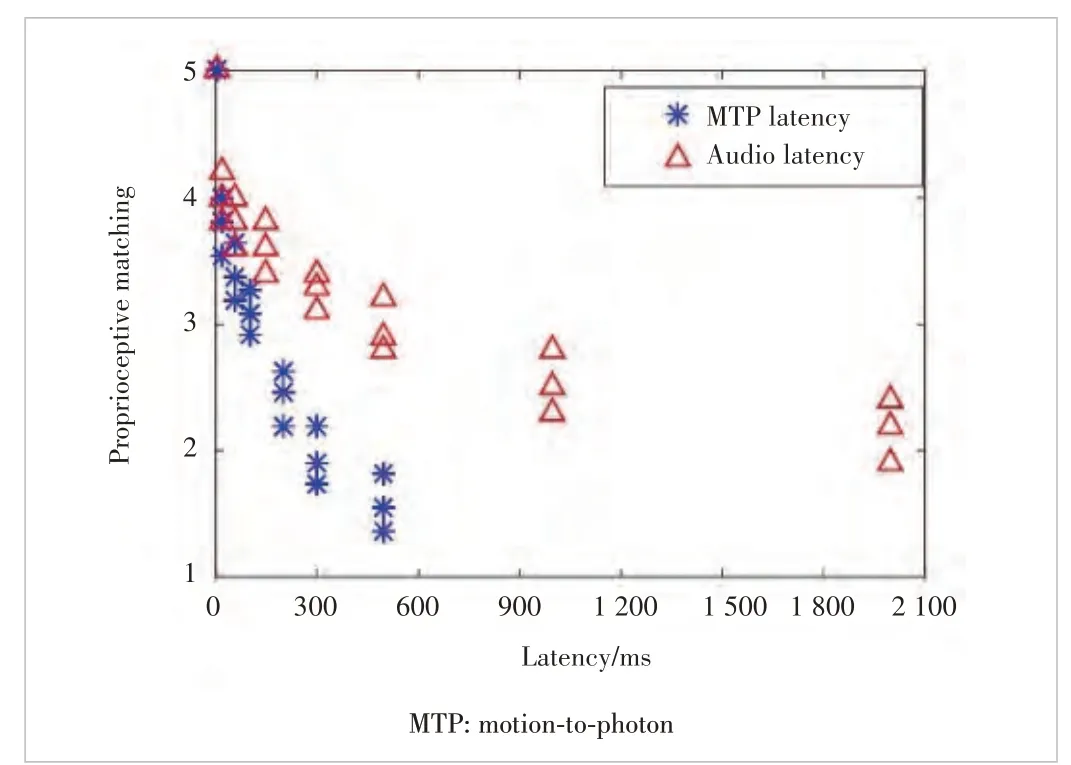
▲Figure 11. Relationship between the two types of delay and the proprioceptive matching
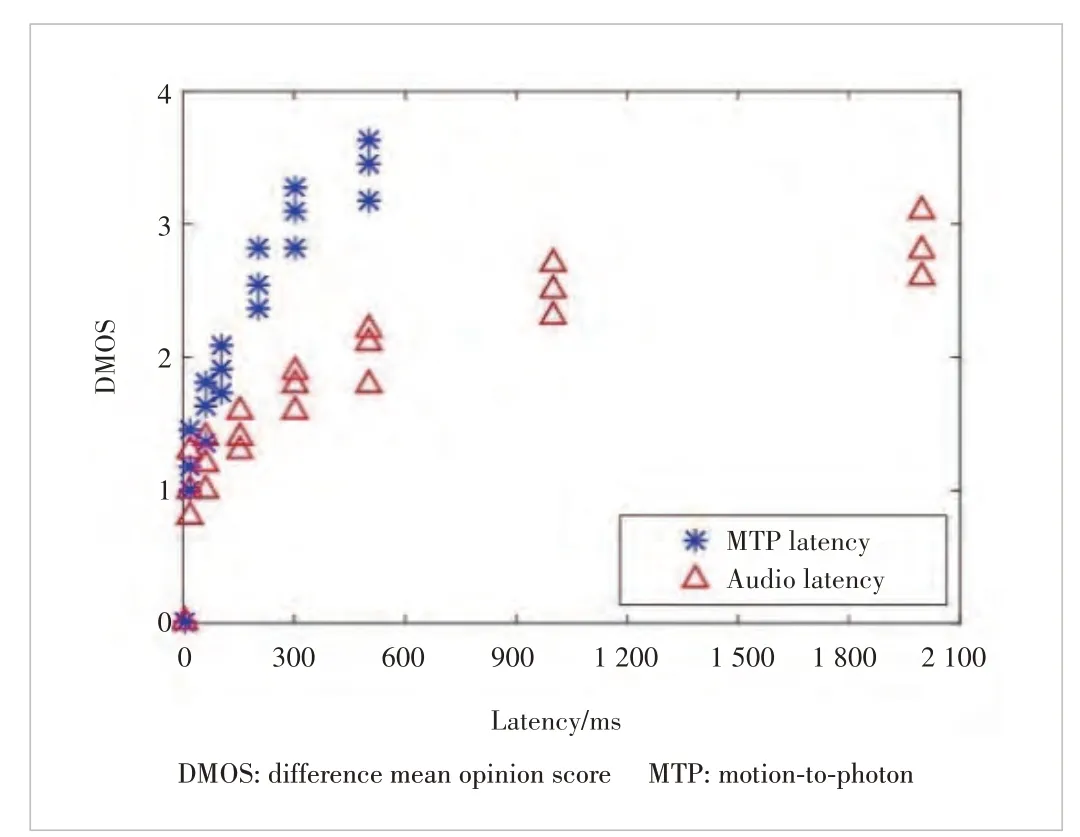
▲Figure 12. Relationship between the two types of latency and the degradation of proprioceptive matching
wherev16,v17andv18are equal to 0.065 46, 0.428 9 and 0.275 4,respectively. We modeled the proprioceptive matching as
4.5 Spatial Presence Assessment
First, the relationship between the visual/acoustic realism and the spatial presence is modeled. As shown in Fig. 13, the spatial presence increases with the rise of VRE and ARE.This phenomenon confirms the conclusion drawn in our previous work[18]. The relationship shown in Fig. 13 can be calculated as
wherev19,v20,v21, andv22are equal to 1.285, 0.01, 0.027 4,and -1.529, respectively; SPAV represents the spatial presence provided by the visual and acoustic experience.
Second, the impact of proprioceptive matching is investigated. Fig. 14 shows the relationship between the proprioceptive matching and the degradation of spatial presence. We can find that the degradation of spatial presence decreases with the increase of proprioceptive matching. The relationship in Fig. 14 can be modeled as
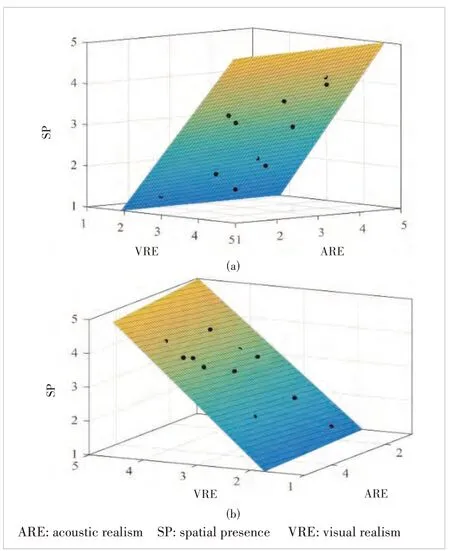
▲Figure 13. Relationships between the two types of realism and the spatial presence
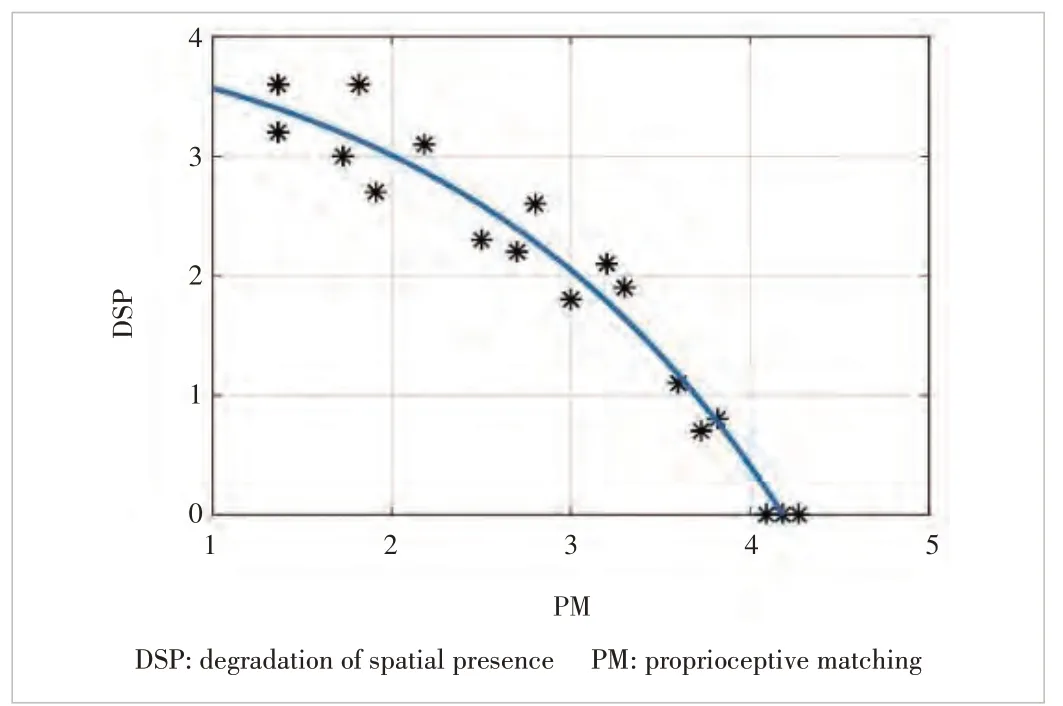
▲Figure 14. Relationships between the proprioceptive matching and degradation of spatial presence
wherev23,v24andv25are equal to -0.467 9, 0.533 8 and 4.367,respectively. Hence, the spatial presence can be calculated by
By utilizing the proposed model, the spatial presence of 360-degree video can be assessed based on the corresponding technical parameters extracted from the VR system.
5 Performance Evaluation
The performance of the proposed model was evaluated on a test set consisting of another four YUV420 360-degree video sequences that had a video resolution of 3 840×1 920 and a video framerate of 30 fps. Screenshots of the video content are shown in Fig. 15. Four lossless audio files (PCM, 48 kHz) containing two channels were utilized as the background sound of these 360-degree videos. The 360-degree videos were firstly down-sampled to 2K resolution and encoded with a BPP of 0.02, 0.06, 0.14, and 0.19 using the x.265 encoder. The audio files were encoded with 16 kbit/s, 64 kbit/s, 128 kbit/s, and 256 kbit/s using the AAC codec. We conducted two experiments to verify the performance of the proposed model by changing the video bitrate, audio bitrate, and MTP latency. In the first experiment, audiovisual files were displayed without MTP latency. The display FOV was set to be 90 degrees and 110 degrees, respectively. The details of the setting are shown in Table 5. In the second experiment, audiovisual files with 4K resolution were displayed with three MTP latencies, i.e.,40 ms, 120 ms, and 260 ms, respectively. The display FOV was set to be 110 degrees. The details of the setting are shown in Table 6. A total number of 30 subjects participated in these two experiments. After each display, the subjects provided their ratings on the spatial presence on a five-point scale.
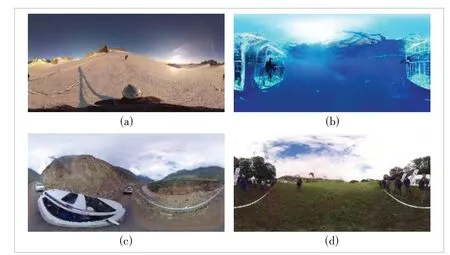
▲Figure 15. Content of test sequences: (a) Driving, (b) Shark, (c) Glacier, and (d) Paramotor
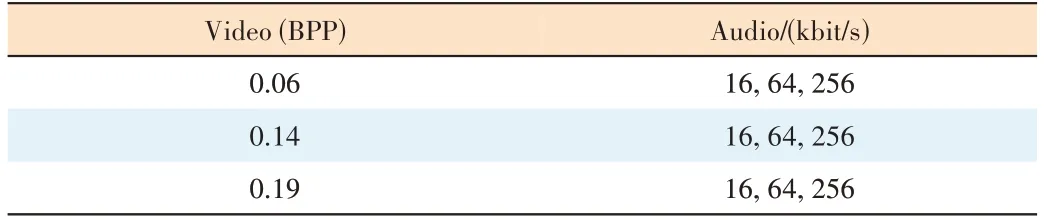
▼Table 6. Setup for the audio
Since there is no model evaluating the spatial presence that can be used as a comparison, we only show the performance of the proposed model. The performance is evaluated in two ways: 1) comparing predicted scores of the spatial presence with the subjective MOS, and 2) comparing the predicted scores with the subjective scores rated by individuals.
5.1 Predicted Scores vs MOS
Three commonly used performance criteria are employed to measure the performance of the proposed model: Pearson Correlation Coefficient (PCC), Root-Mean-Squared Error (RMSE),and Spearman Rank Order Correlation Coefficient (SROCC).
The model performance is given in Table 7. It can be found that reliable prediction performance is obtained when using the proposed spatial presence evaluation model.
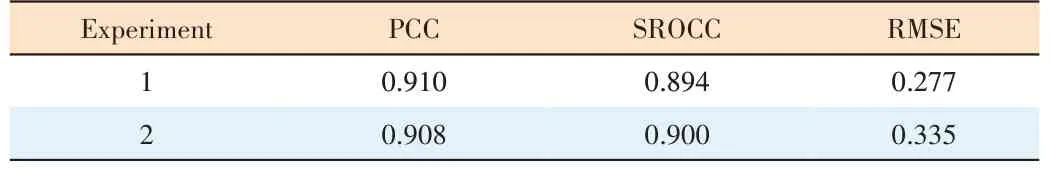
▼Table 7. Experimental results
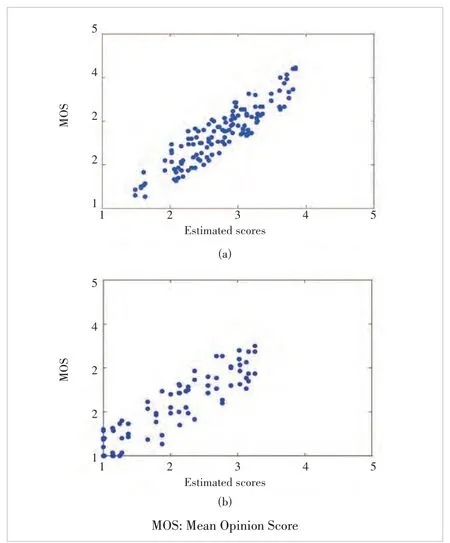
▲Figure 16. Scatter plots of the subjective spatial presence versus predicted objective scores: (a) result of Experiment 1 and (b) result of Experiment 2
To visualize the performance, Fig. 16 shows the scatter plots of objective scores predicted by the proposed model against the subjective MOSs. This figure clearly shows that the proposed model exhibits good convergence and monotonicity performance.
5.2 Predicted Scores vs Individual Ratings
To also check the accuracy of the proposed model, we evaluated the performance of the model against the individual ratings of subjects. Again, PCC, SROCC, and RMSE were calculated. For Experiment 1, we found that the PCC,SROCC, and RMSE ranged from 0.882 to 0.926, 0.878 to 0.922, and 0.443 to 0.227, respectively. For Experiment 2,we found that the PCC, SROCC, and RMSE ranged between 0.886 to 0.924, 0.881 to 0.918, and 0.462 to 0.214. Among the 30 subjects, the lowest, medium and highest prediction results are shown in Table 8. It can be found that a relatively good prediction performance is always guaranteed using the proposed model.
We also calculated the percentage that the predicted scores match the subjective scores to better verify the accuracy of the proposed model. A match is found if a predicted score (after the rounding process) is the same as the subjective score rated by the participants. The results show that the proposed model matches the subjective ratings with an accuracy of 83.7% and 82.4% for Experiments 1 and 2, respectively. It can be concluded that the proposed model manifests itself as a reliable spatial presence indicator that can be directly used in current 360-degree video applications.
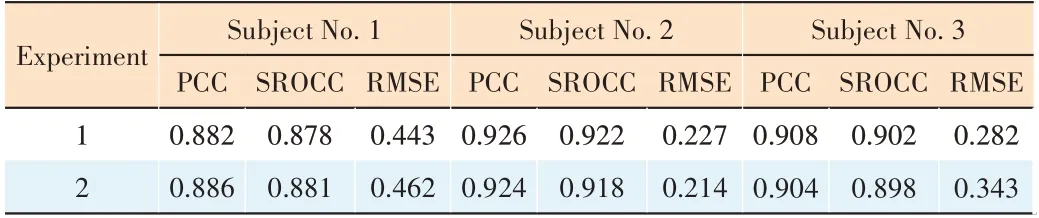
▼Table 8. Model performance
6 Conclusions
In this paper, we propose a spatial presence assessment framework for measuring users’ sense of spatial presence in 360-degree video services. Well-designed subjective experiments are conducted to obtain accurate subjective ratings of spatial presence. An objective spatial presence prediction model is further proposed. Experimental results show that the proposed model can achieve good prediction accuracy in terms of PCC, SROCC, and RMSE. The proposed scheme serves as guidelines for the research community to better understand the spatial presence perception. It also provides valuable recommendations for the industry to further improve its quality of service.
杂志排行

ZTE Communications的其它文章
- Table of Contents, Volume 21, 2023
- Special Topic on 3D Point Cloud Processing and Applications
- Mixed Electric and Magnetic Coupling Design Based on Coupling Matrix Extraction
- A Hybrid Five-Level Single-Phase Rectifier with Low Common-Mode Voltage
- Incident and Problem Ticket Clustering and Classification Using Deep Learning
- Research on Fall Detection System Based on Commercial Wi-Fi Devices