Incident and Problem Ticket Clustering and Classification Using Deep Learning
2024-01-12FENGHailinHANJingHUANGLeijunSHENGZiweiGONGZican
FENG Hailin, HAN Jing, HUANG Leijun,SHENG Ziwei, GONG Zican
(1. Zhejiang A&F University, Hangzhou 310007, China;2. ZTE Corporation, Shenzhen 518057, China;3. Huazhong University of Science and Technology, Wuhan 430074,China)
Abstract: A holistic analysis of problem and incident tickets in a real production cloud service environment is presented in this paper. By extracting different bags of words, we use principal component analysis (PCA) to examine the clustering characteristics of these tickets. Then Kmeans and latent Dirichlet allocation (LDA) are applied to show the potential clusters within this Cloud environment. The second part of our study uses a pre-trained bidirectional encoder representation from transformers (BERT) model to classify the tickets, with the goal of predicting the optimal dispatching department for a given ticket. Experimental results show that due to the unique characteristics of ticket description, pre-processing with domain knowledge turns out to be critical in both clustering and classification. Our classification model yields 86%accuracy when predicting the target dispatching department.
Keywords: problem ticket; ticket clustering; ticket classification
1 Introduction
For cloud service providers, maintaining an outstanding service level agreement with minimum downtime and incident response time is critical to the business. In order to provide such a prominent high-level reliability and availability, IT operation plays an important role. However, the emergence of modern computing architectures, such as virtual machines, containers, server-less architecture, and micro-services, brings additional challenges to the management of such environments[1-2].
Problem and incident tickets have been a long-standing mechanism in carrying on any issues reflected by customers,or any alerts raised by monitoring systems. According to the Information Technology Infrastructure Library (ITIL) specification, the incident, problem, and change (IPC) systems fulfill the tracking, analysis, and mitigation of problems[3]. Change requests are nowadays mostly managed differently due to the practice of DevOps. Incident and problem tickets often share the same system and process. An incident or problem ticket usually starts with a short description of the problem that has been originally observed. The ticket itself may be augmented by the personnel assigned along the debugging and resolution process. There are also multiple software platforms and services to help enterprises manage those tickets, including BMC Remedy, IBM Smart Cloud Control Desk, SAP Solution Manager, ServiceNow, etc.[4]
However, dispatching an incident or problem ticket is still basically a manual process depending on human knowledge.Some of the ticket management systems offer insights such as agent skill level, capacity, and relevance. There are some early works attempting to dispatch tickets based on the agent’s speed from historical data[5]. Our observation reveals that dispatching to individual agents might be a secondary issue. Instead, finding the matching department for a specific issue appears to be a primary one especially if a prompt resolution period is the desired outcome. It is not uncommon for some tickets to go through multiple departments before it lands on the right one. For example, a service unavailable problem might be caused by security settings, networking, hosting services, applications, or even databases, and the specific problem may be resolved by one of the departments or by multiple departments.Therefore, it is essential to find the most likely department, especially at the beginning when the problem was initially reported to resolve the issue efficiently. The specific technical challenge of classifying an early ticket is that the only available feature is problem description.
2 Related Work
Since the day when computer systems were created, IT operation has been a critical issue. With the prevalence of online services, in order to minimize system downtime and maintain premium service level agreements, IT operation plays a central role in achieving such a goal. Especially in today’s highly distributed multi-layered cloud environment, it is untrivial to effectively find the matching departments to resolve the issue.
Artificial intelligence has been applied in IT operations, especially in anomaly detection[11-12], problem troubleshooting[13-14], and security[15-16]. A few works have attempted to improve the efficiency of ticket dispatching. BOTEZATU et al.[5]tried to find the most cost-effective agent for ticket resolution, rather than finding a matching group or department.SHAO et al.[17]focused on the transfer information in ticket resolution and formulated a model based on prior resolution steps. AGARWAL et al.[18]used a supported vector machine and a discriminative term to predict the matching department.While we use ticket descriptions and other attributes to find the best department, our solution is quite different from the previous works.
In terms of ticket analysis, there are only a few works on alerts or ticket clustering. LIN et al.[19]used graph theory and similarity measures as Jaccard as the cluster mechanism.MANI et al.[20]proposed a technique combining latent semantic indexing and a hierarchicaln-gram algorithm. AGARWAL et al.[21]used a mixture of data mining, machine learning, and natural language parsing techniques to extract and analyze unstructured tests in IT tickets. JAN et al.[22]proposed a framework for text analysis in an IT service environment. We examine the clustering characteristics to discover the content of the ticket descriptions specific to the system under investigation.Our approach is generic to all systems with minor adjustments of synonyms and user dictionaries. When it comes to clustering itself, we believe our dataset is also unique as it is from the latest container-based cloud environment which is more complicated than prior systems.
3 Design of Clustering System
We apply different topic modeling algorithms to cluster the tickets based on their descriptions and compare their performance by calculating their sum of square error (SSE) and silhouette scores. The clustering results indicate the number of major topics in the ticket description corpus. Since it is an unsupervised learning process, it saves great effort from data annotation. For ticket classification, word embedding models have shown much better performance. Therefore, we only adopt the supervised approach using a pre-trained BERT model[6]which is fine-tuned with domain-specific labeled data.
Fig. 1 illustrates the overall steps we perform ticket description clustering. First, data preprocessing is performed by extracting texts, merging synonyms, removing stop words, etc. After tokenizing the texts, we construct 4 types of bags of words(BoW), including binary BoW, term frequency (TF) BoW, term frequency inverse document frequency (TF-IDF)[7]BoW, and expert-weighted BoW. For each of the BoW, we apply principal component analysis (PCA) to check for clustering possibility and use K-Means to cluster the topics. We also perform latent dirichlet allocation (LDA)[8]for topic extraction and modeling.Finally, we show some of the sample topics in the cluster.

▲Figure 1. Data analysis flow
4 Experiments
We use two datasets from an enterprise-scale cloud provider, comprising 468 infrastructure-level and 787 Platform as a Service (PaaS)-level incident tickets, respectively. Since both datasets have similar data formats, we use the same analysis methods, which are mainly unsupervised machine learning approaches such as K-means and LDA. Our goal is to learn and make use of the inherent homogeneity of the complicated ticket descriptions by analyzing them.
For model training, we use the number, title or subject, and description from the datasets, in which the title or subject is a summary of the incident, and the description is a detailed text describing the problem. Some of the description texts are in the semi-structured form. For example, more than half the infrastructure-level ticket descriptions consist of explicit attributes like symptoms, progress, network topology, conclusions,steps, and remarks. We focus on the symptom attribute rather than using the entire text body since prediction needs to be performed when the ticket only has a symptom description.Some of the corpus such as file names, URL links, and system logs are filtered as part of preprocessing.
4.1 Data Preprocessing
We extract the text of the symptom attribute from the ticket description. If the description does not contain an explicit attribute of “symptom”, the whole text is used. For the symptom text, we utilize regular expressions to filter unwanted data like picture-attached file name, date, time, URL and also delete the system logs as many as possible. We also perform spell checking using a dictionary.
Our next step is to convert the symptom texts into individual word tokens. Since most of the incident descriptions are a mixture of both Chinese and English, we use different tokenization tools for each language. “Jieba” is used for Chinese and “spaCy”for English. We also remove stop words from the output token and merge synonyms, e.g., “db” and database are the same, so they are uniformly replaced by a database. The lists of stop words are from Baidu[9]and github[10].We merge both and extend some ticket-specific stop words for the experiments.
Given that some titles are similar to the symptom in terms of interfering texts and marks, they are preprocessed in the same way. The process described above ultimately generates a list of most frequently used tokens in both the title and symptom token lists. We sample high frequency Chinese and English words from the results, which are shown in Table 1.
4.2 Clustering Using BoW Models
First, we study the clustering characteristics of the incident tickets using the BoW model. For the tokens we extract during preprocessing, we choose the top high frequency words fortitle and symptom respectively. We combine the tokens from title and symptom based on a predefined weight so that each ticket is transformed into a word frequency vector, and accordingly, the dataset is represented by a word frequency matrix.
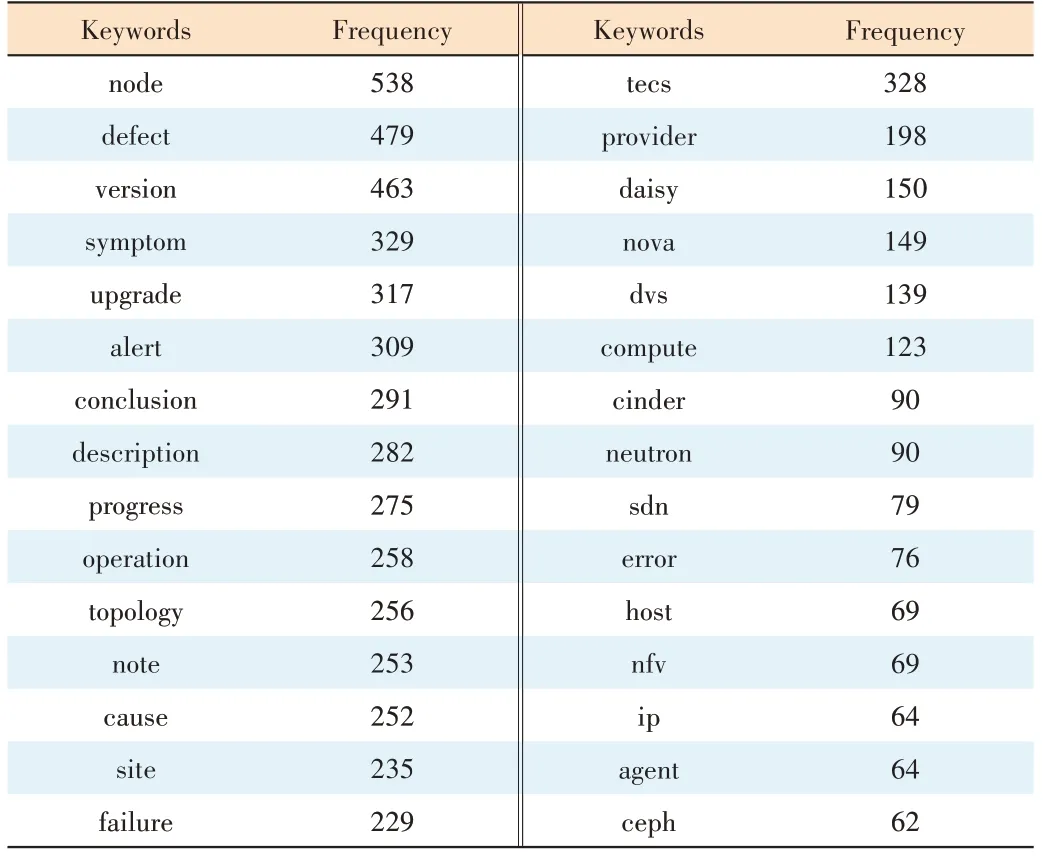
▼Table 1. Sample of high frequency words
We apply principal component analysis (PCA) to the normalized word frequency matrix of the dataset, aiming to select the number of appropriate components using cumulative explained variance results. For example, Fig. 2 shows the PCA results of the symptom word frequency matrix, indicating that if 100 components are selected, and more than 90% of the variance can be explained.
After the number of the principal components is selected,we project the word frequency matrix to these components and use K-means for clustering analysis. For a given range of cluster numbers (i.e., values ofK), we generate SSE and silhouette coefficient curves. As the best practice, the number of clusters is determined at the inflection point of the downward trend SSE curve or at the point when the upward trend silhouette coefficient curve becomes a plateau. The results are shown in Fig. 2. The SSE curve does not show an obvious inflection point, and the absolute value of the silhouette coefficient is too small even though the trend meets the demand(silhouette coefficient is between -1 and 1. The closer it is to 1, the more reasonable the clustering is). We conclude that it may not be a viable approach to evaluating the best cluster size by using PCA.
We also perform experiments using other models such as TF-IDF to generate a word frequency matrix, and the results are similar to PCA, indicating the word frequency matrix may not apply to incident tickets.
4.3 Clustering Using Latent Dirichlet Allocation (LDA)Model
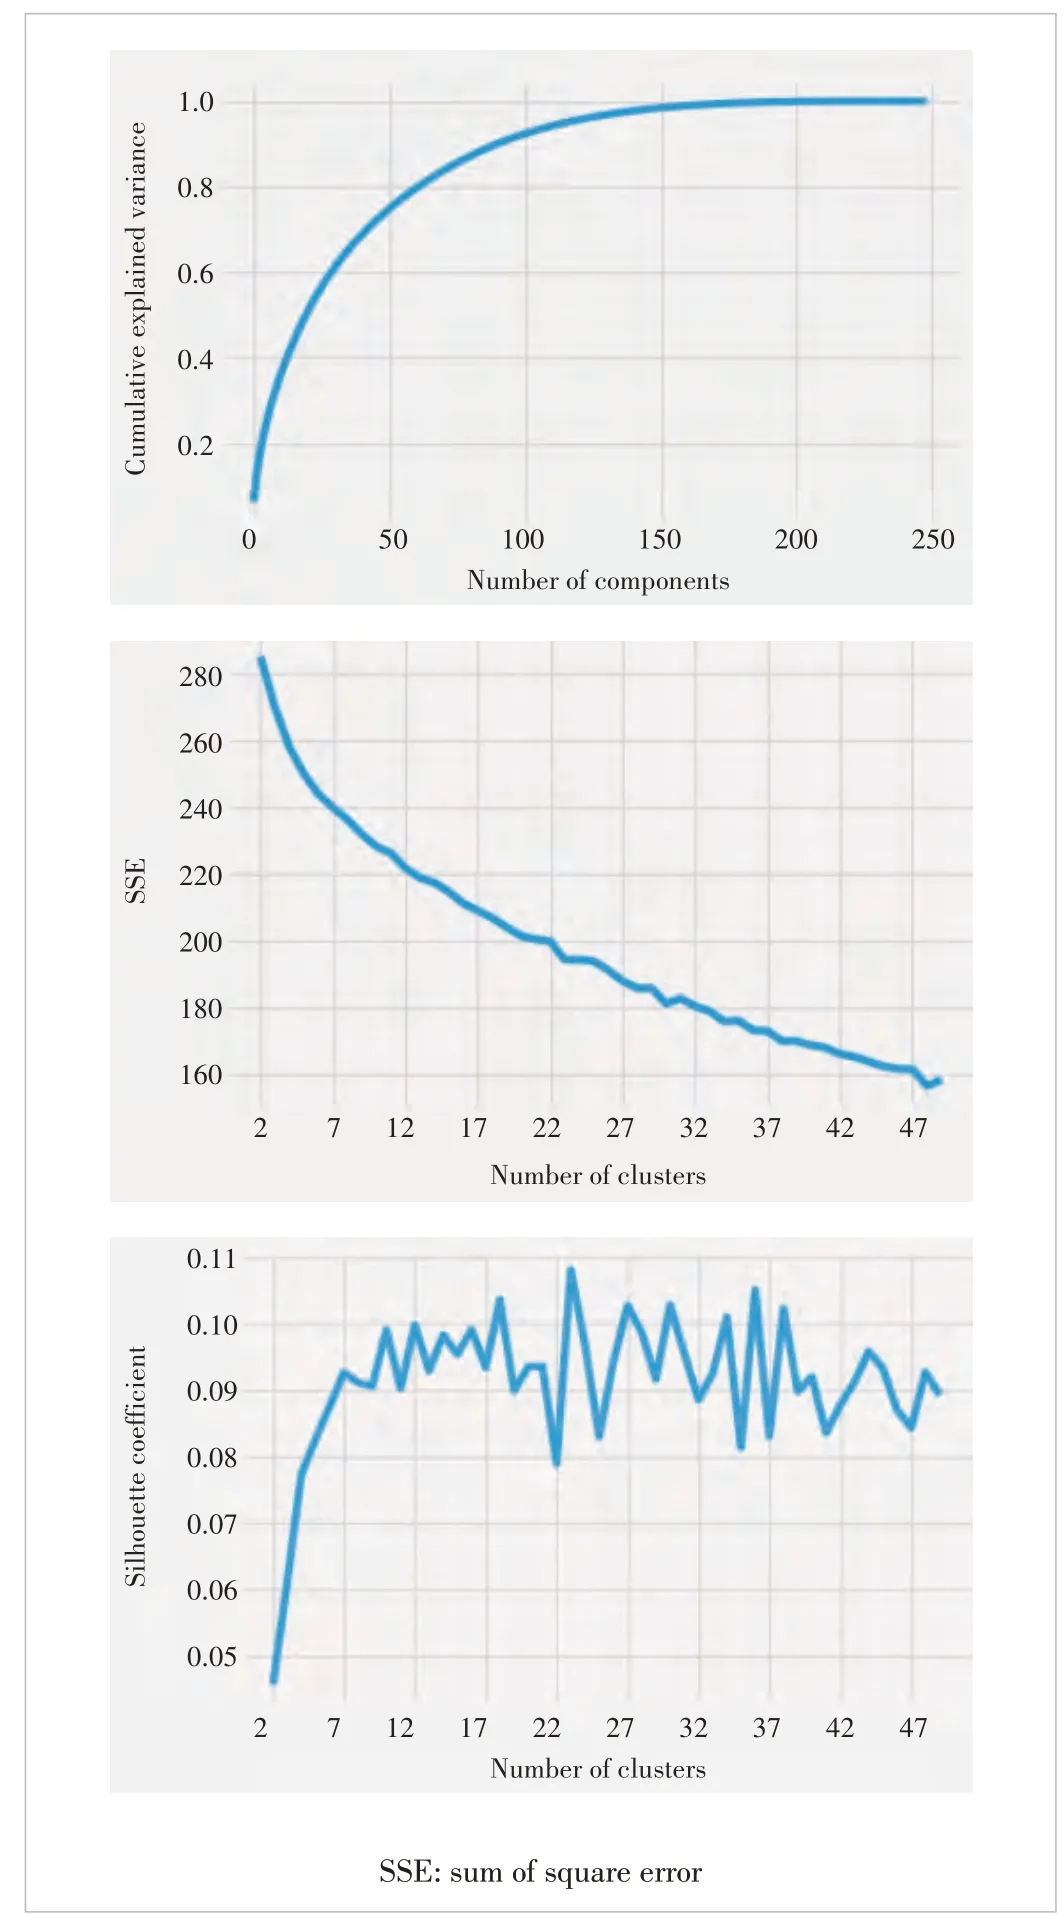
▲Figure 2. Principal component analysis (PCA) results, K-means SSE,and K-means silhouette curves using bag of words (BoW) model
In this section, we use LDA to extract dominant topics from the topic, symptom, and the combined token list. To determine the performance of the optimal number of topics, we compare different perplexity scores and coherence scores when applying different topic numbers. We select the topic number at the inflection point where the perplexity curve or the coherence curve turns.
Fig. 3 shows the results of the cloud infrastructure ticket data using LDA with 1-30 topics. Based on the characteristics of the curves, we can select the number of topics to be 14.The top ten keywords and the probabilities for each of the topics are shown in Table 2.
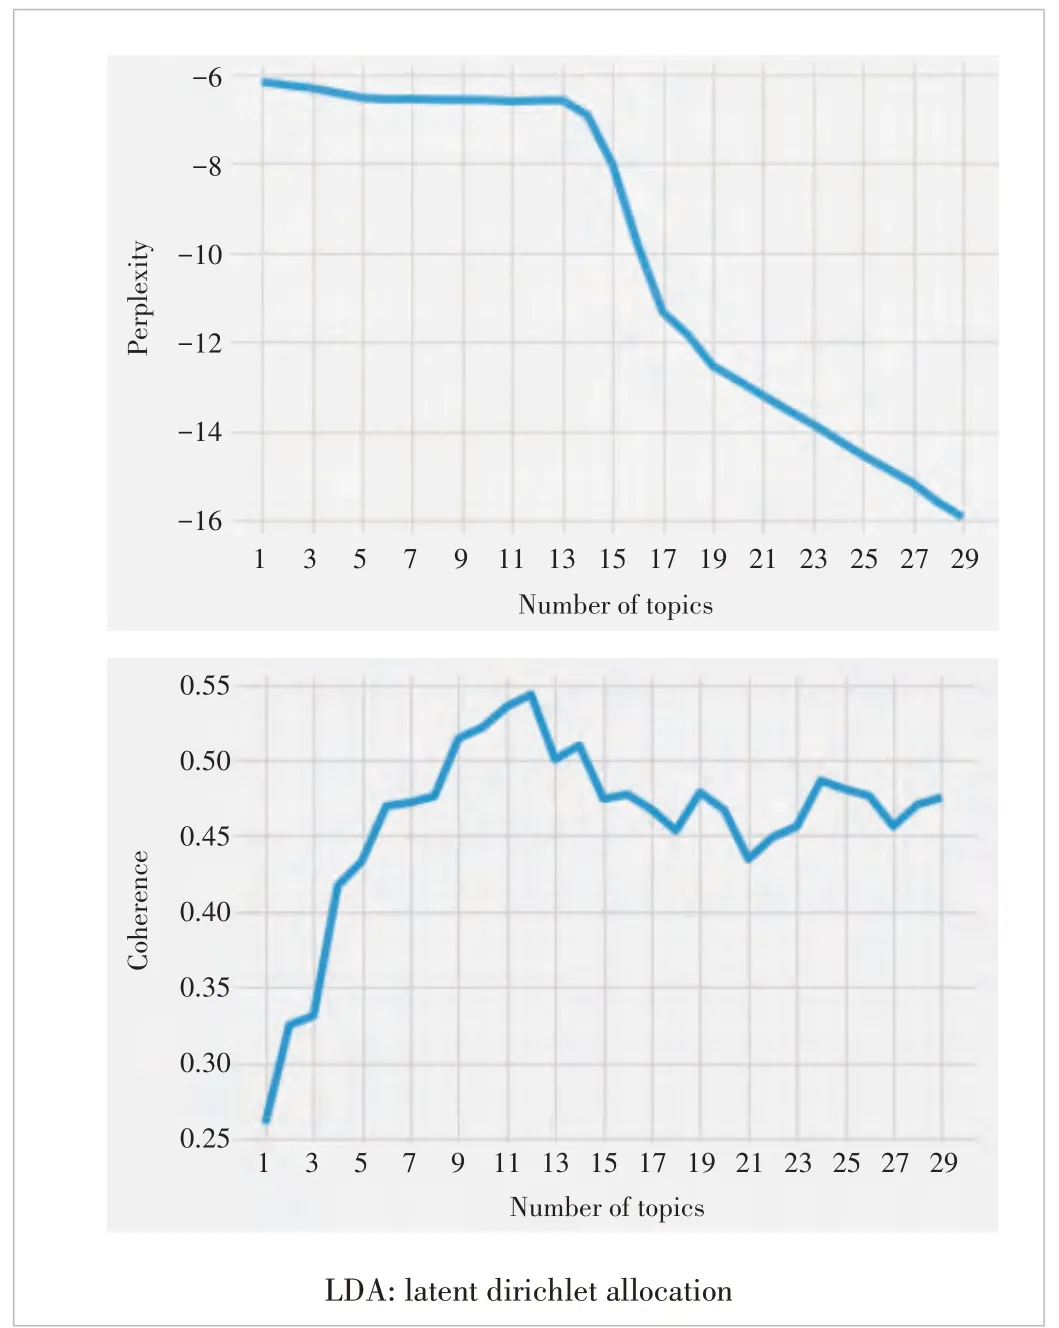
▲Figure 3. LDA perplexity and coherence curves
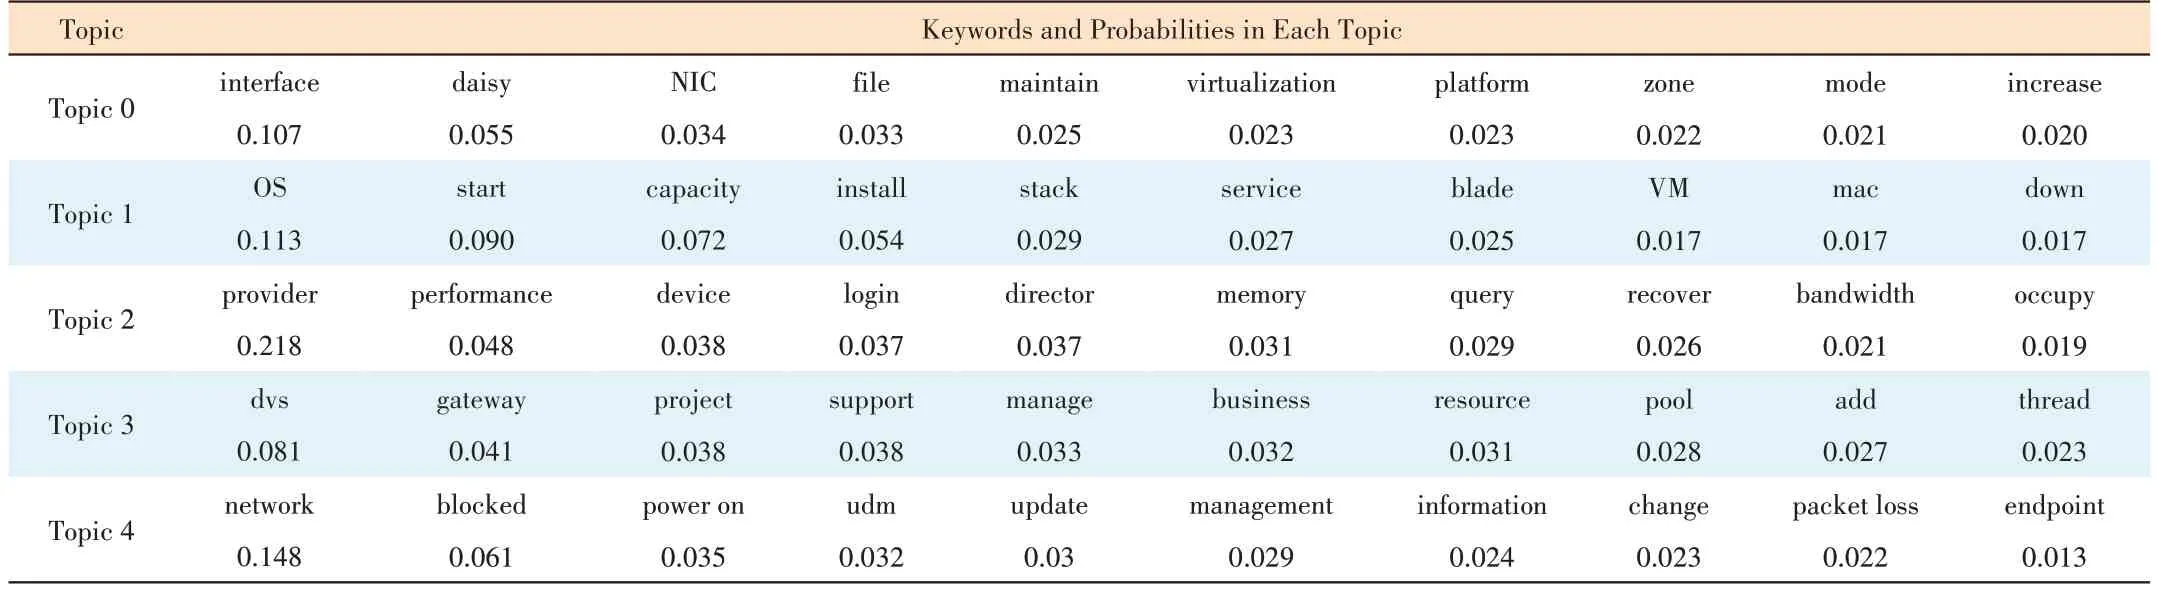
▼Table 2. Topics and keywords in each topic
We evaluate the probability of topic appearance for each incident ticket and then cluster the topics usingK-means. Fig. 4 shows the SSE curve and silhouette coefficient curve respectively. The curves demonstrate more significant turning points than the ones using the BoW model, indicating the LDA model is more suitable for incident ticket clustering.
With 14 topics, the SSE of LDA-allocated tokens is about 20, while the SSE of BoW is about 215, an order of higher magnitude. Though it is unpragmatic to map the SSE score to the exact accuracy, the lower the score the more accurate the prediction. Similarly, the silhouette coefficient for LDA results with 14 topics are about 0.37, compared with less than 0.10 using BoW models. As the score measures how apart of the cluster ranging from -1 to 1, a value close to 1 indicates clearly distinguished clusters.
Table 3 shows the titles of tickets in one cluster. Storage related problems consist of a majority of the tickets, especially during upgrade and backup stages. The next is networking issues.
4.4 Incident Ticket Classification and Prediction

▲Figure 4. K-means SSE and silhouette curves using latent Dirichlet allocation (LDA) model

▼Table 3. Samples of title descriptions in one cluster
Our ticket clustering experiments reveal that incident tickets do have clustering characteristics. In order to take full advantage of prior knowledge, e.g., to assign coming tickets to the same department which has resolved similar ones before,we study the classification and prediction of incident tickets in this section. We use a similar dataset with more fields, including ticket ID, ticket description, resolution, resolution groups, categories, sub-categories, and components. After removing null values, the categories and record numbers are shown in Table 4.
There are 115 sub-categories and 49 of them contain 1 000 records or more. The 49 sub-categories consist of 96% of the total tickets, and 30 of them contain 3 000 records or more consisting of 87% of the total records. When it comes to components, there are 663 in total, among which there are 88 items with more than 1 000 records accounting for 79% of the total amount, and 34 items with more than 3 000 records ac-counting for 54% of the total amount.

▼Table 4. Categories and record numbers
In order to achieve fine granularity of the classification, we use the combination of sub-categories and components as the label. There are 29 top labels with more than 3 000 records.
We compare multiple classification algorithms including TF-IDF, LDA and BERT. As expected, BERT achieved the best precision and recall for the same dataset. Both TF-IDF and LDA with the regression model yield a prediction accuracy of less than 80%. We build the incident classification model based on BERT which is shown in Fig. 5.
1) Architecture of our model
· The input layer is a text layer with preprocessed incident description text.
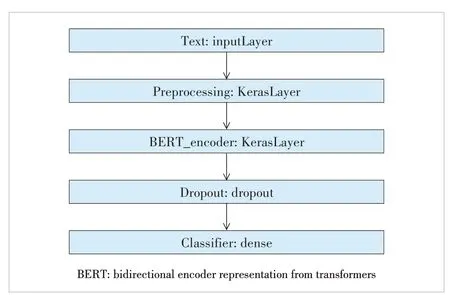
▲Figure 5. BERT classification network architecture
· The preprocessing layer is a Chinese processing model devised by Google (suited for the BERT model). Every ticket text is transformed into 3 vectors: input_word_ids, input_mask and input_type_ids with 128 dimensions respectively. Input_word_ids denotes the ID of the word. The lost elements of input_word_ids vector are filled with 0. For the corresponding numbers in an input_mask vector, they should be 1 while the remaining elements are 0. Input_type_ids can clarify different sentences. In this classification study, we set all of its elements to 0.
· BERT_encoder is an advanced BERT model devised by Google. BERT_encoder has 12 layers (bert_zh_L-12_H-768_A-12|) and the output of the BERT_encoder consists of pooled_output (each text corresponds to a vector of 768 elements), sequence_output (each word in each text corresponds to a vector of 768 elements) and encoder_outputs (output of inner units). We only focus on pooled_output in this experiment.
· The dropout layer aims at avoiding overfitting. The probability of dropout is set to 0.1.
· The classifier layer is a fully connected layer that outputs the probability of each ticket belonging to a certain classification in the labels.
2) Training and testing data preparation
We use the following steps as data preprocessing to generate training and testing data:
· Delete all the incident tickets containing null value category information or empty ticket descriptions.
· Modify the classification labels into lowercase and delete the redundant blank space. This operation is devised from observing the original data, where some categories and items are generally the same but only differ in lowercase and uppercase.For example, iCenter and Icenter.
· Delete tickets with ambiguous items and category labels like“other, others, to be classified, and other pending problems”.
· Merge the item and category labels in the form of component.category such as intelligent maintenance.itsp serve website.
· After the merging operation, delete labels and their incident tickets data whose statistic number is less than the threshold (we set 3 000 in this experiment).
· Remove HTML formatting and redundant space (including line feed punctuation) from the incident description texts. For the English content, all the letters are also put in lowercase.
· Shuffle the resulting incident data. 70% of the dataset is utilized as the training set and the remaining 30% is used as the test set.
· Each classification label and its quantity of relevant incident tickets are given in Table 5 (29 classification labels with more than 3 000 records respectively are reserved).
As a result, 103 094 incident tickets are identified as training data and 44 183 incident tickets are collected as test data.
For training the model, we adopt the Sparse Categorical Crossentropy as the loss function, Sparse Categorical Accuracy for accuracy measurement and optimize the model with AdamW. The experiment sets the initial learning rate to 3e-5 and the epoch to 5. The original training data are partitionedinto a training set and a validation set at the ratio of 9∶1 in this pre-training procedure (i.e., the number of incident tickets used for model training is the number of preprocessed incident tickets × 70% × 90%).

▼Table 5. Top labels (combination of sub-categories and components)and record numbers
Fig. 6 shows the training loss, training accuracy, validation loss, and validation accuracy of each epoch.
To verify our model after pretraining, we perform classification tasks on the test set. The assessment results are illustrated in Table 6. The overall precision is up to 86%. The confusion matrix of prediction results is shown in Table 7. The number in cell (i, j) denotes the number of tickets, the labels of which areibut predicted to bejin this model. Therefore,the numbers of correctly classified incident tickets lie on the diagonal while the number lying off the diagonal shows the discrepancies in classification.

▲Figure 6. Training loss and accuracy vs validation loss and accuracy

▼Table 6. Prediction accuracy on test data
From Table 8, we can see that a majority of classification error cases occurs among different items of the same subcategories. For example, it is confusing for the model to classify the items of some sub-categories like desktop cloud, PC side zmail incidents, ifol finance and uds failure. In addition,7.4% tickets of OS issues - installation are wrongly predictedto be AIOps-itsp service website and 7.4% tickets of individual network issues-restriction are wrongly predicted to be network proxy-usage issues.

▼Table 7. Confusion matrix of prediction results
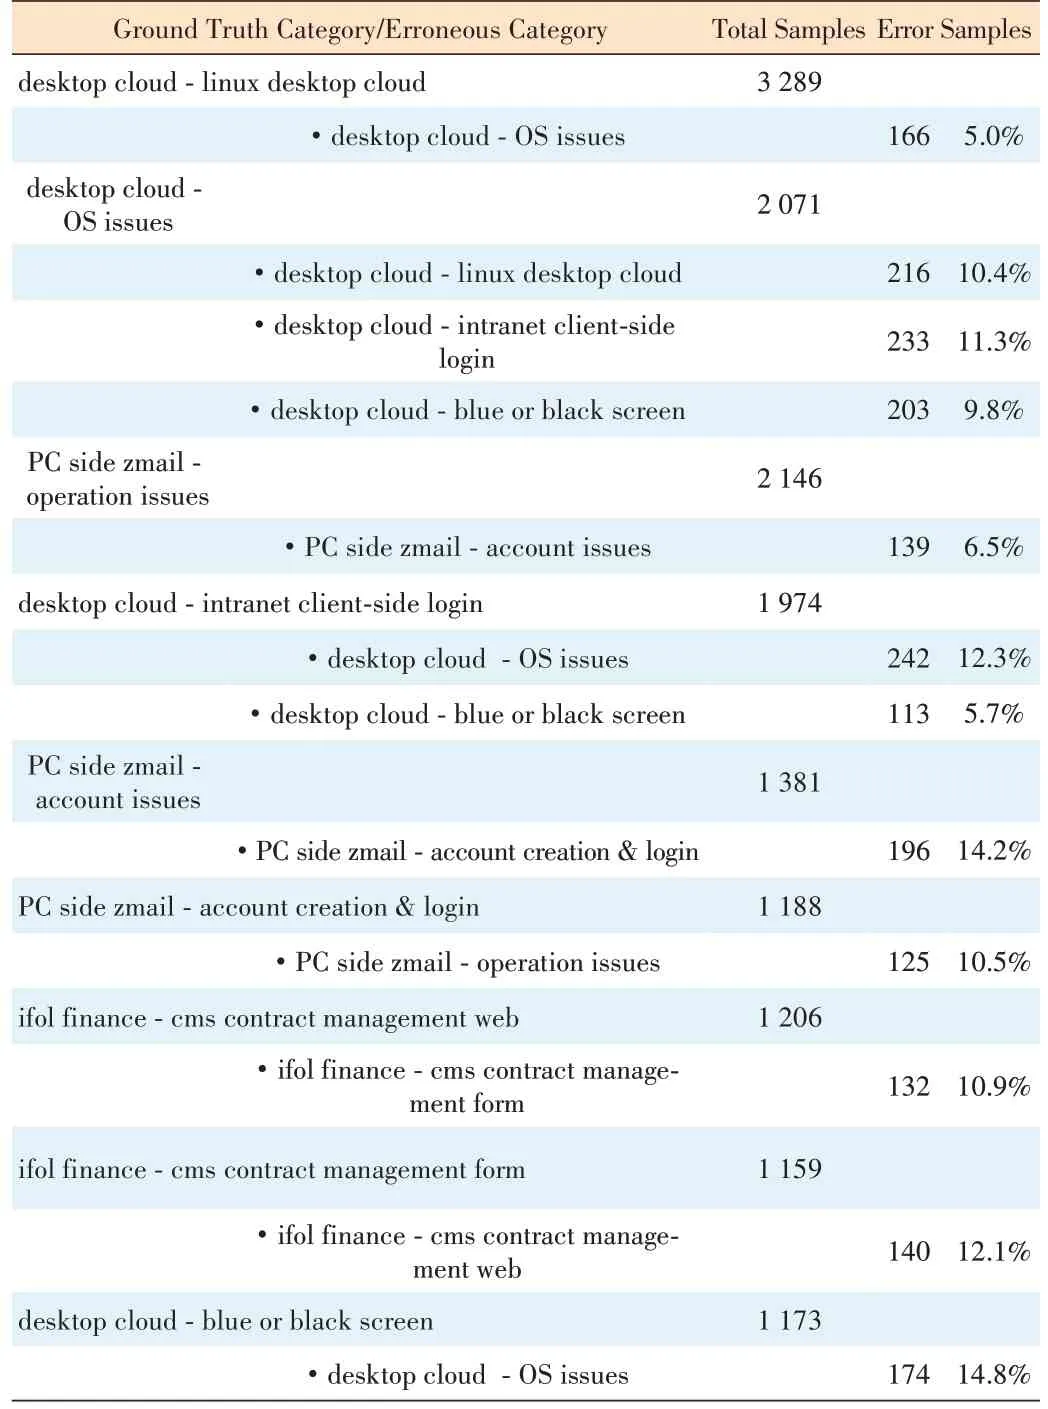
▼Table 8. Sample labels of classification error

AIOps: artificial intelligence for IT operations
5 Conclusions
In this paper, we demonstrate the semantic characteristics of problem and incident tickets. Taking the ticket data from a real production Cloud environment, we compare different text mining techniques. LDA and K-Means are applied to show the ticket clusters. We use BERT as the deep learning framework with fine-tuning to build a resolution department matching system. Using sub-category and component fields in the ticket description, our classification model achieves 86% accuracy when predicting the best match department to resolve the ticket.
杂志排行

ZTE Communications的其它文章
- Table of Contents, Volume 21, 2023
- Special Topic on 3D Point Cloud Processing and Applications
- Beyond Video Quality: Evaluation of Spatial Presence in 360-Degree Videos
- Mixed Electric and Magnetic Coupling Design Based on Coupling Matrix Extraction
- A Hybrid Five-Level Single-Phase Rectifier with Low Common-Mode Voltage
- Research on Fall Detection System Based on Commercial Wi-Fi Devices