Research on Fall Detection System Based on Commercial Wi-Fi Devices
2024-01-12GONGPanyinZHANGGuidongZHANGZhigangCHENXiaoDINGXuan
GONG Panyin, ZHANG Guidong, ZHANG Zhigang,CHEN Xiao, DING Xuan
(1. School of software, Tsinghua University, Beijing 100084, China;2. ZTE Corporation, Shenzhen 518057, China;3. State Key Laboratory of Mobile Network and Mobile Multimedia Technology, Shenzhen 518055, China)
Abstract: Falls are a major cause of disability and even death in the elderly, and fall detection can effectively reduce the damage. Compared with cameras and wearable sensors, Wi-Fi devices can protect user privacy and are inexpensive and easy to deploy. Wi-Fi devices sense user activity by analyzing the channel state information (CSI) of the received signal, which makes fall detection possible. We propose a fall detection system based on commercial Wi-Fi devices which achieves good performance. In the feature extraction stage, we select the discrete wavelet transform (DWT) spectrum as the feature for activity classification, which can balance the temporal and spatial resolution. In the feature classification stage, we design a deep learning model based on convolutional neural networks, which has better performance compared with other traditional machine learning models. Experimental results show our work achieves a false alarm rate of 4.8% and a missed alarm rate of 1.9%.
Keywords: fall detection; commercial Wi-Fi devices; discrete wavelet transform; deep learning model
1 Introduction
Population aging is a common phenomenon in the world today, and the health as well as safety of the elderly is a growing concern. Every year, one-third of the elderly people over 65 fall down, resulting in injury or even death[1]. Most of the elderly deaths caused by falls are due to untimely treatment, so fall detection has become an important method to prevent fall-related deaths in the elderly.
Extensive research has been conducted on fall detection techniques. Traditional methods mainly use cameras[2-3],wearable sensors[4-5], and ambient environment sensing-based approaches[6-8]for fall detection. Camera-based detection systems require infrastructure deployment and video data collection, which raises the user’s privacy concerns. Solutions based on wearable sensors require users to carry specific devices, which is inconvenient. Ambient environment sensingbased approaches require specific infrastructures (e.g., radar and infrared) and are expensive, which prevents them from pervasive applications. Therefore, it is important to find a fall detection solution that is device-independent, privacy protecting, secure, inexpensive and easy to deploy. The emergence of commercial Wi-Fi[9-10], which can effectively meet these conditions, has also received a lot of attention from researchers.Wi-Fi devices sense the user’s activity by analyzing the channel state information (CSI) of the received signal, which enables various applications such as gesture recognition[11-12],gait recognition[13-14], and trajectory tracking[15-16], and therefore we have found an opportunity that Wi-Fi has the feasibility of performing fall detection.
Most existing work can be divided into two stages: feature extraction and feature classification. Feature extraction refers to the extraction of parameters from the original Wi-Fi signal as human fall features, and feature classification refers to the construction of classifiers to identify fall actions based on various classification methods. In feature extraction, most existing work can be divided into two categories. The first category is to directly use the original features in the received signal,mainly the amplitude and phase information of CSI, including WiFall[17], RT-Fall[18], Anti-Fall[19], FallViewer[20], etc. WiFall is the first work that utilizes commercial Wi-Fi devices for fall detection, which characterizes human activity by using the fluctuation of the amplitude of CSI. Furthermore, Anti-fall combines the amplitude and phase information of CSI to characterize human activities. Considering that the phase of CSI collected by commercial devices contains random noise, RTFall reduces the impact of random phase by calculating the phase difference of different receiving antennas and uses the amplitude and phase difference information of CSI to demonstrate human activities. FallViewer designs a series of CSI denoising schemes to obtain more refined CSI information for characterizing human activities. These works all utilize traditional machine learning approaches such as support vector machines (SVM) to classify activity and perform fall detection.The second category is to process the received signal in the time and frequency domain to obtain higher-order features,such as the short time Fourier transform (STFT) spectrum, and this type of work includes FallDeFi[21], TL-Fall[22], CNNFall[23],etc. Both FallDeFi and CNNFall utilize denoising of CSI and perform STFT to extract Doppler frequency shift information to characterize user activities. FallDeFi extracts statistical features from the Doppler frequency shift and selects the features that are closely related to human activities, using SVM for classification. On the other hand, CNNFall uses a convolutional neural network model to classify Doppler information and perform fall detection. The original features of CSI are influenced by the environment, which makes it difficult to represent human activities; the STFT spectrum has a fixed window size, which cannot balance the temporal and spatial resolution. Most existing works[17-22]in feature classification have used traditional machine learning schemes for classification,such as SVM and random forests. A small number of works have implemented a classification based on deep learning models[23]. In these traditional machine learning solutions, statistical features are extracted without clear physical meanings.In order to better meet the practical needs, we are devoted to designing a fall detection system based on commercial Wi-Fi devices, which increases the system performance and minimizes the computational complexity of the system. In the feature extraction stage, we extract the discrete wavelet transform(DWT) spectrum from the received raw signal as a feature to characterize the person’s activities. Theoretically, using different window sizes to extract human activity information in different frequency bands of the DWT spectrum can maintain high frequency resolution in the low-frequency band and high time resolution in the highfrequency band, which is more flexible than using a fixed window size. In addition, DWT spectrums can reduce the interference of the surrounding environment on the channel state information and mitigate the impact of environmental changes. In the feature classification stage, we design a deep learning model based on convolutional neural networks to build a classifier to identify the fall action. Compared with traditional machine learning models, deep models can better extract high-order spatio-temporal information about human activities and obtain more universal representations of human activities. Meanwhile, we evaluate the system based on the data collected on commercial Wi-Fi devices. The evaluation results show that the performance is better than existing fall detection work and other combined schemes, and the complexity of the model is less than other deep classification models. In summary, the main contributions of this paper are as follows.
1) We propose a new fall detection solution based on commercial Wi-Fi devices, which achieves better performance with less computation costs compared with existing solutions.
2) We select the discrete transform wavelet spectrum as the feature for activity classification, which has better environmental robustness compared with the original feature.
3) We design a deep learning model based on convolutional neural networks, which can extract higher-order features and better characterize human activities compared with traditional machine learning models.
4) We have conducted extensive experiments, including both fall and non-fall. The experimental results show that our work outperforms existing fall detection work and other combined schemes, and achieves a false alarm rate of 4.8% and a missed alarming rate of 1.9%.
The rest of this work is organized as follows. Section 2 presents the design of the system, Section 3 evaluates the implemented system, and Section 4 summarizes this work.
2 System Design
2.1 System Overview
The overall framework design of the system is shown in Fig. 1. In the data collection module, we use commercial Wi-Fi devices to collect CSI of different activities of people. The feature extraction module preprocesses the received raw CSI information and then extracts the DWT spectrum as the features for activity classification. The feature classification module uses a deep learning model to analyze the spatial features of the input feature spectrum images and perform binary classification to determine the presence of fall activities. We will introduce feature extraction and feature classification respectively in Sections 2.2 and 2.3.
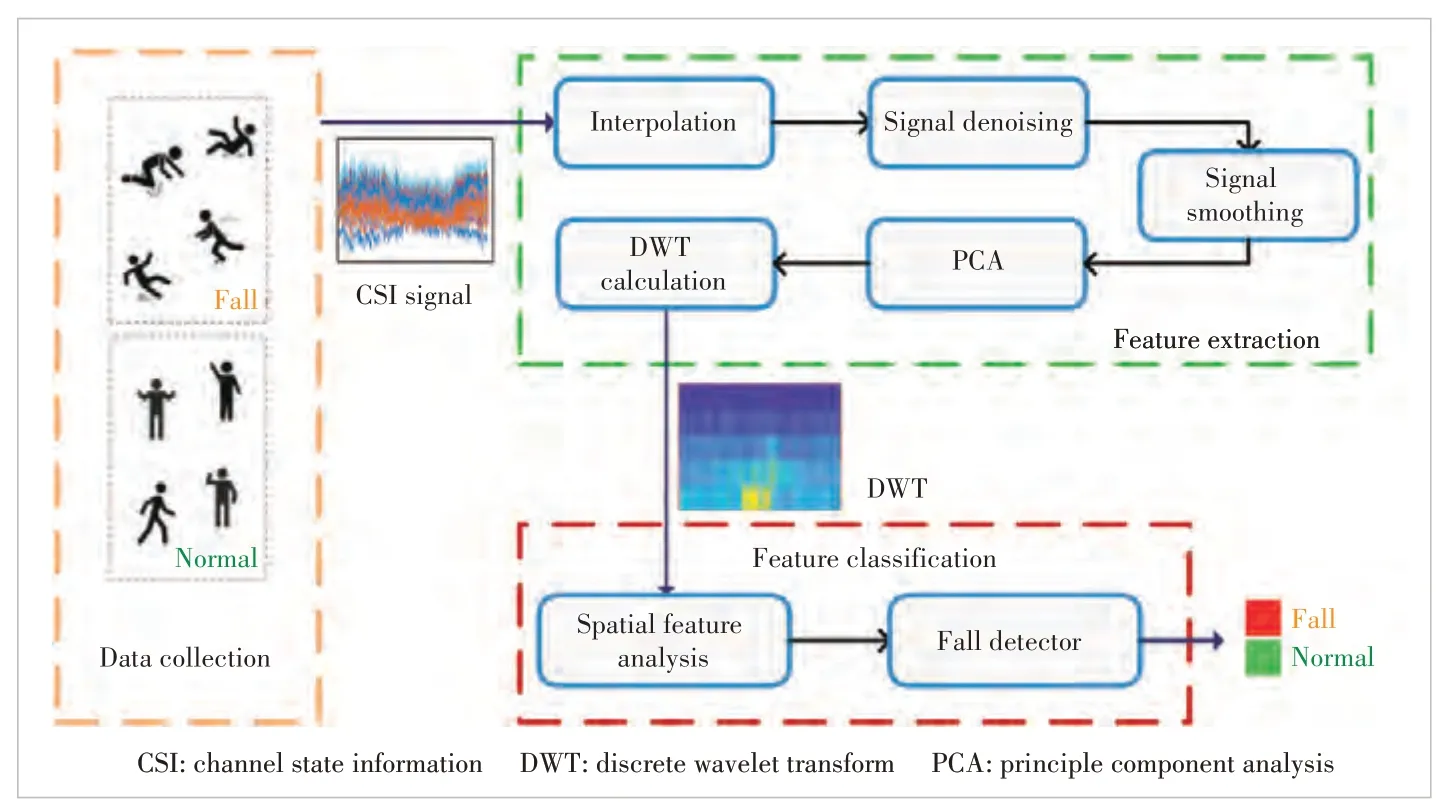
▲Figure 1. System framework diagram
2.2 Feature Extraction
The feature extraction module extracts the corresponding features from the CSI information received by the commercial Wi-Fi device, which is used to characterize the activity of a person to identify the person’s activity. CSI reflects the information of the physical layer channel and represents the channel response of the wireless link[24]. CSI is the channel attribute of the communication link, which represents the fading factor of the signal between the transmitter and the receiver for each transmission path between the transmitter and the receiver as a fading factor. LetX(f,t) andY(f,t) be the frequency domain responses of the transmitter and receiver at momenttand subcarrierf, respectively, then the following relationship exists between them,
whereY(f,t) represents the channel frequency response(CFR), which is the frequency domain representation of CSI,and is usually a complex value. In practice, there are usually multiple propagation paths between the transmitter and the receiver, so it can be written in the following form:
whereNis the number of multipaths, andαk(f,t) andτk(t)represent the attenuation coefficient of thek-th propagation path and the propagation delay, respectively. In this experiment, the CSI information obtained from each receiver antenna contains 30 subcarriers[25]. In this system, we use the amplitude information of CSI for subsequent data processing.
As shown in Fig. 1, feature extraction in this system mainly includes signal interpolation, signal denoising, signal smoothing, principal component analysis, and DWT calculation[22].
1) The purpose of signal interpolation is to obtain uniformly distributed samples. During the transmission of Wi-Fi signals, due to airport blocking and other reasons, the received data packets may have uneven sampling in the time domain. The theoretical analysis of the time-frequency domain in signal processing is based on the assumption of uniform sampling. Therefore, if the actual sampling is non-uniform, the results of video analysis will contain noise, and interference frequencies that are not present in the original signal will appear in the spectrum. This can make the extracted time-frequency domain features unable to fully reflect the activity information of the person, which will affect the classification of the person’s activity. In the system, we perform one-dimensional linear interpolation on the CSI amplitude information extracted from non-uniform sampling[18]to reduce the impact of non-uniform sampling.
2) In the signal denoising part, the original CSI is filtered to retain the main components of personnel activities and filter out high-frequency and low-frequency noise. As shown in Fig. 2(a), the original CSI signal usually contains a lot of noise. The noise includes not only low frequency noise such as hardware noise and DC components but also high frequency noise such as signal burst. The main component of human activities that we need is in the middle of high frequency and low frequency. Therefore, we use a band-pass Butterworth filter for filtering. The setting of the low cutoff frequency is based on a balance between the requirements of interference elimination and the loss of low-frequency information. Specifically, the speed of normal human motion does not exceed 4 m/s. The Wi-Fi device operates at 5.825 GHz,and the corresponding Doppler frequency spectrum (DFS) upper limit is calculated to be 80 Hz[32]. Generally, the range of signal low-frequency noise is 0 Hz-4 Hz, and the Doppler frequency deviation caused by personnel activities including falling, walking, bending and sitting is usually not more than 80 Hz. Therefore, we first carry out band-pass filtering on the signal, with a passband range of 4 Hz-80 Hz, to filter out band noise[22]. The filtered CSI signal is shown in Fig. 2(b),and most of the disturbances in the signal have been filtered.
3) Signal smoothing is to better reduce the influence of inband noise and signal jitter on activity recognition. We use the weighted moving average method to smooth the filtered CSI signal. Let’s assume that the sampling sequence of a subcarrier of the CSI at different times isC=[v1,v2,…,vL], then the smoothed CSI sequence is the weighted average of the CSI sampling values at the previous time, that is:
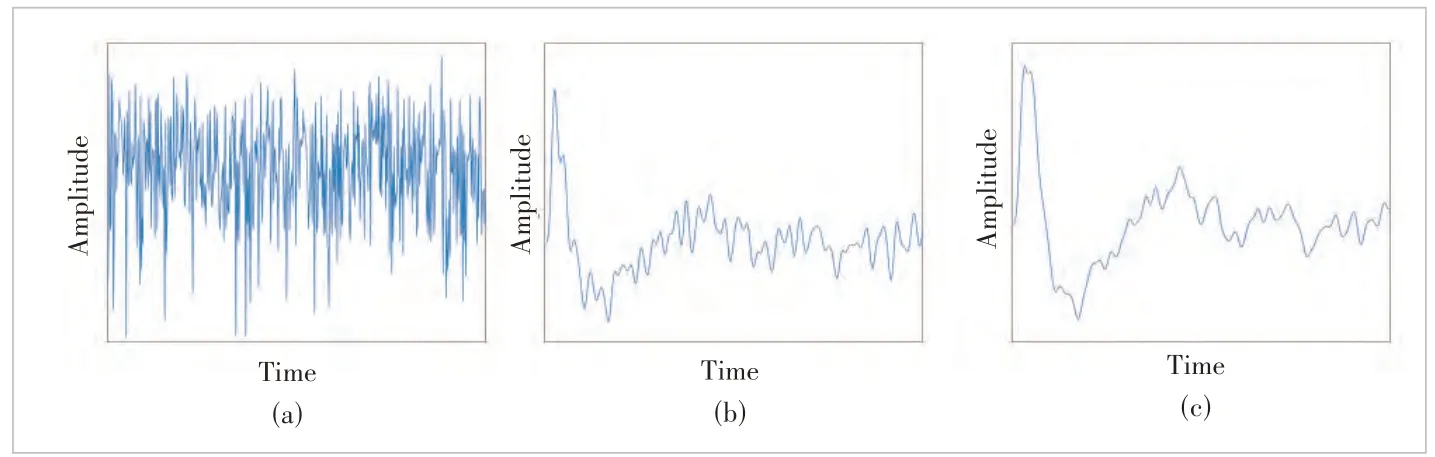
▲Figure 2. (a) Original channel state information (CSI) amplitude image; (b) CSI amplitude image after signal denoising; (c) CSI amplitude image after signal smoothing
4) The purpose of principal component analysis (PCA) is to extract the main features in the subcarrier to achieve more accurate activity recognition. In this work, each receiving antenna can obtain data from 30 subcarriers. We apply PCA to each subcarrier of CSI and select the second principal component of the signal for subsequent feature extraction, because the first principal component in the signal usually contains a lot of noise while containing the information about human activities. Fig. 3(a) shows the original amplitude of each CSI subcarrier, and Fig. 3(b) shows the second principal component of the corresponding CSI signal.
5) The purpose of DWT calculation is to obtain a discrete wavelet transform spectrum for fall detection. In the process of falling, people first have an acceleration process, and the acceleration is downward. The speed reaches the maximum when it collides with the ground quickly, and then the ground gives people an upward force. The acceleration is upward, and the speed quickly drops to 0. Compared with STFT[26], DWT can achieve a good trade-off between time resolution and frequency domain resolution. In the higher frequency range, actions usually change quickly, which can achieve higher time resolution; in the lower frequency range, the action usually changes slowly and can achieve higher frequency domain resolution. In order to accurately detect the change in the user’s motion speed, in this work, we use the time-frequency domain component of the signal to detect falls[27]. DWT can calculate the corresponding energy size of components in different frequency ranges[28-29].
In this work, we use the demy wavelet base to obtain the fifthorder DWT spectrum. In the experiments, we find that the demy wavelet basis with five levels of frequency order is more suitable for fall detection. Typically, fall actions bring higher signal frequencies, with the highest values usually at level 4 or level 5, while non-fall actions usually have frequency orders below level 3. At the same time, using a moderate number of levels also reduces the computational burden of subsequent calculations. Fig. 4 shows the DWT spectrum of fall and walk activities. The place with higher brightness represents higher signal energy. It can be seen that the energy of signals in fall activities gradually increases from level 5 to level 2, and then gradually decreases.The energy of the signal in the walking motion is always at a lower wavelet level.It can be seen that the wavelet energy distribution of signals varies with different activity types.

▲Figure 3. (a) Amplitude image of each subcarrier of the original channel state information (CSI) and (b) second principal component amplitude image
2.3 Feature Classification
The DWT spectrum can reflect the time-frequency domain characteristics of the signal, and this part uses convolutional neural networks (CNN) to classify the extracted DWT spectrum as shown in Fig. 5. In theory, the horizontal axis of the DWT spectrum we extract represents the time information of the user’s activity, while the vertical axis represents the frequency information of the user’s activity. CNN uses convolutional kernels of different sizes to extract edge information from the DWT spectrum. The horizontal component of the convolutional kernel can extract the temporal difference information of the user’s activity, while the vertical component can extract the frequency difference information of the user’s activity. Overall, using a CNN model can extract high-order information about the user’s activity in both time and space domains, thus obtaining a high-order representation of the user’s activity.
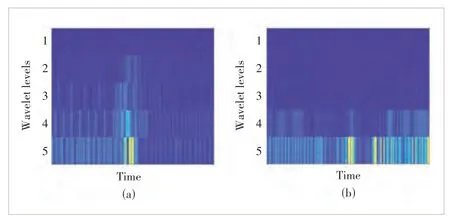
▲Figure 4. (a) Discrete wavelet transform (DWT) spectrum of fall activities and (b) DWT spectrum of walking motion
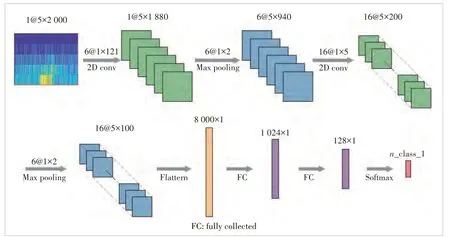
▲Figure 5. Feature classification model
LetSbe the input data set. This work pre-collects sample data of falls as well as normal activities and extracts features for training, where each sample datum has a time length ofT=2 s and a sampling frequency of 1 000 Hz. Each input sample of the classification models∈Sis a DWT 2D spectrum of 5×2 000, where the sampling length of the time dimension is 2 000 and the frequency dimension is quantified into 5 levels.
Our work first extracts the spatial features of the 2D spectrum using convolutional and pooling layers[30-31].
wheref1andf2represent the convolutional layers,g1andg2represent the pooling layers,θ1-θ4represent the parameters,andFrepresents the extracted spatial features. Specifically,we first generate six feature maps of dimension 5×1 880 using six convolutional kernels of dimension 1×121, and then generate six feature maps of dimension 5×940 using the maximum pooling layer. Then we continue to generate 16 feature maps of dimension 5×200 using 16 convolutional kernels of dimension 1×5, and then generate 16 feature maps of dimension 5×100 using the maximum pooling layer. The feature maps are then generated using the maximum pooling layer. With two convolutional and pooling layers, we extract the spatial features of the signal. Next, we spread the dimensionality of the features and input them to the subsequent fully connected(FC) and Softmax layers for fall detection.
whereh1andh2represent the fully connected layer andθ5-θ7represent the parameters. The FC layers are activated using rectified linear units (ReLU) and each FC layer uses a dropout mechanism to avoid overfitting. In this way, we use features to determine the presence of dropout activity.
The system’s overall algorithm is shown in Algorithm 1.

Algorithm 1. Fall detection algorithm Input: CSIraw, the raw CSI measurements.Output: Fall detection results.Signal interpolation:CSIinterp ← CSIraw Signal denoise:CSIdenoise ← CSIinterp Signal smoothing:CSIsmooth ← CSIdenoise Principal component analysis:
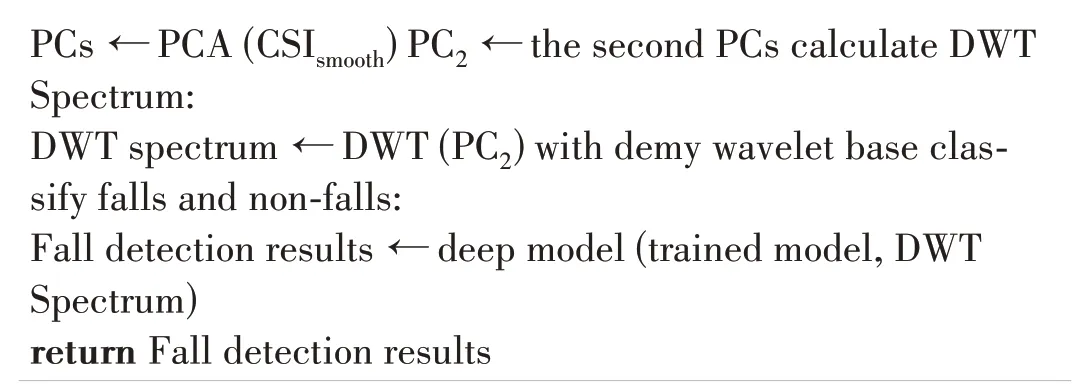
P Cs ← PCA (CSIsmooth) PC2 ← the second PCs calculate DWT Spectrum:DWT spectrum ← DWT (PC2) with demy wavelet base classify falls and non-falls:Fall detection results ← deep model (trained model, DWT Spectrum)return Fall detection results
3 System Evaluation
3.1 Experiment Methodology
1) Experimental setup. The goal of our work is to implement a low-cost, senseless, non-contact fall detection system,so this paper uses a commercially available Wi-Fi device for the experiments. The experiments are based on a previously acquired dataset, the acquisition environment of which is shown in Fig. 6, and the size of the common home environment is 9.6 m×3.6 m. The yellow area is the fall monitoring area, and the line-of-sight path between the transmitter and receiver is obscured by a door. We use the CSITools platform and an Intel 5300 wireless card to collect CSI information.The center frequency of the wireless cards for both the transmitter and receiver is set to 5.825 GHz with a bandwidth of 20 MHz. The receiver is set to monitor modes to receive data from the transmitter. The transmitter sends CSI information at a frequency of 1 000 Hz.
2) Data acquisition. Our work collects data in the monitoring area in Fig. 6. There are five members in the family of the experiment. To obtain data on falls, this work asks participants to perform the fall action on their own with controlled risk. Specifically, participants wear protective equipment and pretend to fall unconsciously whenever possible. To obtain more data on falls, we also use dummies to simulate real users to perform falls. In addition, we collect non-falling activities of each user in their daily life. To collect data on normal activities, users are asked to perform activities in the monitored area. In total, about 600 sets of fall samples and 2 000 sets of non-fall samples are collected in this work. Among the fall samples, the number of dummy samples accounts for about 490 groups, and the rest are falls of real users. The sample types of falls include tripping, slipping, losing balance, kneeling, sitting-falling, and walking-falling, and the sample types of non-falls include activities such as walking, jogging, sitting/standing up, bending down to pick up, and squatting.
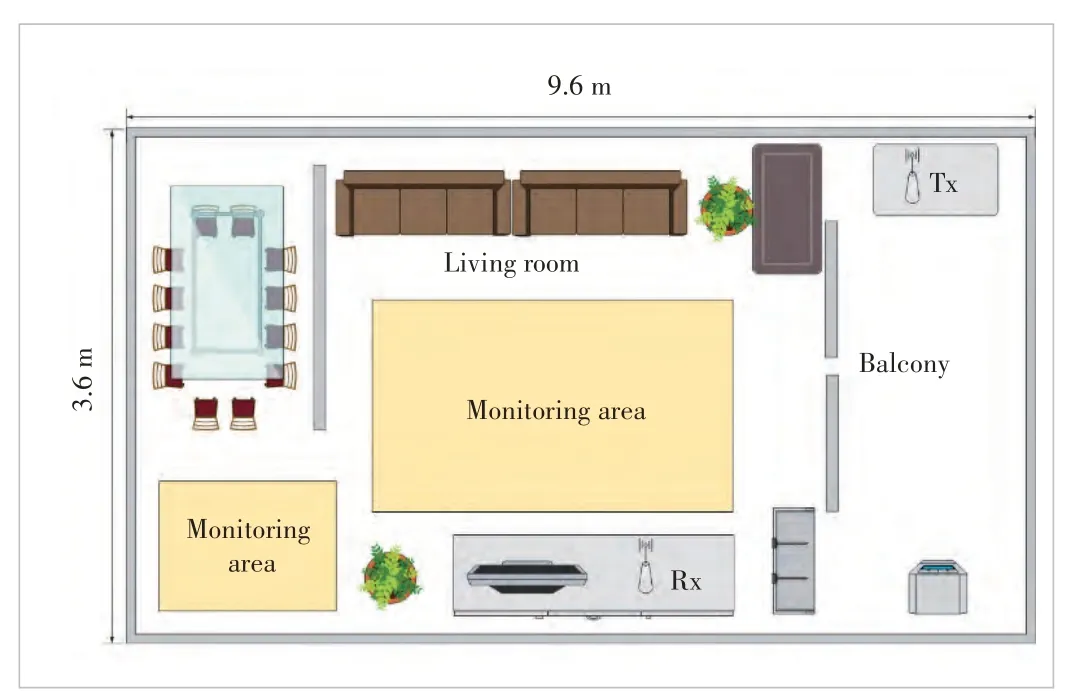
▲Figure 6. Experimental environment setup
3) Detection metrics. Our work uses two intuitive fall detection metrics: the false alarm rate (FAR) and the missed alarm rate (MAR). FAR is the ratio between the number of incorrectly identified normal activity samples and that of all normal samples, showing how often users are disturbed when no fall activity occurs. MAR is the ratio between the number of incorrectly identified fall samples and that of all fall samples, showing the sensitivity and detection capability of the system for fall activity.
3.2 System Performance
1) Performance comparison of existing work. We compare the present work with the currently available work on fall detection using Wi-Fi based devices. We divide the precollected dataset into a training set and a test set and extract the corresponding features for evaluation, using a ten-fold cross-validation approach. Fig. 7 shows the performance of the system evaluation. The MAR and FAR of our system are 4.8% and 1.9%, respectively, which are better than the existing work. Since the experimentally collected non-fall data are all data of users performing activities, and according to the survey results of the National Bureau of Statistics, the average time spent by Chinese residents at home is about 7.5 h per day,and the FAR of the system will be further reduced in the home scenario,which is expected to be around 0.6%.
A comparison of existing work shows that using deep models for fall detection performs significantly better than using traditional machine learning. For example, using a deep learning model outperforms a traditional machine learning SVM model when the same DWT spectrum is used as the extracted feature. Specifically, the MAR and FAR decrease by 10.6%and 8.3%, respectively. In theory, the deep learning model can acquire more hidden features in the wireless signal;while the traditional machine learning model mostly extracts statistical features for activity identification, which is relatively less physically significant.
2) Performance comparison of different deep model schemes. In addition to the already working detection schemes, we combine different detection schemes by ourselves based on the CSI amplitude/phase, DWT spectrum and STFT spectrum, combined with models such as the long shortterm memory (LSTM) network in deep learning. The results of our systematic evaluation of different schemes are shown in Fig. 8. It can be seen that with the deep learning models, the performance of the DWT spectrum and STFT spectrum-based schemes is better than that of the original feature-based schemes such as CSI magnitude. For example, when the CNN model is used for feature classification, the DWT spectrum is better than the CSI amplitude. Specifically, MAR and FAR decrease by 3.2% and 0.7% respectively.

▲Figure 7. Comparison of existing work
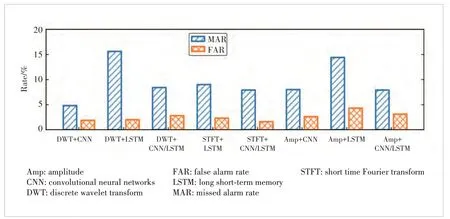
▲Figure 8. Comparison of depth modeling solutions
3) Analysis of CSI sampling frequency. In the above experiments, the CSI sampling frequency is 1 000 Hz. Considering that the Wi-Fi packet transmission may be disturbed in actual use, the sampling frequency may be degraded. Therefore, we evaluate the impact of the CSI sampling frequency on the system performance. We use 1 000 Hz to capture CSI, downsample the CSI data stream to 750 Hz, 500 Hz, 330 Hz, 250 Hz and 200 Hz, and adjust the input scale of the network to match the extracted signal features for fall detection. The performance of the system is shown in Fig. 9, where the performance of the system also decreases gradually as the sampling frequency decreases. When the sampling frequency decreases from 1 000 Hz to 200 Hz, the MAR and FAR of the system decrease by 8.2% and 1.3%, respectively. This is due to the fact that the user’s velocity increases suddenly during the falling motion,which is harder to capture at lower sampling frequencies.
4) Signal interpolation algorithm performance analysis. To test the performance of the signal interpolation algorithm in the case of non-uniform sampling, we construct non-uniformly sampled data by randomly selecting 50% of the existing uniformly sampled samples with an overall sampling frequency of 500 Hz, and process the constructed data using a onedimensional linear interpolation method. We then perform feature extraction and classification on the constructed nonuniformly sampled data and the interpolated data respectively,and observe the effect. As shown in Fig. 10, after signal interpolation, the MAR and FAR of the system are 7.2% and 2.5%, respectively. The results are 2.8% and 0.6% lower than the MAR and FAR of the directly non-uniformly sampled data, respectively. Theoretically, using non-uniformly sampled data to calculate the time-frequency domain characteristics of the signal introduces a certain amount of error. The interpolation algorithm of the signal can mitigate this part of the error.

▲Figure 9. Effect of different channel state information (CSI) sampling frequencies
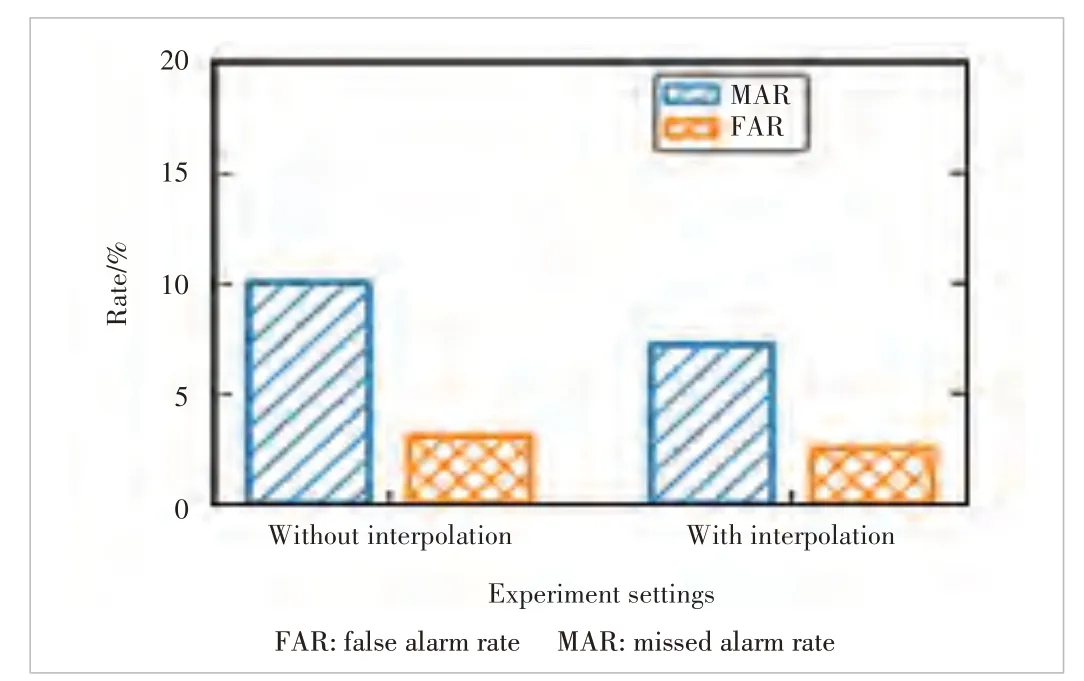
▲Figure 10. Signal interpolation algorithm performance analysis
5) Relevant parameters and activity analysis. In the experiment, the MAR and FAR of the system are also changed by adjusting the threshold of activity discrimination. Fig. 11 shows the changes in MAR and FAR in the case of system threshold adjustment. It can be seen that MAR and FAR constrain each other, and theoretically, the thresholds can be adjusted as needed to obtain the corresponding performance of the system. In this system, we adjust the MAR around 4.8%and obtain the corresponding FAR of 1.9%. In addition, we analyze the probability of misjudgment for different normal activities and the probability of misjudgment for different fall types, and the results are shown in Figs. 12 and 13, respectively. It can be seen that the bending and picking up action has the highest false alarm rate of 4.0%, followed by walking and sitting/standing up. The speed of human movements in these actions is usually faster, and the actions of bending down and picking up, and sitting down/standing up have some similarities with falls, so false alarms occur easily. And among the different types of falls, tripping has the highest missed alarm rate of 7.8%, followed by kneeling and sitting/stumbling. Since tripping and kneeling happen when the user usually falls toward the front of the direction of motion, there is a certain similarity with the action of bending down to pick up,while the sit-down-fall situation is easily confused with sitting down and therefore easily to miss.
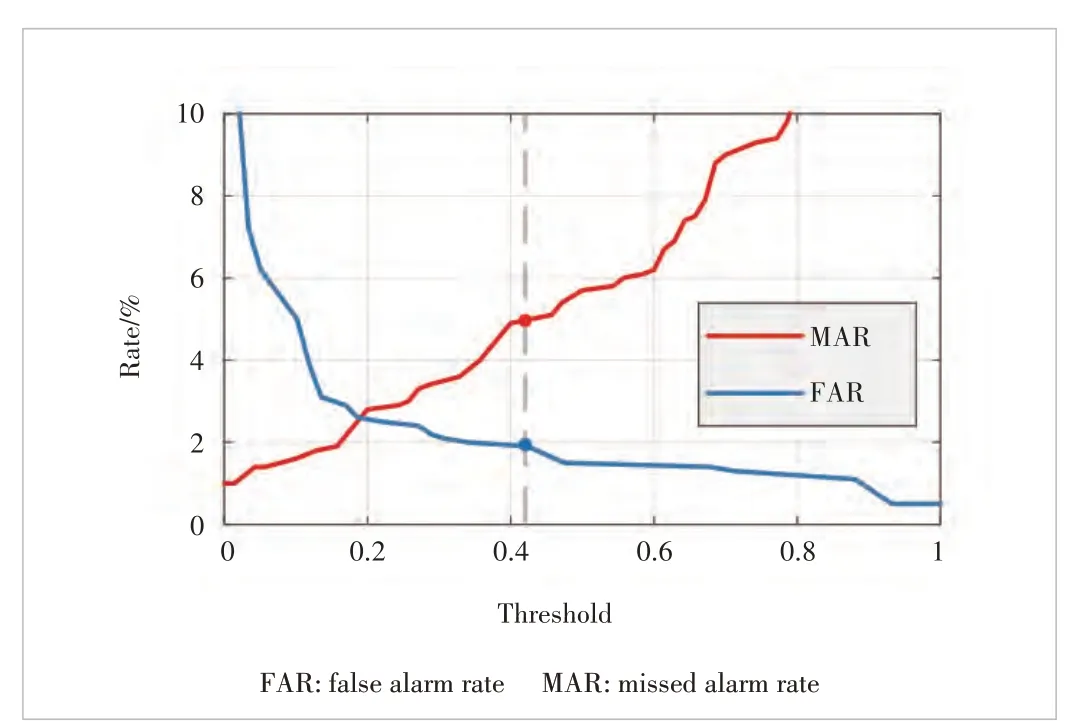
▲Figure 11. Impact of threshold selection on performanc
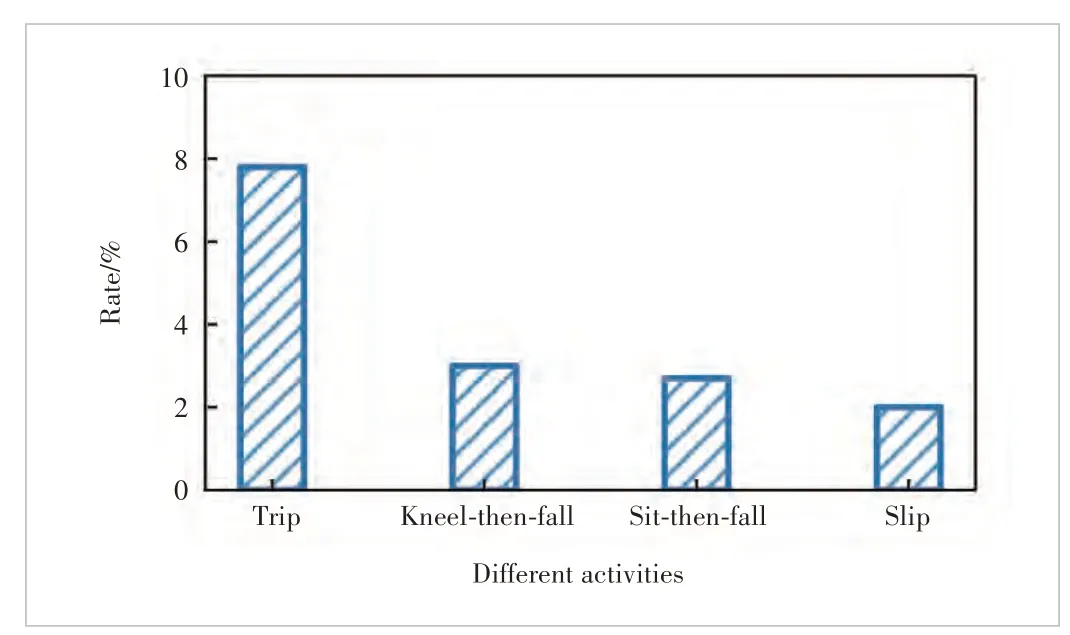
▲Figure 13. Probability of missing alarms for different fall types
6) Comparison of network sizes for different deep models.We compare the scale of various deep networks, and the results of the comparison are shown in Fig. 14. In the case of different features, the corresponding network models are smaller in size because the DWT spectrum has fewer orders of features compared with the original CSI magnitude information and the STFT spectrum. From the results, the scale of the model corresponding to using the DWT spectrum as features is one order of magnitude less than the other two features. For the different classification models, the CNN model has fewer parameters than the LSTM model with the same size input, so the network size is smaller. Overall, our system achieves better performance by using a network model as small as possible.
7) System latency analysis. To validate the efficiency of our system, we deployed it on a laptop with an 8-core Intel i7-6700 @2.60 GHz CPU and measured the system’s runtime. The system’s runtime is mainly composed of feature extraction and model classification. Experimental results show that using 2 s of CSI information as input, the overall average end-to-end runtime is 18.1 ms, with feature extraction taking 7.5 ms and model classification taking 10.6 ms.The results indicate that our system can achieve real-time detection of fall actions.
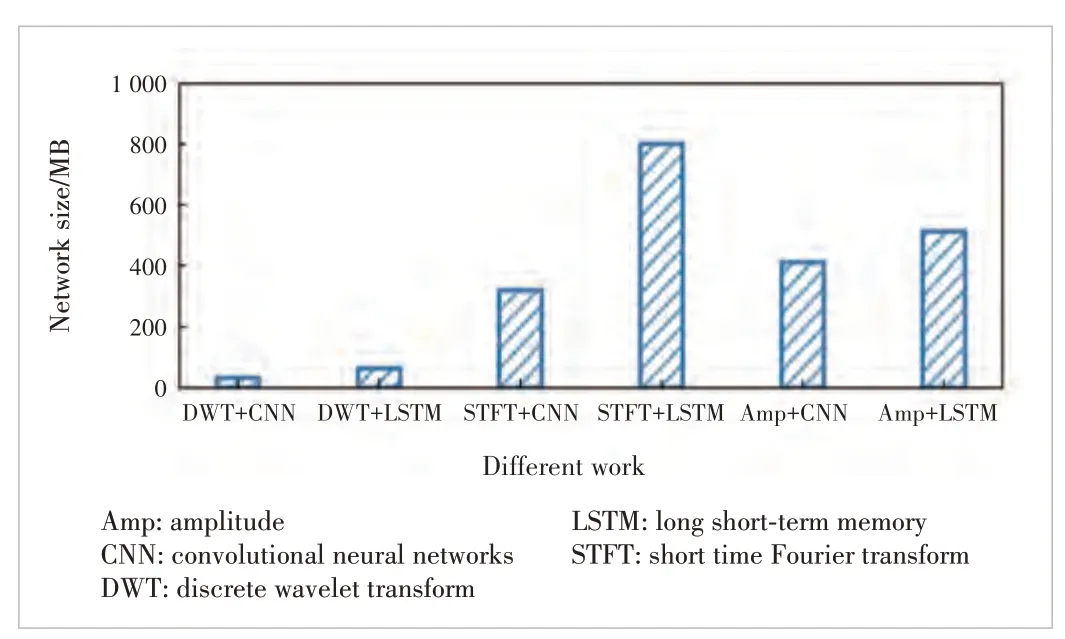
▲Figure 14. Network size for models with different depth
4 Conclusions
In our work, a passive fall detection system based on Wi-Fi is proposed. To better obtain information about the motion state of the target, this work extracts the DWT spectrum from the received raw signal to characterize the user’s activity. To achieve better classification results, this work designs a classifier based on a deep learning model for fall detection. The experimental evaluation illustrates that our work achieves false alarm and missed alarm rates of 4.8% and 1.9%, with better performance than other existing works and systems.
杂志排行

ZTE Communications的其它文章
- Table of Contents, Volume 21, 2023
- Special Topic on 3D Point Cloud Processing and Applications
- Beyond Video Quality: Evaluation of Spatial Presence in 360-Degree Videos
- Mixed Electric and Magnetic Coupling Design Based on Coupling Matrix Extraction
- A Hybrid Five-Level Single-Phase Rectifier with Low Common-Mode Voltage
- Incident and Problem Ticket Clustering and Classification Using Deep Learning