Lossy Point Cloud Attribute Compression with Subnode-Based Prediction
2024-01-12YINQianZHANGXinfengHUANGHongyueWANGShansheMASiwei
YIN Qian, ZHANG Xinfeng, HUANG Hongyue,WANG Shanshe, MA Siwei
(1. School of Computer Science, Peking University, Beijing 100871, China;2. School of Computer Science and Technology, University of the Chinese Academy of Sciences, Beijing 100049, China)
Abstract: Recent years have witnessed that 3D point cloud compression (PCC) has become a research hotspot both in academia and industry.Especially in industry, the Moving Picture Expert Group (MPEG) has actively initiated the development of PCC standards. One of the adopted frameworks called geometry-based PCC (G-PCC) follows the architecture of coding geometry first and then coding attributes, where the region adaptive hierarchical transform (RAHT) method is introduced for the lossy attribute compression. The upsampled transform domain prediction in RAHT does not sufficiently explore the attribute correlations between neighbor nodes and thus fails to further reduce the attribute redundancy between neighbor nodes. In this paper, we propose a subnode-based prediction method, where the spatial position relationship between neighbor nodes is fully considered and prediction precision is further promoted. We utilize some already-encoded neighbor nodes to facilitate the upsampled transform domain prediction in RAHT by means of a weighted average strategy. Experimental results have illustrated that our proposed attribute compression method shows better rate-distortion (R-D) performance than the latest MPEG G-PCC (both on reference software TMC13-v22.0 and GeS-TM-v2.0).
Keywords: point cloud compression; MPEG G-PCC; RAHT; subnode-based prediction
1 Introduction
Rapid progress in 3D graphic technologies and capture devices has enabled high-precision digital representations of 3D objects or scenes. Point clouds, as one of the mainstream 3D data formats, can effectively indicate points in real-world scenes through 3D geometric coordinates and corresponding attributes (e.g., color, normal and reflectance). Considering its flexible representation properties,point clouds have been widely applied to various fields, such as autonomous driving, free-viewpoint broadcasting, and heritage reconstruction[1]. However, in addition to a huge amount of data, point clouds are non-uniformly sampled in space,which undoubtedly makes it unfeasible to put point clouds into applications with limited bandwidth and storage space[2].Therefore, it is necessary to investigate efficient point cloud compression (PCC) schemes.
With an increasing demand for point cloud applications, the Moving Picture Expert Group (MPEG) standardization committee started to conduct PCC-dedicated standards and issued a Call for Proposals (CfP) in 2017[3]. After intensive developments involving academic and industrial meetings, two independent point cloud compression frameworks have been adopted to cover a wider range of immersive applications and data types. One called video-based PCC (V-PCC)[4]adopts projection-based strategies combined with video codecs,which aims for handling dense point clouds. Another called geometry-based PCC (G-PCC)[5]is more specifically designed for relatively sparse point clouds by using the octree-based architecture. The octree representation first proposed for PCC in Ref. [6] can build a progressive 3D structure for point clouds.Specifically, by recursively dividing point clouds from the root node to leaf nodes, the connectivity information between points can be exploited among the unorganized point clouds.Moreover, the topological neighbor information makes it easier to implement techniques similar to prediction or transformation in video coding. In the current G-PCC scheme, geometry and attributes are coded sequentially and multiple coding tools can be selected to suit different application scenarios.For the geometry information, in addition to octree coding[7],the triangle soup (Trisoup) coding[8]is used to approximate the surface of point clouds as a complement to the octree decomposition while predictive tree coding[9]is applied to low-delay use cases. In terms of attributes, there are mainly two branches concerning different advantages. The level of details(LODs)-based prediction scheme[10]aims to near-lossless or lossless compression and also deliver spatial scalability to GPCC. By contrast, the region adaptive hierarchical transform(RAHT) scheme[11]is more suitable for lossy compression with much lower complexity. Note that the attribute coding framework RAHT is our main focus in this paper.
As the mainstream attribute compression scheme, the RAHT was first proposed in Ref. [12] to provide a hierarchical transform structure. In general, the RAHT is an adaptive variant of the Haar wavelet transform (HWT), which can evolve into a 3D version of the Haar transform when all nodes are occupied. To furthermore improve the coding efficiency of the RAHT, an upsampled transform domain prediction[13]was proposed and has been adopted in the current G-PCC. Specifically, decoded attributes of the nodes at lower levels (i.e.,lower resolution) are used to predict attributes of the nodes at higher levels. Then, the prediction residuals can be further quantized and entropically encoded. During the transform domain prediction stage, in addition to the nodes at lower levels,the nodes at current encoding levels can also be applied to prediction by means of weighted average[14]. However, the information of surrounding neighbor nodes has not been fully utilized in certain search ranges, which means that further exploring the correlations between neighbor nodes can lead to better attribute compression performance.
In this paper, we propose a subnode-based prediction scheme for point cloud attribute compression, which aims at optimizing the upsampled transform domain prediction in RAHT. Specifically, we first analyze the spatial distribution among neighbor nodes and further explore their reference relationship. Based on this analysis, the prediction accuracy is further improved by exploiting some already-encoded nodes that are not used in the current prediction. Then, a weighted average strategy is introduced for the final attribute prediction of the node to be encoded. Extensive simulations are conducted and compared with the G-PCC as the anchor. Experimental results have confirmed that our proposed method outperforms both Test Model Category 13 (TMC13) and Geometry-Based Solid Content Test Model (GeS-TM) platforms in terms of all point cloud datasets provided by MPEG.
The remainder of this paper is organized as follows. Section 2 succinctly reviews the related works on attribute coding in PCC and describes the current RAHT scheme of G-PCC in particular. Our proposed subnode-based prediction approach is then presented in Section 3. Section 4 provides experimental results and analysis and Section 5 concludes this paper.
2 Related Work
In this section, we first review the attribute coding schemes for PCC. They can be mainly divided into three categories,which are projection-based methods, prediction-based methods and transform-based methods. All of them have been introduced to the MPEG PCC standards. To be more specific, the V-PCC utilizes projection-based methods while the other two strategies have been adopted by the G-PCC. Since our work mainly focuses on the geometry-based PCC, the research related to video-based PCC is outside the scope of this paper.Moreover, the current RAHT scheme and upsampled transform domain prediction of G-PCC are also specifically described as our background.
2.1 Point Cloud Attribute Coding Technologies
Among the existing attribute coding approaches, the prediction-based technology is one of the popular schemes to exploit spatial attribute correlations between points. For example, the attribute prediction framework in G-PCC[10]introduces a linear interpolation process by using the k-nearest neighbors (KNN) search algorithm. This prediction method is based on a LODs structure, which splits the whole point cloud into several subsets (i.e., refinement levels) according to the distance criterion. Based on the LODs, the point clouds are then reordered and encoded, where attributes of points are always predicted by their KNN in the previous LODs. Furthermore, an additional flag is provided in Ref. [15] to allow predictions by using points at the same level. On top of the prediction framework, a lifting scheme[16]is proposed to promote attribute lossy coding. To be more specific, compared with the original prediction method, an update operator combined with an adaptive quantization strategy is added to improve the prediction accuracy. Attributes of points in lower LODs are always assigned much higher influence weights because they are used as reference points with higher frequency and probability for predicting points in higher LODs.
Based on the above two prediction schemes, substantial works are investigated to further improve the attribute compression efficiency. WEI et al. propose an enhanced intraprediction scheme[17]by considering the overall geometric distribution of the neighbors set. They introduce the centroidbased criterion to measure the distribution uniformity of points in a predictive reference set. Since this scheme predictively encodes the point clouds point by point, the prediction errors will accumulate and propagate, especially for points in higher LODs. Hence, a bilateral filter is proposed in Ref. [18]to update the reconstruction values of decoded points, which reduces error propagation when encoding subsequent points.In addition, YIN et al. attempt to optimize the predictive neighbor set by using the normal of point clouds[19], aiming at improving prediction precision for Light Detection and Ranging (LiDAR) point clouds.
Besides prediction-based methods, other approaches contribute to reducing the attribute spatial redundancy in a transform domain. For instance, to utilize the 2D discrete cosine transform (DCT), ZHANG et al. project the point clouds onto two-dimensional grids for color compression[20]. This 3D-to-2Dbased method inevitably fails to fully consider threedimensional spatial correlations. Hence, 3D-DCT-based methods are developed continuously, such as Refs. [21] and [22].
Apart from DCT, more complex transforms are introduced to attribute coding for PCC. The graph Fourier transform (GFT) is first applied to PCC in Ref. [23], which is an extension of the Karhunen-Loève transform (KLT). The graphs are constructed based on octree-decomposed point clouds, where the graph Laplacian matrix can be deduced by connecting the points within small neighborhoods. Then attributes are transformed, quantized, and entropically encoded. Since the coding efficiency of the graph-based methods outperforms the DCT-based method,extensive follow-up works have been carried out on the attribute graph transform coding. Specifically, an optimized graph transform method[24]is proposed to improve the Laplacian sparsity combined with k-dimensional tree partition and an RDObased quantization process. Then, XU et al.[25]introduce the normal of point clouds, in addition to geometric distance, to measure the connectivity between neighbor points. Moreover,they propose a predictive generalized graph transform scheme[26]to eliminate the temporary redundancy. Although the graph-based transform approaches exhibit superior coding performance, complicated matrix decomposition leads to realtime difficulties in PCC.
Taking the complexity into consideration, RAHT is proposed in Ref. [12] and finally adopted in G-PCC as the fundamental framework. Our work is closely related to the RAHT and corresponding techniques, which will be concisely described in Section 2.2.
2.2 RAHT in MPEG G-PCC
RAHT is a Haar-inspired method with a hierarchical structure, which can be regarded as an extension of 1D HWT. The core of HWT is to represent functions and signals by using a series of wavelets or basis functions. Specifically, suppose a signalShasNelements. The HWT decomposes the original signalSinto low-pass and high-pass components, which can be calculated as follows:
whereS2nandS2n+1denote two adjacent elements of signals.The direct current (DC) and alternating current (AC) coefficients represent the low-frequency and high-frequency parts of the signal respectively. Generally speaking, the energy of the signal after the HWT is mainly concentrated on a few coefficients, especially the DC coefficients, and then appropriate quantization and entropy coding can achieve the purpose of compression.
In order to apply HWT for 3D point cloud attribute compression, 1D HWT is applied sequentially along thex,y, andzdirections. Specifically, the RAHT is conducted on a hierarchical octree based on the geometry information of point clouds, which starts from the leaf nodes (i.e., highest resolution level) and proceeds backward until the octree’s root node(i.e., lowest resolution level). In each level, the RAHT is applied to each unit node containing 2×2×2 subnodes. As shown in Fig. 1, the unit node is transformed along three directions to generate both DC and AC coefficients, where the DC coefficients along each direction will continue to be transformed while the AC coefficients will be output to be quantized and encoded. Note that the number of coefficients is the same as the number of occupied subnodes in a unit node, including one DC coefficient and several AC coefficients. Then, the DC coefficient obtained from the node at Levellwill be used as the attribute of the node at Levell-1 for further transformation.After processing all unit nodes (Noccupied nodes) at Levell,Ngenerated DC coefficients (denoted asLLL) continue to be transformed until the root node.
It should be noted that, in the current G-PCC, the dyadic RAHT decomposition[27]is adopted to adapt to more complicated textures. The whole process of the dyadic RAHT is exactly the same as the normal RAHT mentioned above, except that the AC coefficients obtained in each direction will be further transformed like the DC coefficients. Another point to be emphasized is that, unlike HWT in Eq. (1), the wavelet transform kernel for RAHT is modified according to

▲Figure 1. Transform procedure of a unit node along three directions.The DC coefficient is denoted as L and H represents the AC coefficient.LL and LH represent the DC coefficient and AC coefficient of DC coefficient respectively, and so on
wherew1andw2represent the number of points in two adjacent nodes, which makes the transform more adaptive to the sparsity of point clouds.
To further explore the local spatial correlation, the interdepth upsampling (IDUS) method[13]is proposed to predict attributes of nodes in the transform domain. As shown in Fig. 2,the upsampling process is realized by means of a weighted average based on geometric distance in the mean attribute space. During the prediction procedure, for each node at Levell, there are mainly two types of nodes used for prediction, which are parent-level neighbors at Levell-1 and subnode-level neighbors at Levell[14]. However, there are still some already-encoded neighbors that are not utilized in the current prediction and the prediction reference relationship can be further refined to improve the attribute compression efficiency.
3 Proposed Approach
Based on the framework described in Section 2.2, we propose a subnode-based transform domain prediction for RAHT that considers more accurate spatial correlations among nodes. In addition to the parent-level neighbors and subnodelevel neighbors in G-PCC, some other effective neighbors are also utilized for upsampled transform domain prediction. As illustrated in Fig. 3, the parent-level neighbors at levell-1 include three types of nodes, which are the parent node (Npm),co-plane parent neighbor node (sharing a side with the subnode to be predicted,Ncppnn), and co-line parent neighbor node (sharing an edge with the subnode to be predicted,Nclpnn). For the subnode-level neighbors at Levell, there are the co-plane subnode in the co-plane parent neighbor node(Ncpsn), co-line subnode in the co-line parent neighbor node(Nclsncl) and proposed co-line subnode in the co-plane parent neighbor node (Nclsncp). With these predictive reference nodes, we design an optimized transform domain prediction for RAHT. Compared with the original prediction scheme in G-PCC, we first introduce already-encoded neighbor nodesNclsncpas reference candidates and the neighbor search for nodesNclsncpis described in Section 3.1. Since a new type of predictive reference neighbors is added, we further propose a geometric distribution-based prediction to refine the original node prediction reference relationship, which is then detailed in Section 3.2.

▲Figure 2. Upsampled transform domain prediction for region adaptive hierarchical transform (RAHT) in geometry-based point cloud compression (G-PCC), where upsampling prediction is performed in the mean attribute space and transformation is performed in the sum attribute space
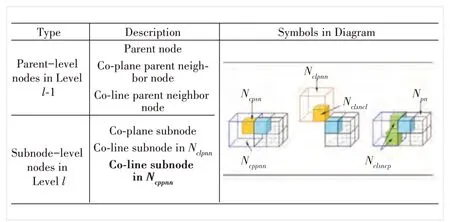
▲Figure 3. Notations of different types of nodes for transform domain prediction, which include parent-level neighbor nodes at level l-1 and subnode-level neighbor nodes at level l
3.1 Neighbor Search for Reference Candidates
Since the proposed co-line subnodes (Nclsncp) exist in the co-plane parent neighbor nodes (Ncppnn), the neighbor search is mainly decomposed into two stages: 1) determining the coplane parent neighbor nodes and 2) deciding co-line subnodes reference candidates. Specifically, for each subnode to be predicted, the corresponding parent node has at most six coplane parent neighbor nodes. Among them, already-encoded subnodesNclsncpcan only exist in three parent neighbor nodes (Fig. 4), which are located on the left, front and bottom ofNpnrespectively.
Further considering the position of each subnode to be predicted in itsNpnas well as the distribution of correspondingNcppnn, the detailed existence ofNclsncpof each subnode to be predicted is shown in Fig. 4. Note that the position indexes (from 0 to 8) are organized according to the Morton order. Specifically, we denoteNtbp ias thei-th subnode to be predicted in the sameNpn. Then,it can be seen that onlyNtbp0 contains sixNclsncpreference candidates.Ntbp1,Ntbp2 andNtbp4 include fourNclsncpreference candidates.Ntbp3,Ntbp5 andNtbp6 include twoNclsncpreference candidates.Ntbp7 has noNclsncpreference candidate. More detailed information is listed as follows:
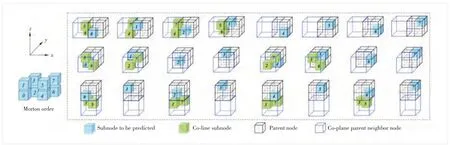
▲Figure 4. Schematic diagram of co-line subnodes of each subnode to be encoded in the same parent node, where the position indexes are organized according to the Morton order
·Ntbp0 candidates located in No. 5 and No. 6 subnodes of the leftNcppnn, No. 3 and No. 5 subnodes of the bottomNcppnn, and No. 3 and No. 6 subnodes of the frontNcppnn.
·Ntbp1 candidates located in No. 4 and No. 7 subnodes of the leftNcppnnand No. 2 and No. 7 subnodes of the frontNcppnn.
·Ntbp2 candidates located in No. 4 and No. 7 subnodes of the leftNcppnnand No. 1 and No. 7 subnodes of the bottomNcppnn.
·Ntbp3 candidates located in No. 5 and No. 6 subnodes of the leftNcppnn.
·Ntbp4 candidates located in No. 2 and No. 7 subnodes of the frontNcppnnand No. 1 and No. 7 subnodes of the bottomNcppnn.
·Ntbp5 candidates located in No. 3 and No. 6 subnodes of the frontNcppnn.
·Ntbp6 candidates located in No. 3 and No. 5 subnodes of the bottomNcppnn.
Among these reference candidates described above, the existing occupied (i. e., non-empty node)Nclsncpcan be searched by using the relative position relationship with each correspondingNtbpi. In addition to the proposedNclsncp,we also introduce a prediction scheme based on geometric distribution by usingNpn,NcppnnandNclpnnat Levell-1 andNcpsnandNclsnclat Levell, which will be detailed in the next section.
3.2 Prediction Based on Geometric Distribution
For each subnode to be predictedNtbp iin its parent nodeNpn, we propose to predict them according to the distribution of their neighbor subnodes in the co-plane parent node neighbor nodes. First of all, the distribution can be mainly divided into the following three categories, a total of six subcategories, mainly including:
· Distribution 1: The existingNcppnncontainsNcpsn, including three cases: 1) only oneNcpsn, 2) oneNcpsnand oneNclsncp, and 3) oneNcpsnand twoNclsncp.
· Distribution 2: The existingNcppnndoes not containNcpsnbut contains at least oneNclsncp, including two cases:1) only oneNclsncpand 2) twoNclsncp.
· Distribution 3: The existingNcppnndoes not contain any ofNcpsnandNclsncp.
Then, the corresponding target prediction mode can be determined by the three types of neighbor subnode distributions. For each subnode to be predicted, in addition to theirNpnthat will definitely participate in the prediction, the prediction reference of other nodes is shown in Fig. 5. Specifically, forNcppnn, we will first determine whether it containsNcpsn, and if so (i.e., satisfying Distribution 1), the attribute value ofNcpsnwill be used as the prediction instead of the attribute value of its correspondingNcppnnwhether it containsNclsncpor not. Then, if there is noNcpsninNcppnn, we further determine whether it contains at leastNclsncp, and if so(i.e., satisfying Distribution 2), the average attribute value ofNclsncpwill be used as the prediction instead of the attribute value of its correspondingNcppnn. If it contains neither of the above two conditions (i.e., satisfying Distribution 3), the attribute value ofNcppnnwill be directly used for prediction. BesidesNcppnn, forNcppnn, the attribute value ofNclsnclwill be used as the prediction instead of the attribute value of its correspondingNclpnnif it hasNclsncl, which is the same as the current G-PCC.
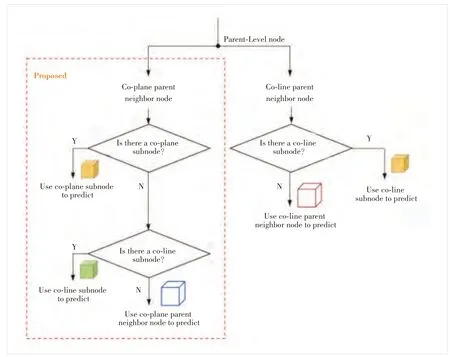
▲Figure 5. Transform domain prediction based on the three types of neighbor subnode geometric distributions
4 Experiments
To validate the effectiveness of the proposed method, we implement our subnode-based prediction scheme on top of the latest MPEG G-PCC reference software TMC13-v22.0[28]and GeS-TM-v2.0[29]. Extensive simulations have been conducted in accordance with the common test conditions (CTCs)[30]where the octree and RAHT configuration are applied for geometry and attribute respectively. In terms of the test conditions, as shown in Table 1, C1 (i.e., lossless geometry lossy attributes) and C2 conditions (i.e., near-lossless/lossy geometry lossy attributes) are both evaluated on the reference software TMC13-v22.0 and GeS-TM-v2.0.
4.1 Datasets
The test datasets provided by MPEG G-PCC can be mainly classified into three categories: Category 1—Static Objects and Scenes datasets (i.e., Cat1), Category 2—Dynamic Objects datasets (i.e., Cat2), and Category 3—Dynamic Acquisition datasets (i.e., Cat3). Specifically, sequences in Cat1 are further divided based on the density and surface continuity of point clouds (i.e., Solid,Dense, Sparse, and Scant). For Cat2, test classes A, B and C indicate the complexity of point clouds, where A is the lowest and C is the highest. The division of Cat3 is more detailed, including automotive frame-based data acquired by spinning and nonspinning LiDAR sensors (i.e., Amframe) and automotive LiDAR acquired data after fused and reprocessed (i.e., Am-fused). Note that Am-fused datasets have both color and reflectance attributes. In terms of the CTCs, the Cat1 and Cat3 datasets are tested on TMC13v22.0 while the Cat2 datasets are tested on GeS-TMv2.0. All test sequences mentioned above are available in the MPEG content repository[31].
4.2 Performance Evaluations
The attribute compression performances compared with TMC13-v22.0 are shown in Table 2, where the negative Bjontegaard delta (BD) rate illustrates the coding gains against the anchor. From Table 2, it can be seen that consistent codinggains can be achieved both under C1 and C2 conditions for all categories. Specifically, 0.2%, 0.3% and 0.5% bitrate reduction for luma, chorma and reflectance are obtained under the C1 condition respectively. 0.2%, 0.3% and 0.2% bitrate reduction for luma, chroma Cb and Cr as well as 0.2% bitrate reduction for reflectance are obtained under C2 condition respectively. Especially for Am-fused datasets, there are over 1% coding gains under the C1 condition for chroma Cb(1.2%), chroma Cr (1.1%) and reflectance (1.1%). Besides the R-D performance, the computational complexity is evaluated by using the average encoding and decoding time. There are only 2% and 3% extra increases on the encoding and decoding time on the C1 condition, with no complexity increase for encoding on the C2 condition.
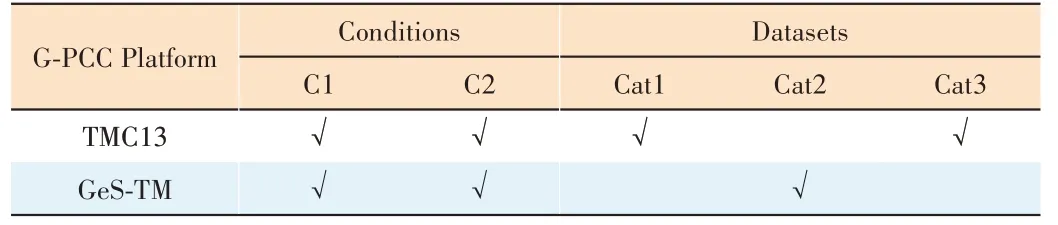
▼Table 1. Common test conditions in G-PCC

▼Table 2. Performance of the proposed method against TMC13-v22.0 under C1 and C2 configurations
Apart from TMC13-v22.0, we also compare our proposed method with GeSTM-v2.0 for Cat2. As shown in Table 3,consistent coding gains can be also achieved both under C1 and C2 conditions for all Cat2 datasets. Specifically, 0.4%,0.4% and 0.5% bitrate reduction for luma, chroma Cb and chroma Cr are obtained under the C1 condition respectively. 0.3%, 0.3% and 0.4% bitrate reduction for luma,chroma Cb and Cr are obtained under the C2 condition respectively. In terms of computational complexity, the encoding time increases by 6% while the decoding time increases by 10%.
To further evaluate the prediction effect of the proposed optimization scheme, we also count the errors during the transform domain prediction stage. Specifically, for each sequence in Cat1, prediction errors of all slices are accumulated if the upsampled prediction is enabled. As illustrated in Fig. 6, the average prediction errors of each type of point cloud are all smaller than that of the original prediction scheme in TMC13-v22.0. Therefore, our proposed method can effectively improve compression efficiency by reducing prediction errors.
5 Conclusions
In this paper, a subnode-based prediction is proposed to improve the lossy point cloud attribute compression for theMPEG G-PCC platform. Based on the original upsampled transform domain prediction scheme, we leverage some already-encoded neighbor nodes at the same level as the current node to be encoded to optimize the original prediction process. Additionally, a more refined prediction reference relationship is introduced based on the geometric distribution among neighbor nodes. Extensive simulation results demonstrate that our proposed method can achieve consistent coding gains on all types of point clouds, whether sparse LiDAR point clouds, dense colored point clouds, or multi-attribute point clouds, compared to the latest G-PCC test models.
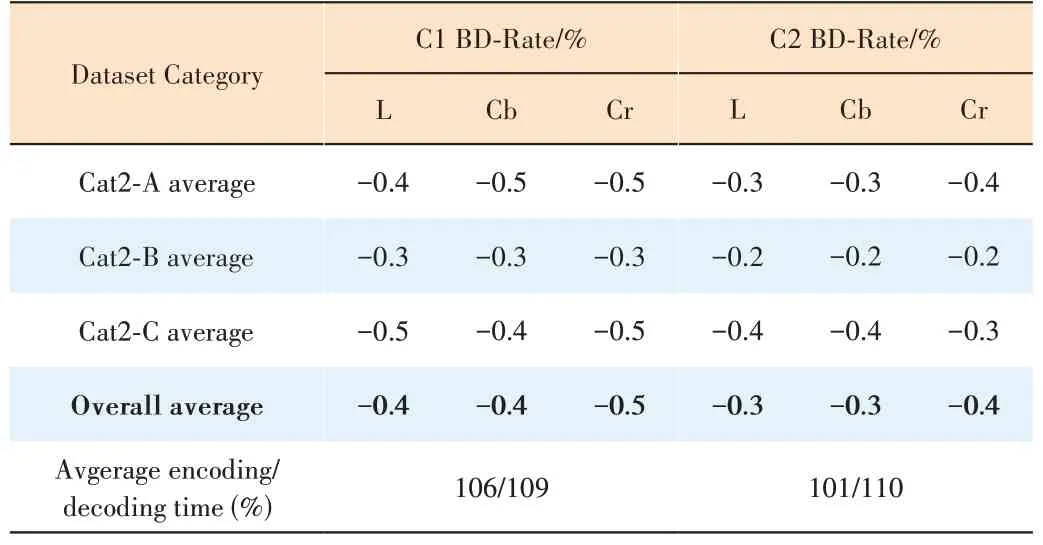
▼Table 3. Performance of the proposed method against GeSTM-v2.0 under C1 and C2 configurations
杂志排行

ZTE Communications的其它文章
- Perceptual Quality Assessment for Point Clouds : A Survey
- Spatio-Temporal Context-Guided Algorithm for Lossless Point Cloud Geometry Compression
- Point Cloud Processing Methods for 3D Point Cloud Detection Tasks
- Perceptual Optimization for Point-Based Point Cloud Rendering
- Local Scenario Perception and Web AR Navigation
- Research on Fall Detection System Based on Commercial Wi-Fi Devices