Perceptual Quality Assessment for Point Clouds : A Survey
2024-01-12ZHOUYingjieZHANGZichengSUNWeiMINXiongkuoZHAIGuangtao
ZHOU Yingjie, ZHANG Zicheng, SUN Wei,MIN Xiongkuo, ZHAI Guangtao
(Institute of Image Communication and Network Engineering, Shanghai Jiao Tong University, Shanghai 200240, China)
Abstract: A point cloud is considered a promising 3D representation that has achieved wide applications in several fields. However, quality degradation inevitably occurs during its acquisition and generation, communication and transmission, and rendering and display. Therefore,how to accurately perceive the visual quality of point clouds is a meaningful topic. In this survey, we first introduce the point cloud to emphasize the importance of point cloud quality assessment (PCQA). A review of subjective PCQA is followed, including common point cloud distortions, subjective experimental setups and subjective databases. Then we review and compare objective PCQA methods in terms of modelbased and projection-based. Finally, we provide evaluation criteria for objective PCQA methods and compare the performances of various methods across multiple databases. This survey provides an overview of classical methods and recent advances in PCQA.
Keywords: point cloud quality assessment; PCQA databases; subjective quality assessment; objective quality assessment
1 Introduction
In recent years, three-dimensional (3D) data have garnered increasing attention due to its indispensable role in various applications, ranging from computer graphics and computer-aided design to autonomous navigation, augmented reality, and environmental modeling. Point clouds, as one of the fundamental representations of 3D data, have emerged as a prominent data structure capable of capturing the spatial information of objects and scenes with unparalleled fidelity. A point cloud is a collection of points in a 3D coordinate system, where each point represents a precise location in space, often obtained through laser scanning, photogrammetry,or other 3D sensing techniques. Previous research[1-3]has demonstrated the inestimable value of such data-rich structures in generating accurate 3D models, facilitating object recognition, and enabling realistic visual simulations.
While the adoption of point clouds has led to groundbreaking advancements in numerous fields, ensuring the quality and fidelity of these data representations poses significant challenges.As shown in Fig. 1, point clouds are not immune to quality degradation, particularly during the process of generation and transmission. The transfer of point clouds across networks, storage systems, or different software applications can introduce various forms of distortion, noise, and loss of information, which may substantially impact the utility and accuracy of the 3D models they represent. Therefore, point cloud quality assessment(PCQA) is of great importance in the research and development process. The need to assess the fidelity, integrity, and reliability of point clouds is becoming increasingly evident to preserve the quality of 3D data in practical applications. The availability of high-quality point clouds is fundamental to the success of downstream tasks (e.g., 3D reconstruction, object recognition, and analysis), as well as to the overall efficiency and robustness of various 3D-based systems.
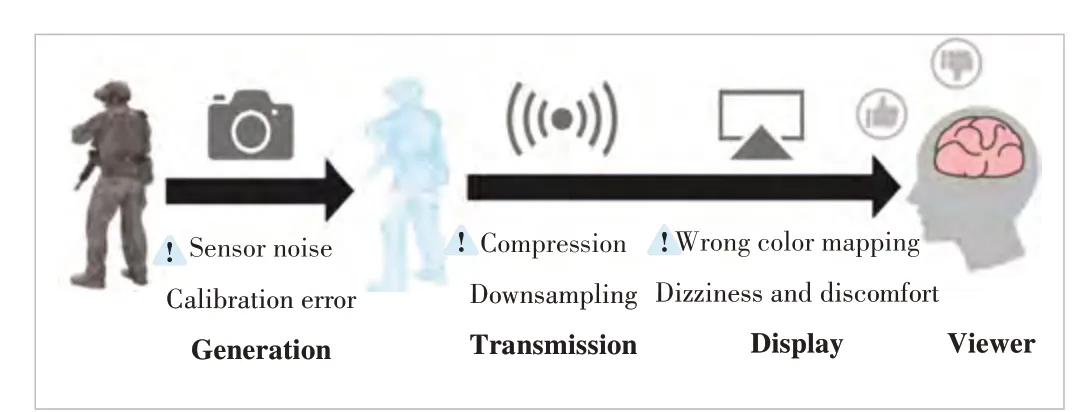
▲Figure 1. Illustration of how distortions are generated in point clouds
Based on these considerations, this paper aims to provide insights into how point cloud quality can be comprehensively assessed. By carefully reviewing and summarizing existing methods and research results, we provide an overview of the current developments in the field of PCQA. In addition, this paper aims to promote the continuous progress and practical application of point cloud technology. A deeper understanding of point cloud quality assessment can pave the way for improved 3D data utilization in various industries and open up new possibilities in the fields of design, analytics, and immersive experiences.
2 Subjective Point Cloud Quality Assessment
This chapter delves into the assessment of human perception of point clouds with the aim of understanding how users subjectively perceive the quality of these 3D data representations. The chapter begins by describing various common types of point cloud distortion that may affect human perception. By shedding light on these distortions, the chapter highlights the importance of addressing these issues to improve the overall quality of point cloud visualization and ensure a more accurate user experience. An introduction to existing point cloud databases follows the discussion of point cloud distortion. This section focuses on databases curated specifically for subjective quality assessment purposes. The significance of such databases lies in their ability to provide researchers with carefully controlled test cases that allow for the systematic study of human perception at different levels of distortion.
2.1 Common Types of Distortion in Point Clouds
As the point cloud distortion modeled in LS-PCQA[4](a large-scale PCQA dataset) by LIU et al., point clouds are not only subjected to various degrees of noise, compression, and sampling, but even localized distortions such as loss, rotation,and Audio Video Coding Standard (AVS) during the actual generation and communication transmission process. We select four most common types of point cloud distortion to introduce, including color noise, geometric noise, downsampling and point cloud compression. The visual effects of the various distortions are shown in Fig. 2.
1) Color noise. Point cloud color noise is defined as unwanted variations and inaccuracies in the color information associated with individual points in a 3D point cloud. When acquiring point cloud data from various sources such as 3D scanners and LiDAR systems, color information is typically captured along with the 3D coordinates of each point. However,due to factors such as sensor noise, lighting conditions, and calibration errors, the color values assigned to the points may deviate from the true color of the corresponding object or surface in the real world. This may result in an inconsistent visual appearance of the point cloud and affect subsequent applications that rely on accurate color information.
2) Geometry noise. Point cloud geometry noise is the inherent irregularities and inaccuracies in the spatial coordinates of individual points in a 3D point cloud. These inaccuracies can arise from a variety of causes, including sensor limitations,measurement errors, calibration issues and occlusions during data acquisition. As a result, the point cloud may contain shifted or misaligned points, resulting in reduced geometric accuracy and fidelity. Geometry noise can adversely affect the quality of the 3D model derived from the point cloud as well as subsequent tasks.
3) Downsampling. Point cloud downsampling is a key technique used to reduce the data size of 3D point clouds while preserving the underlying structural and spatial information.Large-scale point clouds acquired from 3D scanning or Li-DAR systems may contain millions or billions of points, and processing and storing these points require extensive computation. Downsampling involves the systematic removal of a subset of points from the original data, thereby effectively simplifying its representation without significantly affecting its overall shape and characteristics. However, downsampling also poses challenges, as indiscriminate removal of points might compromise fine details and key features, which could affect downstream applications like object recognition or surface reconstruction.

▲Figure 2. Visualization of common point cloud distortions. The first row shows the reference point clouds and the second row from left to right shows the distortion effects of color noise, geometric noise, downsampling, geometry-based point cloud compression (GPCC) and video-based point cloud compression (VPCC), respectively. The selected point clouds shown are derived from existing databases[5-6] or related research[7]
4) Compression. Point cloud compression is a vital area of research that aims to reduce the storage and transmission requirements of 3D point cloud data while preserving its essential geometric and semantic properties. One prominent approach to point cloud compression is the development of the video-based point cloud compression (VPCC) standard, which leverages the coding efficiency of video compression techniques adapted to the point cloud domain. VPCC efficiently represents point clouds by exploiting temporal redundancies and inter-frame dependencies, enabling high compression ratios while maintaining visual quality and accuracy. Another significant advancement in point cloud compression is the geometry-based point cloud compression (GPCC) standard.GPCC focuses on the efficient compression of point cloud geometry, utilizing various techniques like octree-based coding,predictive coding, and attribute coding. By considering the geometric properties of point clouds, GPCC achieves superior compression performance while facilitating fast and reliable decompression for real-time applications. VPCC and GPCC play a key role in optimizing the storage and delivery of massive point cloud databases, making them more accessible and usable in a variety of applications such as virtual reality, augmented reality, and cloud-based services. However, at the same time, point cloud compression inevitably leads to degradation of point cloud quality.
2.2 Common Subjective Experimental Setups
Presenting point cloud content is essential to harness the valuable information it contains. As a versatile data format,point clouds can be visualized using various methods. Traditional 2D monitors allow for a flat, easily accessible representation of point clouds, enabling researchers and users to explore the data from different angles. On the other hand, 3D monitors provide a more immersive experience, allowing a deeper understanding of the spatial relationships among the points. Furthermore, head-mounted devices (HMDs), such as virtual reality (VR) headsets, take the presentation of point clouds to another level, offering an unparalleled sense of presence and interaction with the 3D data. The summary of existing point cloud subjective evaluation works is presented in Table 1, with significant differences in interaction methods,viewing displays, scoring methods, and more. There are three prevalent scoring methodologies employed in the assessment of perceptual quality: the Double-Stimulus Impairment Scale(DSIS), Absolute Category Rating (ACR), and Pairwise Comparison (PWC). In DSIS, evaluators are presented with a reference point cloud and a distorted point cloud, with the task of rating the quality of the distorted point cloud. Conversely, in ACR, evaluators are tasked with categorizing each distortedpoint cloud into predefined quality categories, such as “excellent,” “good,” “fair,” or “poor.” In the case of PWC, evaluators are presented with pairs of distorted point clouds and are required to indicate which of the two exhibits superior quality.ALEXIOU et al. compared the DSIS and ACR methods in Ref.[8]. They found the phenomenon that the DSIS and ACR methods are statistically equivalent, but there are slight differences in the assessment results for different types of distortion. They also found that subjects prefer the DSIS evaluation method.Meanwhile, NEHMÉ et al.[9]extended this study to VR environments, finding that DSIS is more accurate than ACR, especially in terms of color distortion. Their conclusions are highly consistent with the observation in Table 1 that DSIS is more commonly used than ACR and PWC methods. In addition, by observing Table 1, we find that many current subjective evaluations[4-6,8,10-28]are conducted through a 2D monitor, but with the continuous development of display technology and AR/VR technology, emerging display technologies are gradually being applied to subjective experiments. ALEXIOU et al.[29]used augmented reality HMDs for the first time in point cloud quality assessment work. Additionally, 3D monitors were used in the work of ALEXIOU et al.[30-31]and ICIP2020 for point cloud subjective evaluation. Although existing studies[32-33]have pointed out that 3D display technology is more likely to cause adverse side effects (including dizziness, nausea, disorientation, etc.), we cannot deny that the immersive experience and rich visual information provided by 3D display technology are incomparable to a 2D monitor. Another way to enhance the audience’s experience is to introduce interaction. This interaction can freely adjust the viewing angle with a mouse on a 2D monitor[4,11], or it can freely move around and observe point clouds in an AR/VR environment through HMD devices[34-36]. LIU et al.[5]believe that introducing interaction and passive observation of point clouds by the audience are equally effective in subjective tests, but the latter method has a slight advantage in terms of repeatability. In conclusion, the optimal subjective testing setup for point clouds is still an unresolved issue, and in most cases, the appropriate experimental setup is chosen based on the actual situation. Therefore,further exploration in this area is needed.
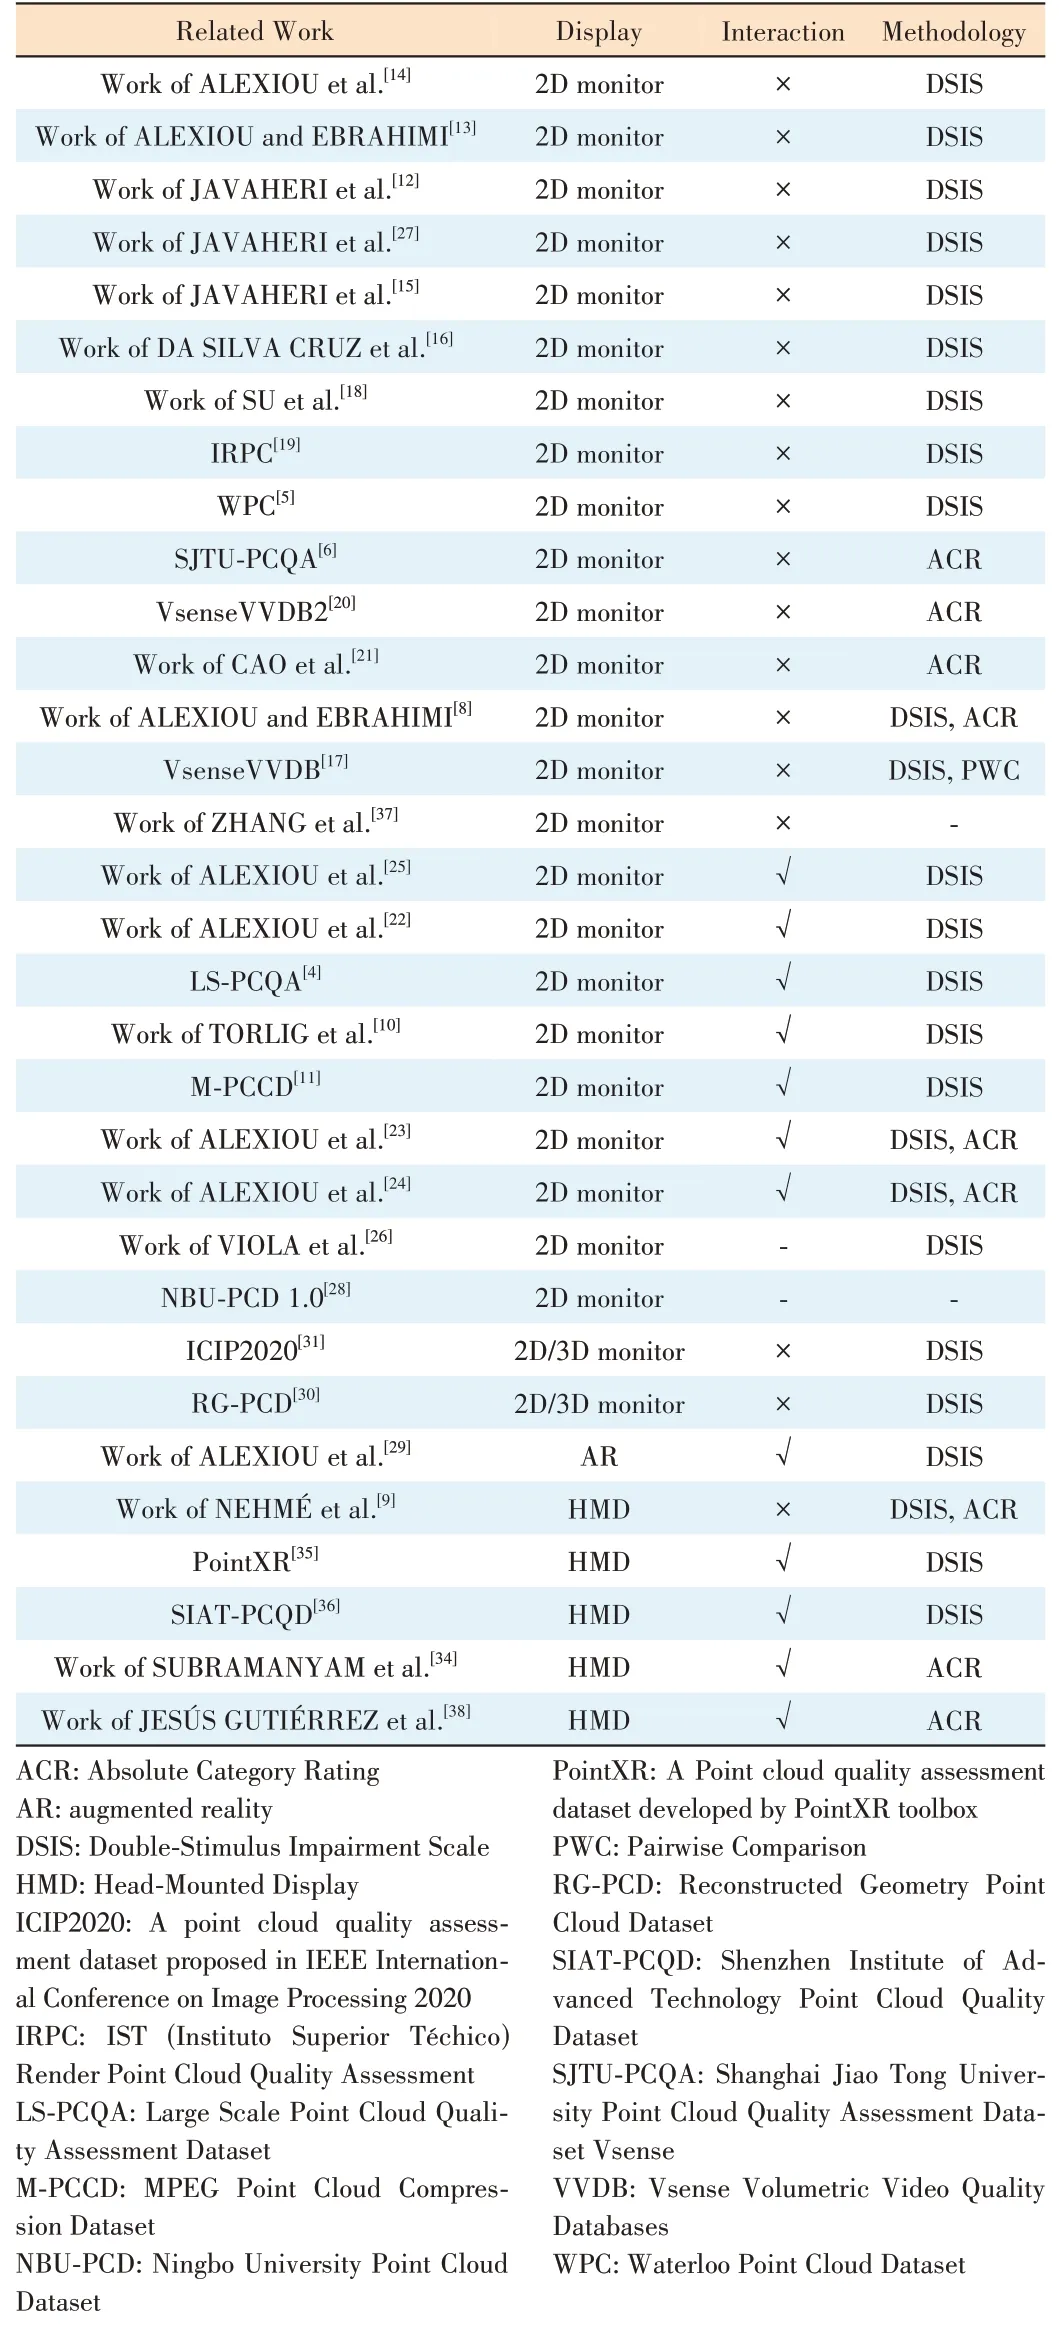
▼Table 1. Summary of the experimental setups for subjective cloud quality assessment
2.3 Related Subjective Databases
The successive establishment of various databases has played a pivotal role in advancing the field of point cloud quality assessment. As early as the last century, Stanford University established a 3D scanning database[39], which is still used in current PCQA research[8,29-30]. However, the deficiencies of this database have emerged with the gradual deepening of related PCQA research. Firstly, the point cloud content covered in Stanford’s 3D scanning library is not diverse enough. As a result, the Motion Picture Experts Group (MPEG) and the Joint Photographic Experts Group (JPEG) proposed the MPEG point cloud database[40]and the JPEG Pleno database[41]respectively, using cultural relics, daily necessities, and human figures as the subjects of point cloud quality research. The point clouds covered in these databases have been continued in many later databases[6,8,11,17,19-20,28-31,35-36,42]. In the databases established afterward, the content and objects represented by point clouds became more and more abundant,which provides convenience for the development of related research on PCQA.
In recent years, DA SILVA CRUZ et al.[16]and AK et al.[43]have chosen not only the common point cloud representations of humans and animals and inanimate objects during the process of conducting subjective experiments but also included architecture and landscapes. The former introduced eight original point clouds in the experiment to explore the subjective evaluation methods of point clouds, while the latter established the BASICS database[43]around 75 original point clouds and conducted research on objective evaluation methods. Furthermore, because most of the point clouds in the database[39]are colorless, after ALEXIOU et al.[8,13-14,30]and JAVAHERI et al.[12]established the initial workflow of subjective colorless point cloud evaluation, colored point clouds attracted a wide range of research interest due to their richer visual information, becoming mainstream in PCQA. Since then, various colored point cloud databases have been proposed[4-6,11,17,20,28,31,35,36,42-45]and in-depth research on subjective evaluation has been conducted. ZERMAN et al.[17,20]established a series of V-SENSE Volumetric Video Quality Databases (vsenseVVDB) , and through Unity rendering of volume video of point clouds, they conducted subjective assessments of colored point clouds, finding that texture distortion is more likely to affect point cloud quality than geometric distortion. They also compared the quality of mesh and point cloud,two common types of 3D data representation, during limited bitrate transmission. The results showed that the mesh had higher quality in high bitrate transmission, and point clouds had the opposite conclusion. ALEXIOU et al.[35]also used Unity to develop the PointXR toolbox, but assessed the quality of colored point cloud content through virtual reality technology, enhancing the interactivity of the evaluation process. By analyzing participant interaction patterns, the authors found that, under six degrees-of-freedom (6DoF) observation, participants preferred close-up frontal observation. Real-world applications often require databases to more realistically simulate the possible distortion effects of point clouds in the communication process of collection, storage, compression, transmission, rendering, and display, but the database[39]can no longer meet these requirements.
In the process of establishing later databases, SU et al.[18]applied downsampling, Gaussian noise, and three advanced point cloud compression algorithms to create distorted point clouds. They clarified the types of point cloud distortions from both geometric and texture perspectives. Geometric distortions include hollows, geometric noise, holes, shape distortions, collapses, gaps, and blurring, while texture distortions include texture noise, blocks, blurring, and bleeding. After the MPEG committee standardized the advanced point cloud encoder, the two advanced point cloud codecs, GPCC and VPCC, received more attention in subjective PCQA research. JAVAHERI et al. established the IRPC database, studying the impact of three different encoding methods and three rendering solutions on the visual perceptual quality of point clouds[19]. Additionally, the authors creatively evaluated the performance of the encoding scheme proposed by MPEG. PERRY et al. confirmed that VPCC’s compression performance on static content is superior to GPCC through subjective point cloud quality assessment experiments conducted in four independent labs against the established ICIP2020 database[31]. In the databases established in recent years, the types of distortions are more standardized and comprehensive. The WPC database established by LIU et al. covers Gaussian noise, downsampling,GPCC, and VPCC[5]. YANG et al. established the SJTUPCQA[6], which simulates distortions during the communication process, including octree-based compression, color noise,geometric noise, and scaling enhancement.
To more intuitively and clearly exhibit the development of point cloud subjective databases, we have listed the information of some databases in recent years in Table 2. From Table 2, we can surmise that subjective PCQA databases are striving to develop in the direction of larger scale, more comprehensive distortions, and more realistic and richer point cloud models.
3 Objective Point Cloud Quality Assessment
Although subjective quality evaluation is considered to be the test method that best matches the visual perception of the human eye, conducting subjective experiments often costs a great deal of labor and time. Therefore, objective point cloud quality evaluation has emerged as a promising alternative to alleviate the drawbacks of subjective evaluations. Some objective point cloud quality evaluation methods are listed in Table 3. As with traditional image or video quality assessment, defined from the perspective of the amount of reference information, objective PCQA methods can be categorized into fullreference (FR), reduced-reference (RR), and no-reference(NR) assessment methods. Within this classification, FR PCQA methods are distinguished by their utilization of complete reference point clouds during the assessment of distorted point clouds. Conversely, NR PCQA methods rely exclusively on the distorted point clouds for quality evaluation, without access to the reference point clouds. The RR PCQA methods possess the capability to employ a subset of feature information extracted from the reference point clouds as reference.Subsequently, they conduct a comparative and analytical evaluation of the distorted point clouds, culminating in the derivation of quality assessment outcomes. As defined by the feature extraction method, the objective PCQA methods canbe further categorized into two main groups: model-based methods[4,23,26-28,42,47-64]and projection-based methods[6,10-11,18,25,36,65-67].
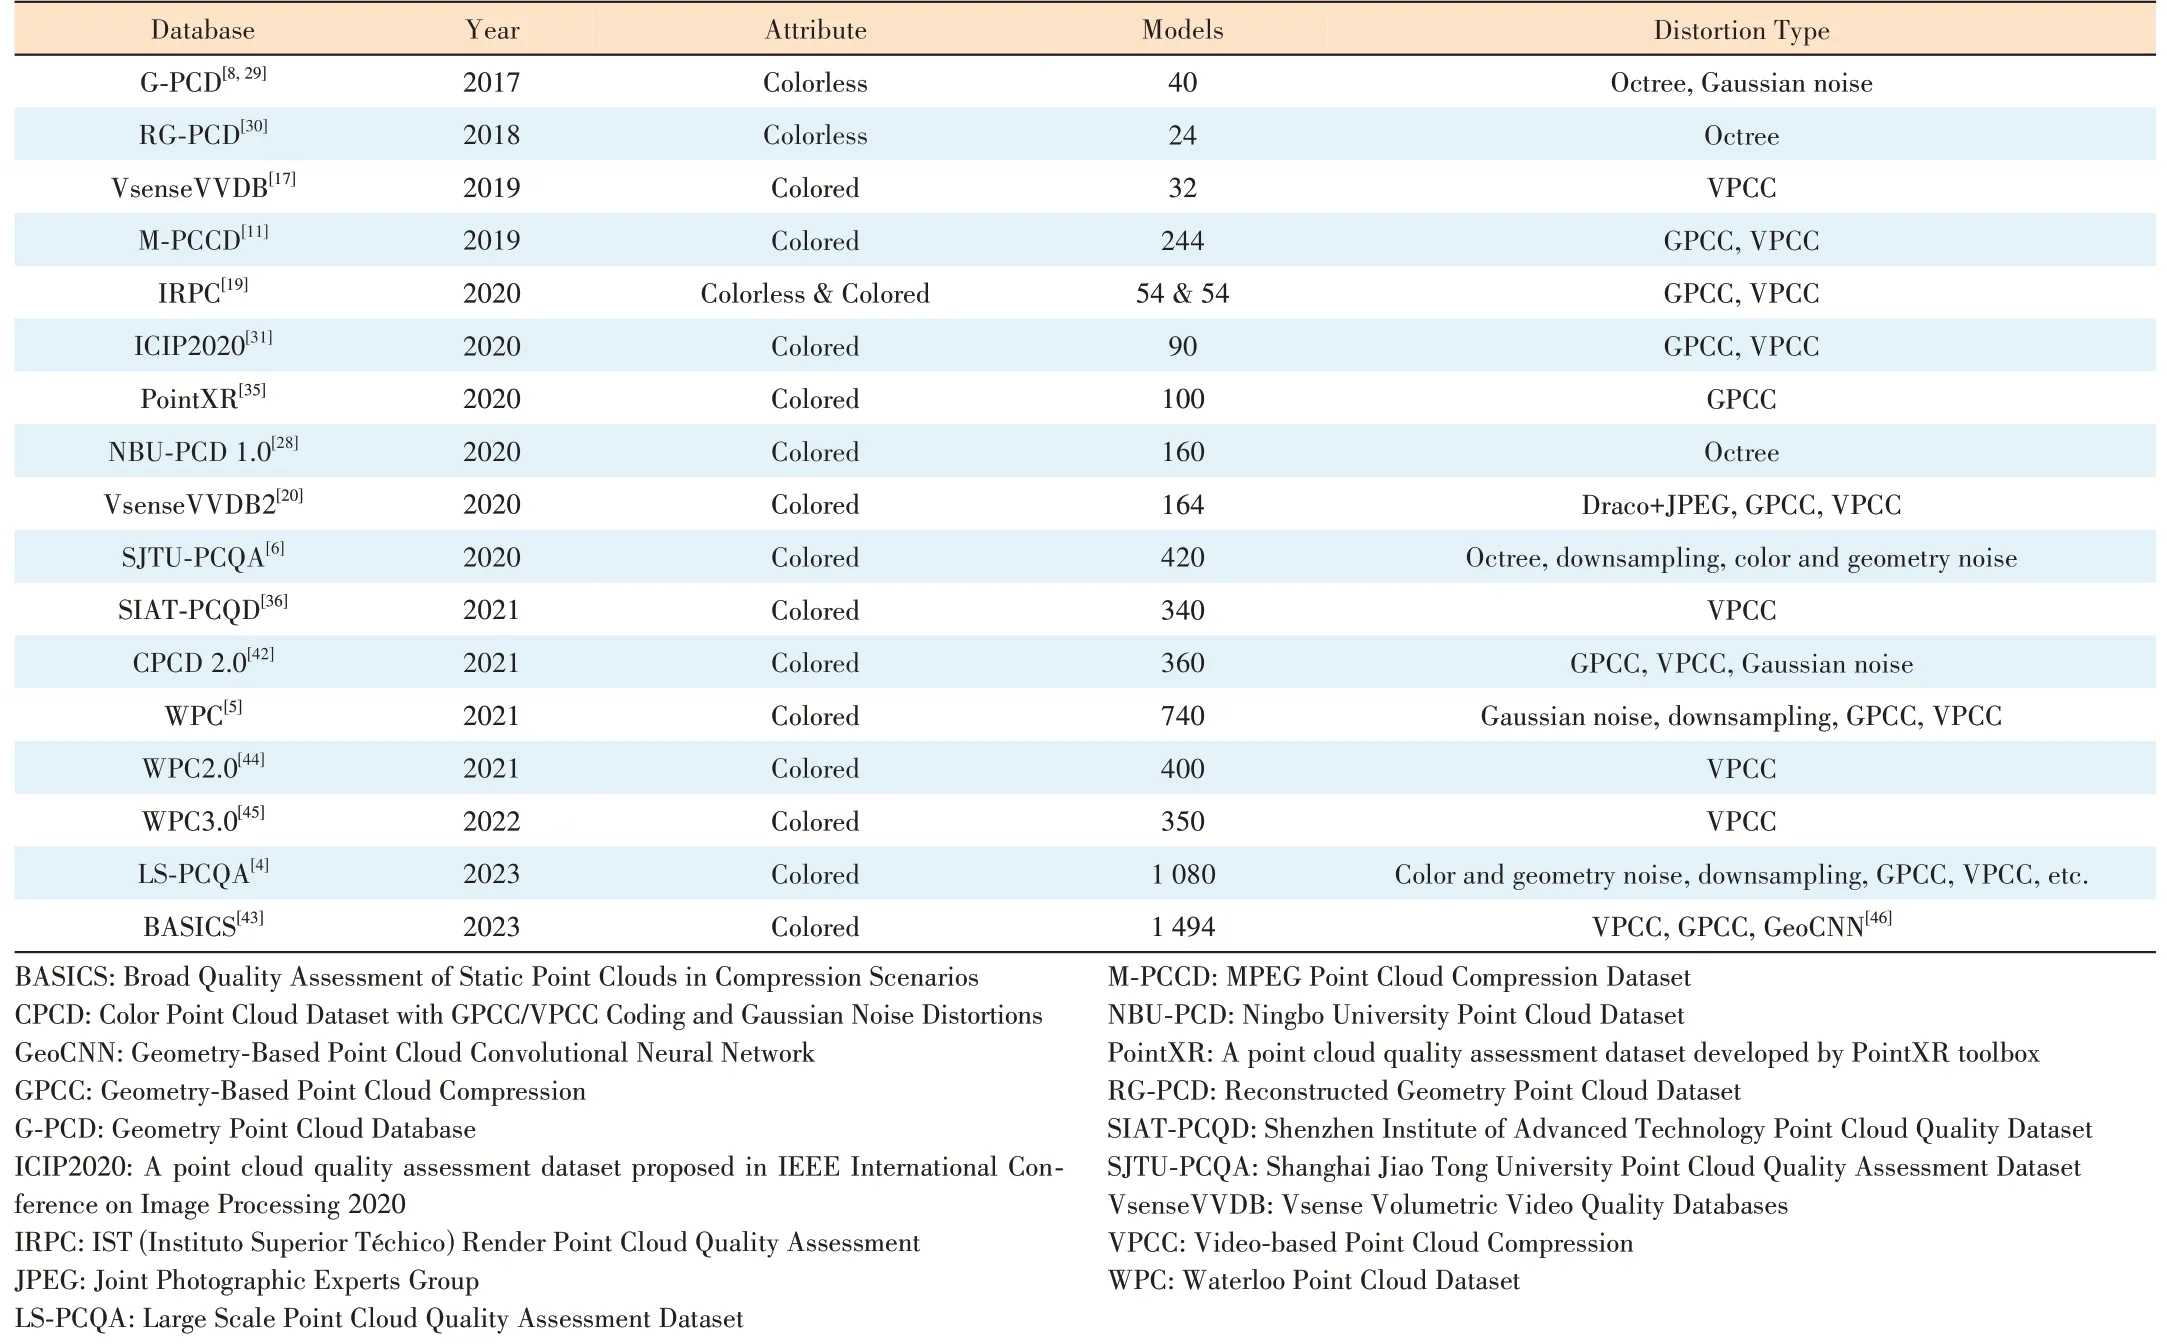
▼Table 2. An overview of subjective PCQA databases
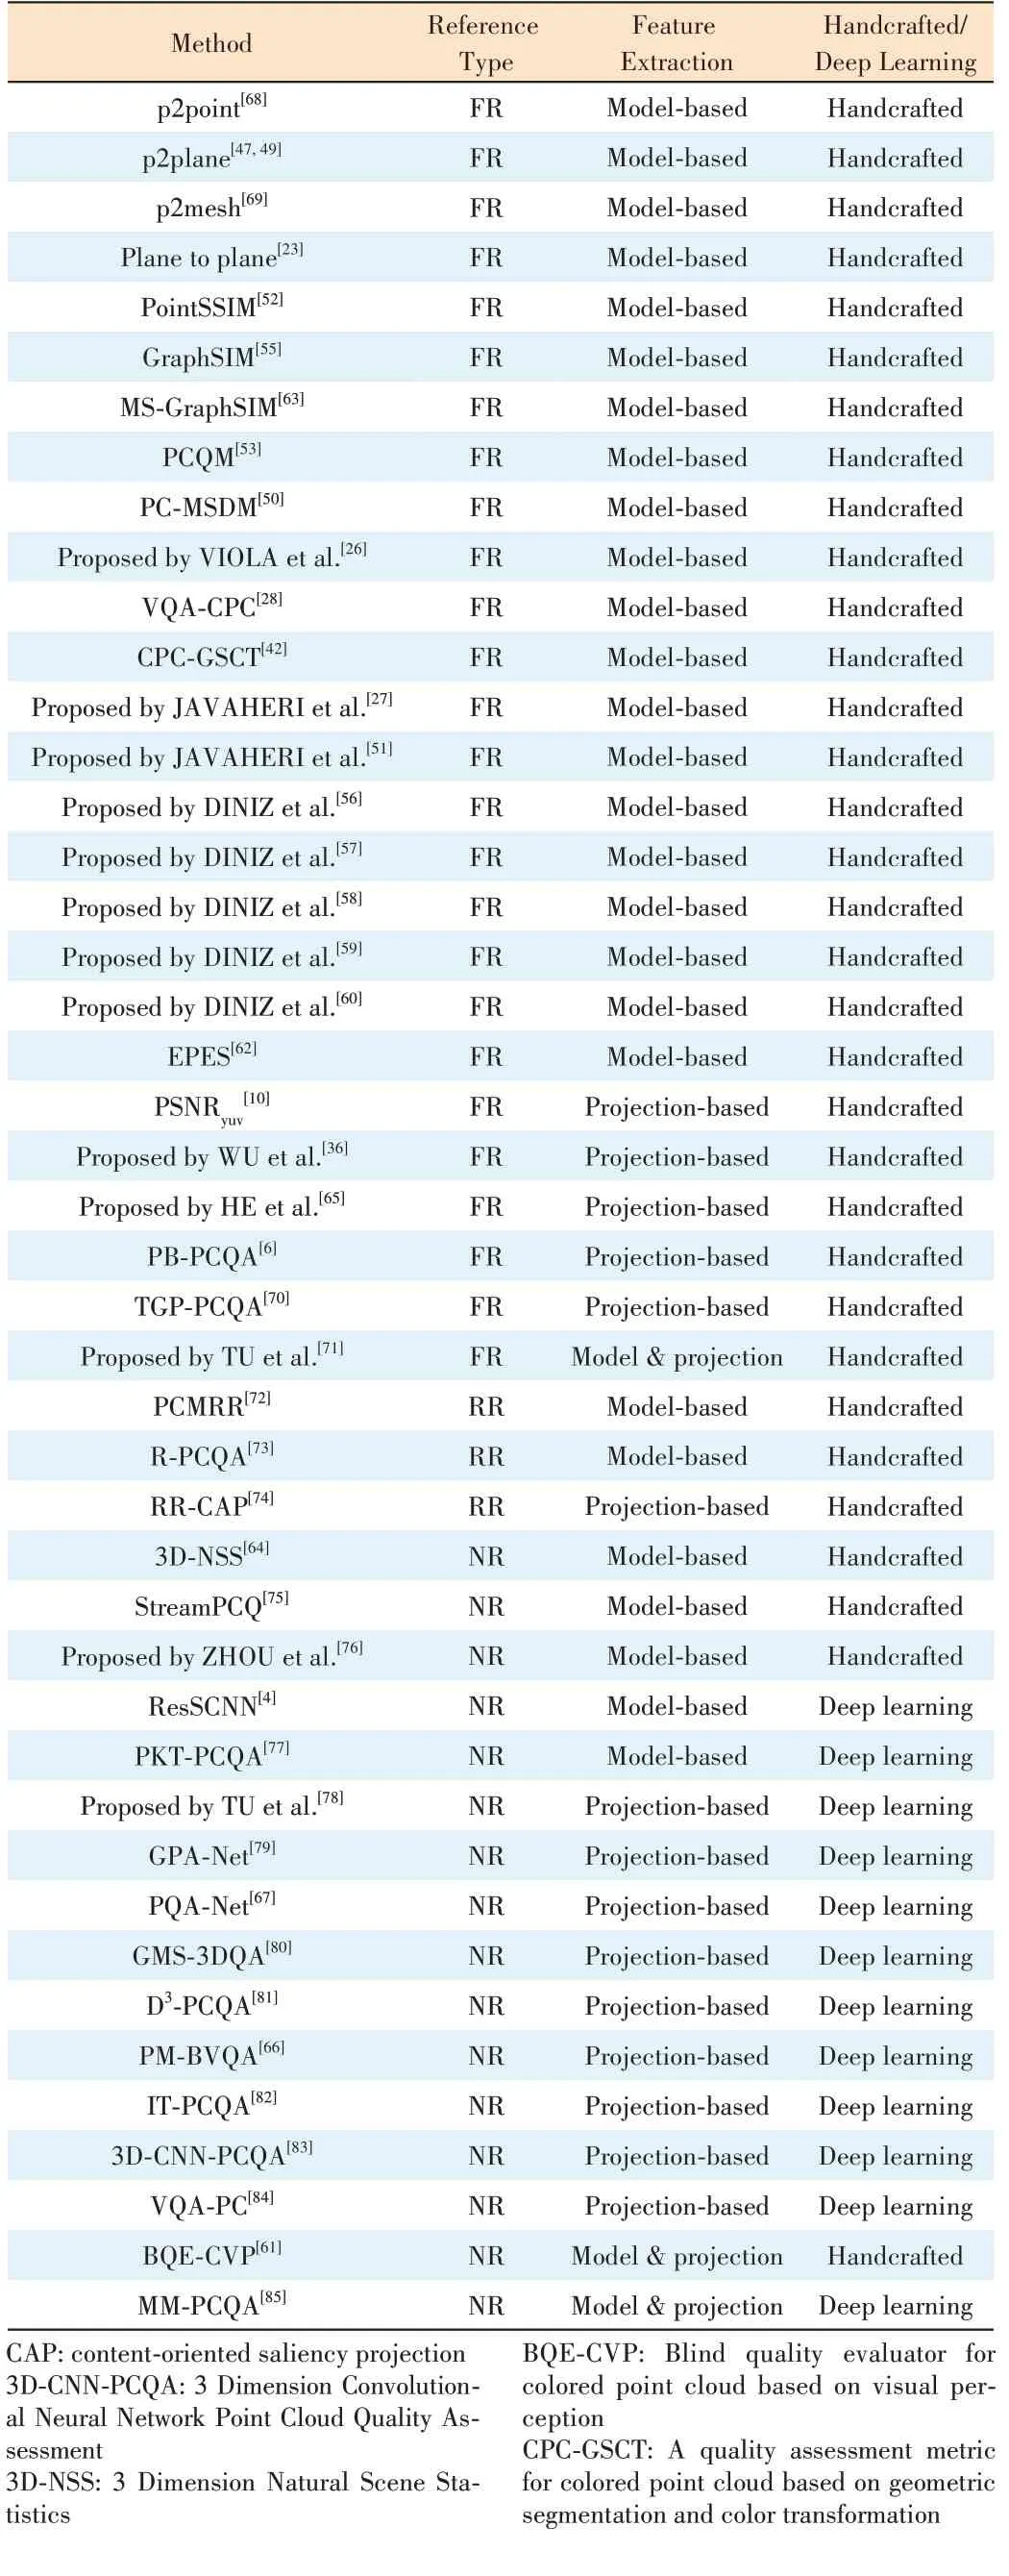
▼Table 3. Summary of objective cloud quality assessment methods
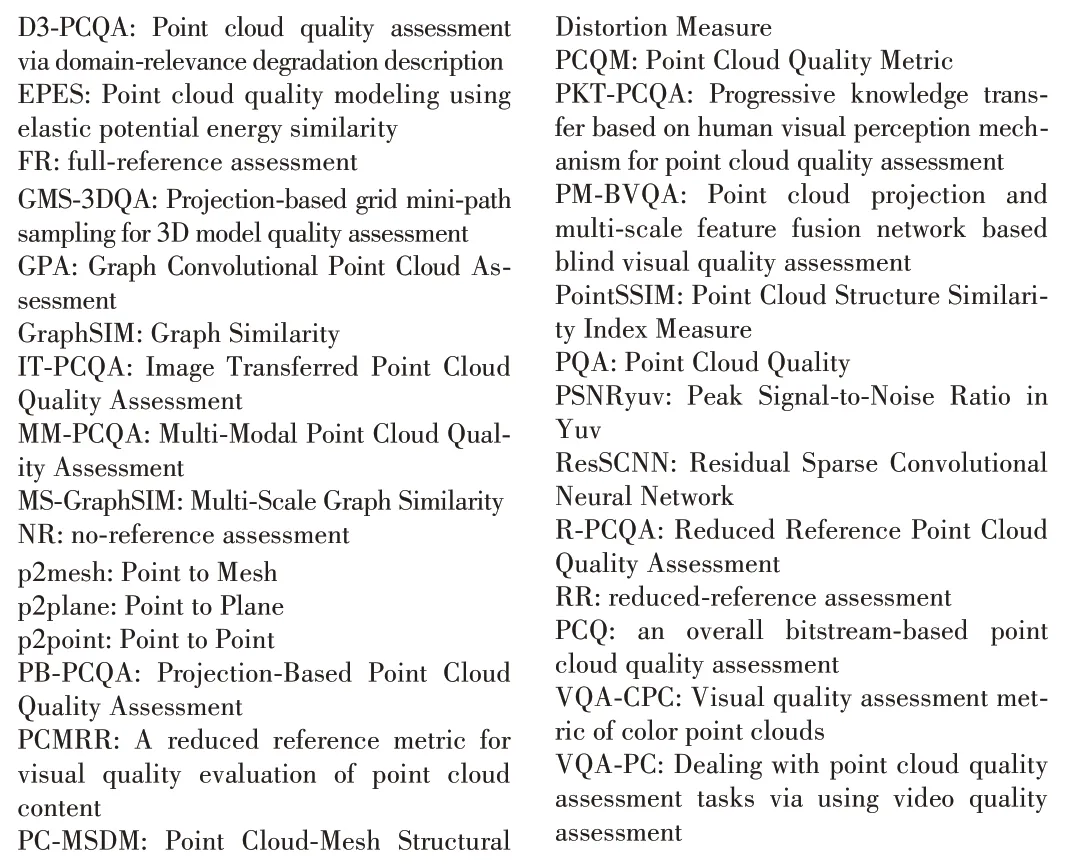
D3-PCQA: Point cloud quality assessment via domain-relevance degradation description EPES: Point cloud quality modeling using elastic potential energy similarity FR: full-reference assessment GMS-3DQA: Projection-based grid mini-path sampling for 3D model quality assessment GPA: Graph Convolutional Point Cloud Assessment GraphSIM: Graph Similarity IT-PCQA: Image Transferred Point Cloud Quality Assessment MM-PCQA: Multi-Modal Point Cloud Quality Assessment MS-GraphSIM: Multi-Scale Graph Similarity NR: no-reference assessment p2mesh: Point to Mesh p2plane: Point to Plane p2point: Point to Point PB-PCQA: Projection-Based Point Cloud Quality Assessment PCMRR: A reduced reference metric for visual quality evaluation of point cloud content PC-MSDM: Point Cloud-Mesh Structural Distortion Measure PCQM: Point Cloud Quality Metric PKT-PCQA: Progressive knowledge transfer based on human visual perception mechanism for point cloud quality assessment PM-BVQA: Point cloud projection and multi-scale feature fusion network based blind visual quality assessment PointSSIM: Point Cloud Structure Similarity Index Measure PQA: Point Cloud Quality PSNRyuv: Peak Signal-to-Noise Ratio in Yuv ResSCNN: Residual Sparse Convolutional Neural Network R-PCQA: Reduced Reference Point Cloud Quality Assessment RR: reduced-reference assessment PCQ: an overall bitstream-based point cloud quality assessment VQA-CPC: Visual quality assessment metric of color point clouds VQA-PC: Dealing with point cloud quality assessment tasks via using video quality assessment
3.1 Model-Based Methods
In the early stage of research on objective point cloud quality assessment, most of the research started from the perspective of the 3D model of the point cloud. Fig. 3 illustrates the general framework of the model-based methods. Specifically,methods such as p2point[68], p2plane[47,49]p2mesh[69]and plane2plane[23]give quality scores by calculating the distance between discrete points as a similarity metric. Differently,p2point[68]uses the Euclidean distance between points as a similarity measure, p2plane[47,49]calculates the projection error of related points along the discovery direction, while plane2plane[23]evaluates the quality of point clouds through the angle similarity of the tangent plane. Later, JAVAHERIE et al. introduced more distance measures into objective PCQA, including Peak-Signal-to-Noise Ratio (PSNR)[27], Generalized Hausdorff Distance[51]and Mahalanobis Distance[54],to effectively measure the correspondence between points and distributions. MEYNET et al.[50]extended the Mesh Structural Distortion Measure (MSDM)[86-87]metric method in Mesh to the point cloud field, and designed PC-MSDM based on local curvature statistics. However, these works still stay in the measurement of geometric features of point clouds and ignore the rich color information that point clouds have.

▲Figure 3. General framework of model-based point cloud quality assessment (PCQA) methods. Dashed lines indicate different amounts of reference information in full-reference (FR), reduced-reference (RR),and no-reference (NR) methods
In the PCQA standards collected by MPEG, in addition to p2point[68]and p2plane[47,49], there is also PSNRyuv[10]that can perceive the texture distortion of colored point clouds. Since this method is based on the expansion of PSNR, it inevitably possesses the limitations of PSNR itself[88-89]. Therefore,ALEXIOU et al.[52]considered extending Structural Similarity(SSIM)[88]. They focused on studying four factors: geometry,normal vector, curvature, and color, and proposed PointSSIM.Meanwhile, MEYNET et al.[53]explored four factors in Point Cloud Quality Metric (PCQM), namely, curvature, brightness,chroma, and hue. These factors are combined by using optimal linear weighting. Furthermore, DINIZ et al. further explored point cloud color perception and proposed statistical variants of local binary patterns (LBP)[56-57], perceived color distance patterns (PCDP)[58], and local luminance patterns(LLP)[59], achieving excellent performance on multiple databases. Besides, they combined geometric and color statistical information to propose a low-complexity BitDance[60]algorithm. These methods combine the geometric and color information of point clouds and promote the development of objective quality assessment of colored point clouds to a certain extent. However, whether the underlying principles of these methods are in line with the human visual system still needs to be further verified. YANG et al.[55]proposed GraphSIM based on the fact that the human visual system is more sensitive to high-frequency signals, integrating local graph similarity features and color gradients. ZHANG et al.[63]improved GraphSIM with consideration to the multi-scale characteristic of human visual perception and proposed MS-GraphSIM. We can see that many current works are paying more attention to the perception mechanism of the human visual system itself.On the other hand, we also see XU et al.[62]combining the concept of elastic potential energy similarity, interpreting point cloud distortion as the work done by external forces on the reference point cloud, and creatively combining relevant knowledge in the physical field with visual perception. Whether the rich research results in other fields can guide objective point cloud quality assessment is a topic worthy of attention and indepth exploration.
The above methods all involve reference point clouds when evaluating point cloud quality, and in many practical cases,we cannot obtain all the reference point clouds or there are no point clouds for reference at all. Therefore, related research on RR and NR assessment methods is very necessary. Due to the lack of reference information, RR and NR objective PCQA methods are more challenging. A Reduced Reference Metric for Visual Quality Evaluation of Point Cloud Content (PCMRR)[72]and Reduced reference Point Cloud Quality Assessment (RPCQA)[73]are two commonly used modelbased RR PCQA methods. The former reduces references by extracting statistical features in the geometry, color and normal vector domains, while the latter achieves reduced-reference by fitting the relationship between quantization steps and perceived quality. Feature extraction can be divided into two types. One is to manually extract the required features based on the model itself. For example,ZHOU et al.[76]combined human brain cognition to design a blind evaluation method using a structure-guided resampling(SGR) method, extracting three features: ensemble density,color naturalness, and angle consistency. ZHANG et al.[64]used 3D scene statistics (3D-NSS) and entropy to extract quality perception features, and finally used support vector regression (SVR) to get the quality score of the point cloud. SU et al.[75]explored from the perspective of end-user Quality of Experience (QoE) and developed a bitstream-based no-reference method. Another type is to use deep learning to extract point cloud quality features. Typical methods include ResSCNN[4]and perceptual quality assessment of point clouds (PKTPCQA)[77]. The former is based on sparse convolutional neural networks and the latter is based on progressive knowledge transfer. Combined with Table 3, it is not difficult to find that existing works rarely extract quality features of point cloud models themselves through deep learning. One possible reason is that point clouds, as a dense data structure, require a huge amount of space and cost in storage and calculation.Therefore, point clouds are not suitable for direct feature extraction through deep learning.
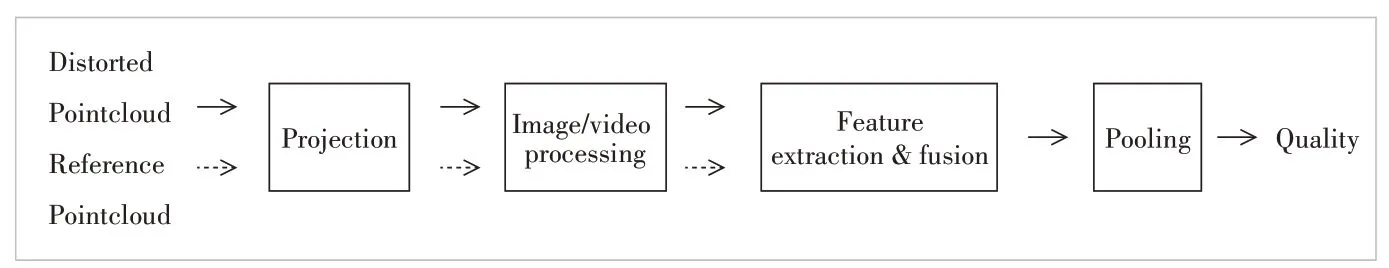
▲Figure 4. General framework of projection-based point cloud quality assessment (PCQA)methods. Dashed lines indicate different amounts of reference information in full-reference(FR), reduced-reference (RR), and no-reference (NR) methods
3.2 Projection-Based Methods
As shown in Fig. 4, the projection-based method projects a 3D point cloud and represents the quality of the entire point cloud by evaluating the quality of the projection. The method effectively circumvents the problems of storage space and computational overhead caused by the point cloud. Projectionbased methods can be used for full-reference objective point cloud quality evaluation[6,36,65], as well as reduced-reference[74]and no-reference quality evaluation methods[66-67,78-84]. Regarding the setup of projection, ALEXIOU et al. conducted experiments in Ref. [25]. The results show that when the projection exceeds six projection planes, the quality prediction performance does not significantly improve. Based on these results, YANG et al.[6]first projected the reference point cloud and distorted point clouds onto six planes separately through perspective projection, and then extracted global and local features of depth and color images through projection to evaluate point cloud quality. However, WU et al.[36]believe that this method causes inevitable occlusion and misalignment in the point cloud during the projection process. In addition, they believe that projections from different angles have different impacts on visual perception. Therefore, they proposed a viewbased projection weighted model and a block-based projection model. ZHOU et al.[74]applied the projection method to reduced-reference point cloud quality evaluation. They simplified the reference point cloud and distorted point cloud through downsampling to obtain content-oriented saliency projection (RR-CAP), so that users do not need to obtain a large number of reference point clouds from the transmission end when evaluating point cloud quality. In contrast to modelbased objective quality evaluation, many no-reference quality evaluation methods based on projection extract features of the projection through deep learning. This is partly because the projection method converts three-dimensional point clouds into two-dimensional data for processing, reducing the computational complexity and making deep learning feasible in point cloud quality evaluation. On the other hand, due to the excellent performance of deep learning in many computer vision tasks, scholars unanimously acknowledge the outstanding feature extraction capability of deep networks. The specific implementation methods include evaluating point clouds by projecting point clouds into images and using existing image quality evaluation methods[83-84,90-97], and processing point clouds rendered into videos from different angles by setting the orbit of virtual cameras. The former extracts temporal features from rendered point cloud videos using a modified ResNet3D[98], while the latter believes that temporal features are insufficient to describe the quality of point clouds, so it selects key frames from point cloud videos for spatial feature extraction using 2D-CNN and finally evaluates point clouds combining temporal and spatial features. In addition, hot topics in the field of deep learning such as multimodal learning[66], multitask learning[67,79], dual-stream convolutional networks[78], graph convolutional networks[79], domain adaptation[82], and domain generalization[81]have also been applied in no-reference point cloud quality evaluation.By observing Table 3, we can find that Refs. [61] and [85]combine the two mainstream methods of model-based and projection-based to evaluate the quality of point clouds. After analysis, we can conclude that although projection-based methods have significant advantages in efficiency and computational quantity, they inherently observe threedimensional point clouds through two-dimensional virtual cameras, inevitably leading to the problem of incomplete information observation. Therefore, to alleviate the limitations of two-dimensional media, it is feasible and worth exploring to introduce model-based methods. However, at the same time, how to effectively weigh the computational overhead and evaluate the performance of the method is also a topic that needs to be addressed and explored in depth.
4 Evaluation of PCQA Models
4.1 Evaluation Protocol
The current point cloud quality evaluation methods generally follow the recommendations given by the Video Quality Expert Group (VQEG)[99]in the field of image quality assessment (IQA). The evaluation is conducted from three aspects:prediction accuracy, monotonicity, and consistency. Typically,a five-parameter monotonic logistic function is used to calculate the quality score:
whereoandprepresent the predicted scores and mapped scores, respectively. After nonlinear mapping, the performance of the PCQA model can be measured using the following four commonly used criteria: Spearman Rank-order Correlation Coefficient (SRCC), Pearson Linear Correlation Coefficient (PLCC), Kendall Rank-order Correlation Coefficient(KRCC), and Root Mean Square Error (RMSE). Eq. 2 provides the calculation process of SRCC:
wheredirepresents the difference in rankings between the objective score and predicted score of thei-th point cloud, andNrepresents the total number of point clouds. SRCC is used to measure the monotonicity of visual quality prediction, with its value ranging from 0 to 1. The closer SRCC is to 1, the better the performance of the model is considered to be. Eq. 3 provides the calculation process of PLCC:
wheresiandpiindicate the objective score and predicted score of thei-th point cloud, andandstand for the average values forsiandpi. PLCC is used to measure the linearity and consistency of visual quality prediction results, with its value ranging from 0 to 1. The closer PLCC is to 1, the better the performance of the model is considered to be. Eq. 4 provides the calculation process of KRCC:
whereNcandNdrepresent the number of consistent pairs and discordant pairs. KRCC utilizes the concept of “paired” data to determine the strength of the correlation coefficient. It can also be used to describe the monotonicity of visual quality prediction, with its value ranging from 0 to 1. The closer KRCC is to 1, the better the performance of the model is considered to be. Eq. 5 provides the calculation process of RMSE:
wheresiandpisimilarly represent the subjective score and the objective score after nonlinear mapping of thei-th point cloud.RMSE can be used to measure the accuracy of visual quality prediction. The lower the RMSE value, the better the performance of the model is considered to be.
4.2 Performance Comparison
In this section, we summarize the performance of common PCQA methods. Since not all surveyed methods are publicly available, we did not include all of them in the evaluation. We selected four widely used PCQA databases: IRPC[19],CPCD2.0[42], SJTU-PCQA[6], and WPC[5], to test all participating evaluation methods. Specifically, we reported the SRCC,PLCC, KRCC and RMSE metrics for full-reference, reducedreference, and no-reference quality assessment methods in Tables 4 and 5. It is worth stating that this chapter also reports some commonly used image and video quality evaluation methods to provide a more comprehensive assessment of objective point cloud quality evaluation methods. This is because projection-based methods are essentially a dimensionality reduction process, allowing 3D point clouds to be evaluated by 2D image or video quality evaluation methods as well.
Combining Tables 4 and 5, we can see that most of the methods with optimal performance take into account the features provided by the 3D model itself. This result proves that 3D models do provide more effective quality features than 2D projections. On the other hand, we can also see that the current projection-based methods represented by VQA-PC[84]have also achieved notable performance. One possible explanation is that VQA-PC focuses on dynamic quality-aware information, and recording the point cloud as a video through four moving paths allows for more point cloud detail from different viewpoints, thus preserving as much of the pointcloud’s 3D features as possible. Moreover,among the FR methods, we notice that CPCGSCT[42]performs well on three datasets. We believe that CPC-GSCT can perceive the quality of point clouds in a more comprehensive way by taking into account the geometric properties and color features of point clouds from the perspective of the point cloud model. Besides, among the NR methods, MM-PCQA[85]stands out in terms of performance, which is a novel multimodal fusion method for PCQA. The excellent performance further demonstrates the feasibility of multimodality in PCQA.
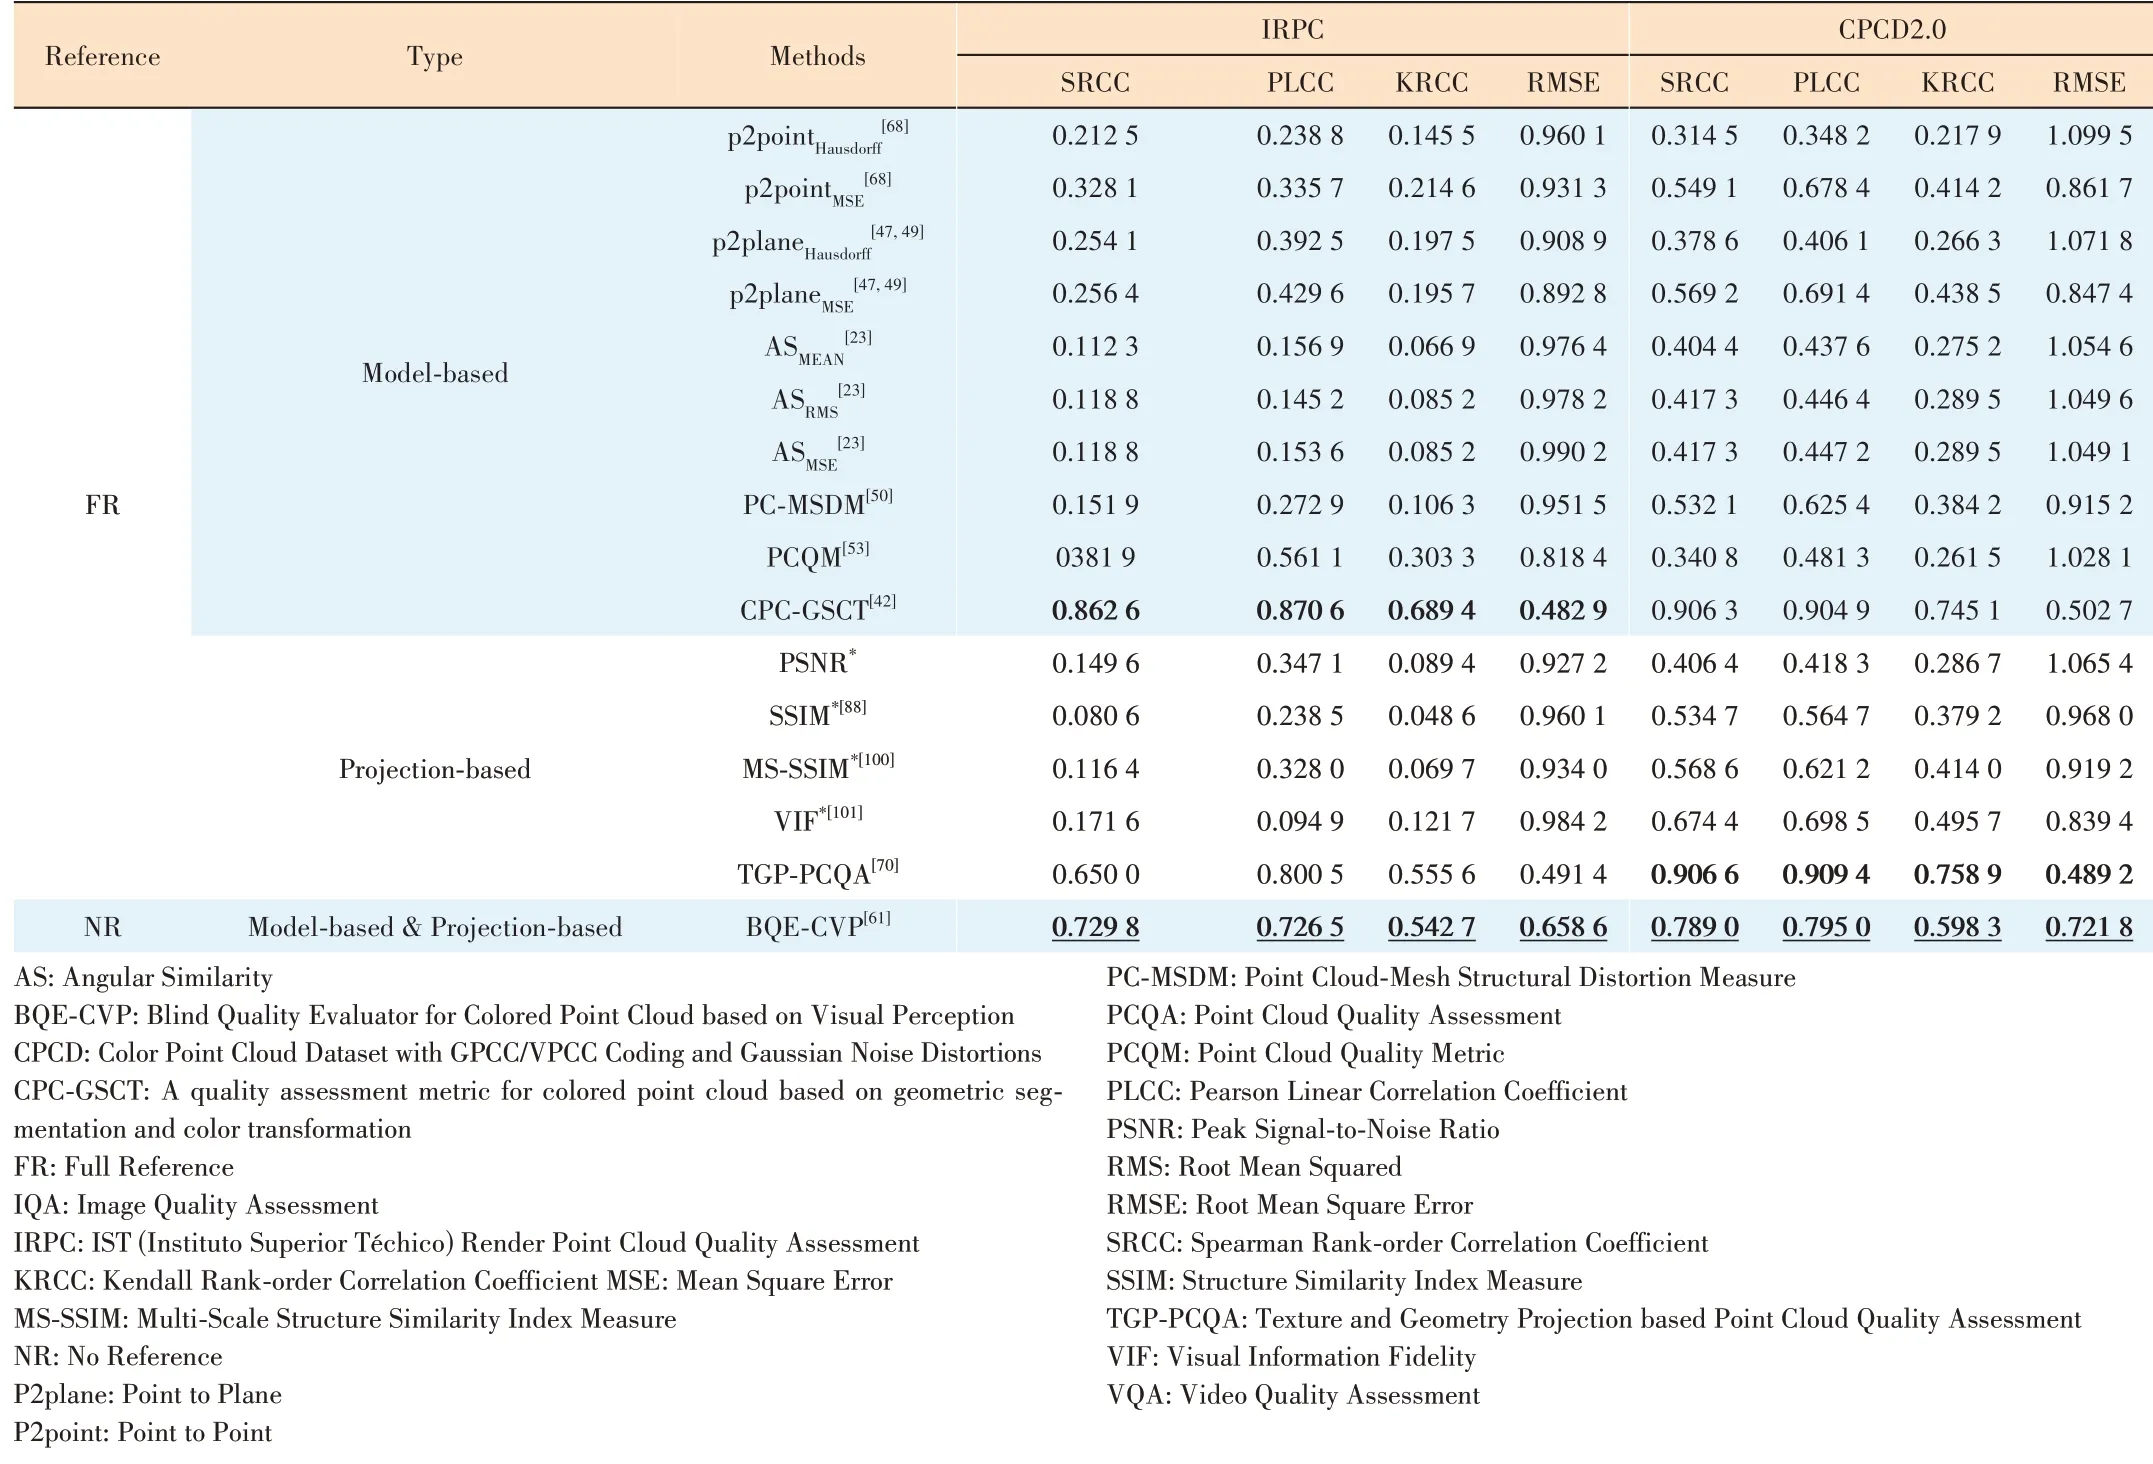
▼Table 4. Performance comparison of different PCQA methods on IRPC and CPCD2.0. For FR and NR methods, the best performance of each metric is marked in bold and underlined bold respectively. The IQA and VQA methods are marked with * superscript

▼Table 5. Performance comparison of different PCQA methods on SJTU-PCQA and WPC. For FR, RR, and NR methods, the best performance of each metric is marked in bold, bold italics, and underlined bold (vacant metrics are not counted in the comparison) respectively. The IQA and VQA methods are marked with * superscript
5 Conclusions
In this survey, we present a comprehensive and up-to-date review of PCQA. The paper begins with an introduction to point clouds and their wide range of applications. Along with it,there is an increasing demand for point cloud quality. Therefore, point cloud quality assessment has become a topic of great interest. Then we review the subjective quality evaluation of point clouds from three aspects: common distortion types of point clouds, commonly used subjective experimental setups, and existing subjective datasets.However, conducting subjective experiments is costly. Therefore, we further discusses objective point cloud quality evaluation methods, including model-based and projection-based methods. To assess these objective methods, we provide the evaluation criteria and report the performance of multiple approaches on four datasets. Overall, point cloud quality evaluation requires further research and exploration by relevant researchers and practitioners in both subjective and objective methods.
杂志排行

ZTE Communications的其它文章
- Table of Contents, Volume 21, 2023
- Special Topic on 3D Point Cloud Processing and Applications
- Beyond Video Quality: Evaluation of Spatial Presence in 360-Degree Videos
- Mixed Electric and Magnetic Coupling Design Based on Coupling Matrix Extraction
- A Hybrid Five-Level Single-Phase Rectifier with Low Common-Mode Voltage
- Incident and Problem Ticket Clustering and Classification Using Deep Learning