Electrode design for multimode suppression of aluminum nitride tuning fork resonators
2024-01-08YiYuanQingruiYangHaolinLiShuaiShiPengfeiNiuChonglingSunBohuaLiuMenglunZhangandWeiPang
Yi Yuan,Qingrui Yang, Haolin Li,Shuai Shi,Pengfei Niu,Chongling Sun,Bohua Liu,Menglun Zhang,and Wei Pang
AFFILIATIONS
State Key Laboratory of Precision Measuring Technology and Instruments,Tianjin University,Tianjin 300072,China
ABSTRACT This paper is focused on electrode design for piezoelectric tuning fork resonators.The relationship between the performance and electrode pattern of aluminum nitride piezoelectric tuning fork resonators vibrating in the in-plane flexura mode is investigated based on a set of resonators with different electrode lengths,widths,and ratios.Experimental and simulation results show that the electrode design impacts greatly the multimode effect induced from torsional modes but has little influenc on other loss mechanisms.Optimizing the electrode design suppresses the torsional mode successfully,thereby increasing the ratio of impedance at parallel and series resonant frequencies(Rp/Rs)by more than 80% and achieving a quality factor (Q) of 7753,an effective electromechanical coupling coefficien (kteff2) of 0.066%,and an impedance at series resonant frequency(Rm)of 23.6 kΩ.The proposed approach shows great potential for high-performance piezoelectric resonators,which are likely to be fundamental building blocks for sensors with high sensitivity and low noise and power consumption.
KEYWORDS Tuning fork,Multimode,AlN-based resonator,Microelectromechanical systems
I.INTRODUCTION
Microelectromechanical systems (MEMS) resonators have attracted much research and industry interest because of their unique features and their advantages of small size,high stability,low cost,and integration ability with integrated circuits.A major performance metric of MEMS resonators is the quality factorQ,with a higher total quality factor indicating that more energy is trapped in the resonator rather than dissipated,which contributes to high-resolution sensors and low-phase-noise oscillators.BesidesQ,the effective electromechanical coupling coefficienkteff2is used to evaluate the conversion rate between mechanical energy and electrical energy,with higherkteff2implying a greater potential for a filte with a broader bandwidth and an oscillator with a larger frequency pulling range.1In a sustained oscillation loop,the motional impedanceRmdominates the power consumption and phase noise.
Tuning forks (TFs) are among the most common types of MEMS resonators and have been used widely in applications such as timing references,2,3inertial sensors,4,5pressure sensors,6,7and atomic force microscopy.8,9In these applications,TF resonators(TFRs) are used in symmetric in-plane flexura modes to reduce the impact of anchor loss,and their performance is crucial for the resonant sensing capabilities of sensing elements.Compared to electrostatic MEMS TFRs,piezoelectric ones generally have higherkteff2and smallerRmbut are more likely to suffer from the multimode effect,10which not only reducesQbut also leads to deteriorations inkteff2andRm.The closer the frequencies of the unwanted modes to that of the target mode or the stronger the resonances of the unwanted modes,the more significan the multimode effect.Among the few previous publications on suppressing the multimode effect in piezoelectric TFRs,Gilet al.demonstrated its existence,11Vigevaniet al.simulated the trends of the frequency difference between the unwanted and target modes by adjusting the anchor length,12and Liuet al.proposed a two-port actuation design for enhanced symmetric in-plane motion and decreased out-of-plane motion.13
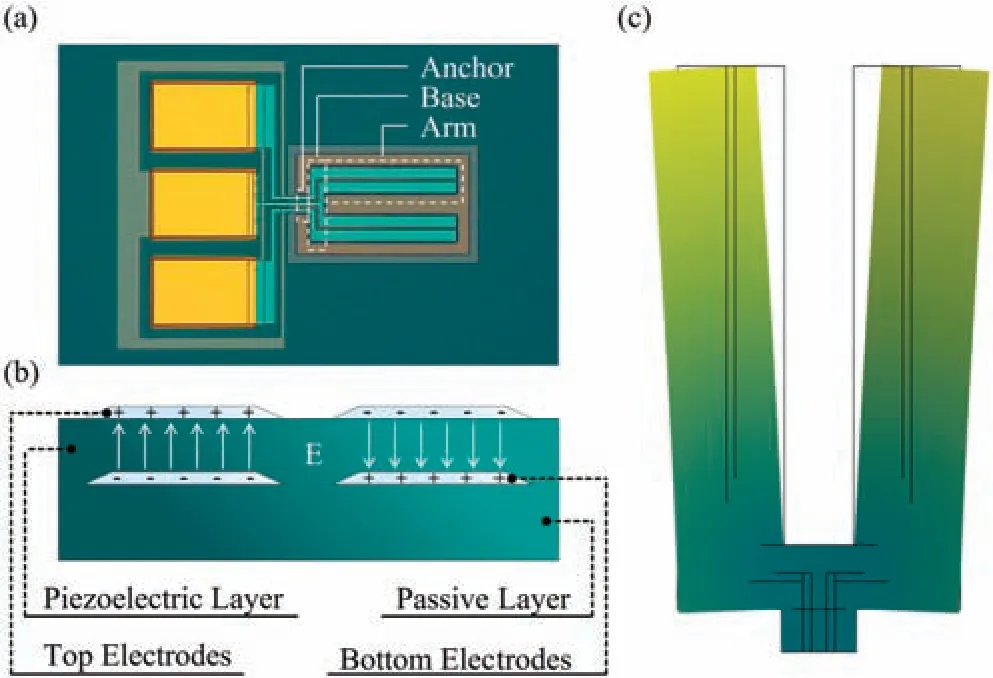
FIG.1. Images of (a) AlN-based tuning fork (TF) resonator (TFR),(b) crosssectional electric potential at arm mid-length,and (c) displacement profil of in-plane flexura mode.
Herein,we explore a new strategy for suppressing the multimode effect.By tuning the electrode pattern of a piezoelectric TFR vibrating in the in-plane flexura mode,comprehensive resonator performance improvement is achieved via effective multimode suppression.Devices with different electrode designs including electrode length,gap,and ratio are fabricated and tested,and their impacts onQandRmare analyzed,the aim being to propose a set of design guidelines for electrode patterns.By following those guidelines,the multimode effect is suppressed,and simultaneous improvement of the crucial resonator parametersQ,kteff2,andRmis achieved.The proposed design hasQ=7753,kteff2=0.066%,Rm=23.6 kΩ,and a value ofRp/Rs(ratio of impedance at parallel and series resonant frequencies) that is 86% higher than that of a reference design.
II.DESIGN
The structure of the proposed aluminum nitride (AlN)-based TFR device is shown in Fig.1(a).The device has three parts,i.e.,an anchor,a base,and two arms,with two pairs of stripe electrodes extending along each arm.As shown in Fig.1(b),one pair of electrodes lies on the top surface of the piezoelectric layer as top electrodes,and the other is located between the piezoelectric and passive layers as bottom electrodes.Each electrode is connected to either a signal or ground test pad to generate an electric fiel in thenormal direction in the piezoelectric layer,which induces strain in the arms in the width direction via thed31piezoelectric coefficient Under proper electrical actuation,the device vibrates in the in-plane flexura mode,as shown in Fig.1(c).Although the base alters the boundary conditions of the arms,for the dimensional dependence of the frequency of the in-plane flexura mode of the TF,that of a cantilever can be referenced,14i.e.,
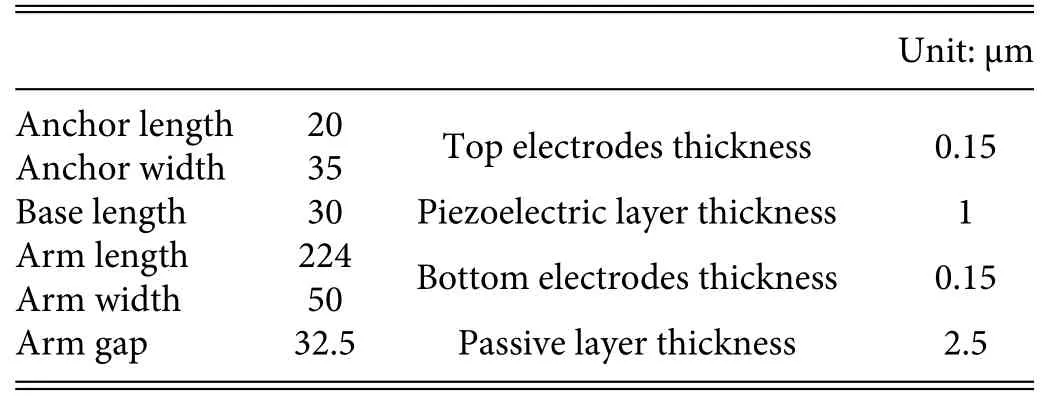
TABLE I.Key structural dimensions of TF devices.
whereωis the angular frequency of the cantilever,Eandρare the effective Young’s modulus and density of the material,respectively,andWandLare the cantilever width and length,respectively.
To investigate the effects of the electrode pattern,we designed several resonators with identical structural dimensions as listed in Table I but different electrode layouts as listed in Table II.For each resonator,only one of the electrode length,gap,and ratio was set as a variable,while the other two parameters remained constant at the values highlighted in green in Table II.The device with an electrode length of 222 μm,an electrode gap of 4 μm,and an electrode ratio of 1 is the basic device.In each resonator,the variables are applied to both the top and bottom electrodes,meaning that the bottom ones always have the same dimensions as those of the top ones.
With varying electrode length,the electrodes extend from the fixe ends of the arms toward the free ends for differing lengths,as shown in Fig.2(a);at the maximum electrode length of 222 μm,the electrodes cover almost the whole arms,as shown in Fig.1(a).With varying electrode gap,the inner and outer electrodes broaden from the inner and outer surfaces of the arms toward the middle,respectively,as shown in Fig.2(b).As the electrode ratio is increased from 0.125 to 8,the gap with a fixe width shifts from the outer boundarytoward the inner boundary,altering the width ratio of the outer to inner electrodes,as shown in Fig.2(c).
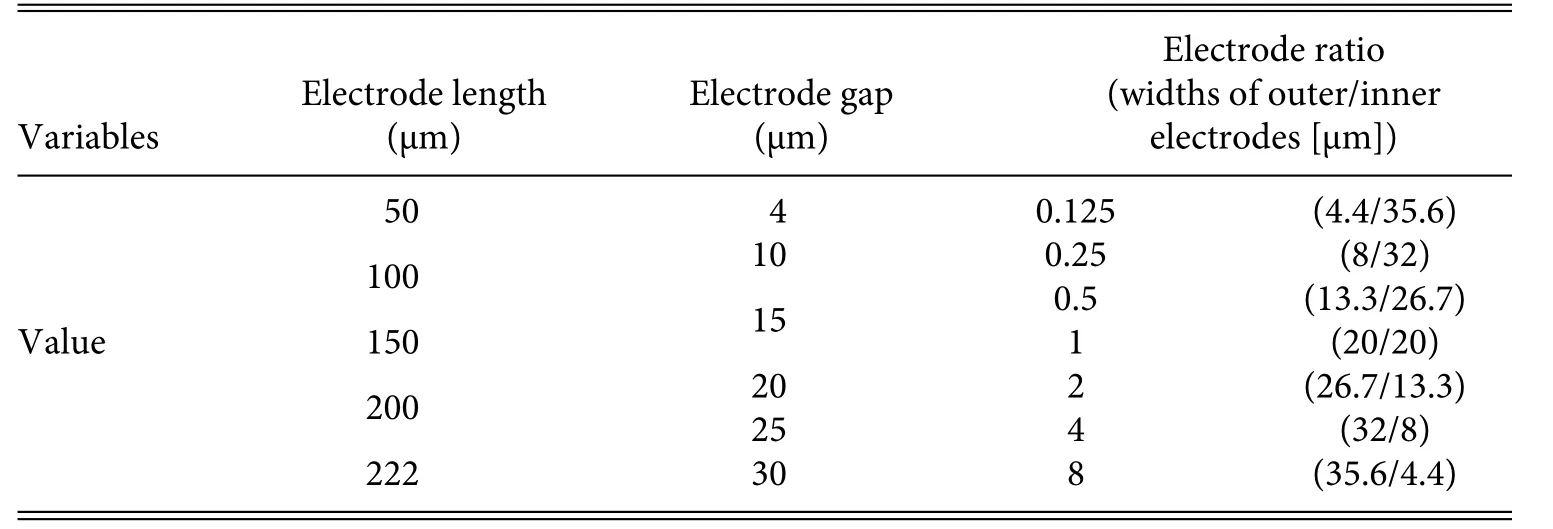
TABLE II.Three sets of electrode pattern variables.

FIG.2. Devices with (a) electrode length of 50 μm,(b) electrode gap of 25 μm,and(c)electrode ratio of 4.
III.FABRICATION AND TEST METHODS
To investigate experimentally how the performance of AlN-based TFRs depends on the electrode pattern,a complementary metal–oxide–semiconductor(CMOS)-compatible MEMS manufacturing process was used to fabricate AlN-based TF devices.The microfabrication process began with a high-resistivity silicon wafer.First,an air cavity was etched on the substrate,then phosphosilicate glass(PSG)was deposited as a sacrificia layer,and the surface was smoothed with chemical mechanical polarization[Fig.3(a)].A 2.5-μm-thick AlN passive layer and a 150-nm-thick molybdenum layer were deposited in sequence,and the Mo layer was patterned to form bottom electrodes [Fig.3(b)].Then,1-μm-thick AlN and another 150-nm-thick Mo layer were deposited sequentially to form the piezoelectric layer and top electrode layer[Fig.3(c)].Afterward,the top electrode layer was partly removed to defin the top electrode pattern [Fig.3(d)],and the piezoelectric layer was patterned to uncover the testing pads [Fig.3(e)].Next,the passive layer and piezoelectric layer were partly etched together to form the shape of the TF [Fig.3(f)].Finally,gold was sputtered and patterned to serve as electrical connections[Fig.3(g)],and the sacrificia layer was removed by hydrofluori acid to suspend the device[Fig.3(h)].
The electrical performance of the resonators was measured in a vacuum-chamber probe station at a pressure below 0.01 Pa.DC probes connected to an impedance analyzer(E4990A;Keysight Technologies) were used to test the resonators,and impedance parameters were extracted after open-short calibration.During the measurement,the OSC level of the impedance analyzer was set to 5 mV to avoid nonlinear behavior.Experimental data were collected for a total of 162 devices,and for each type of resonator with a certain electrode pattern,nine identical devices located on nine different chips from the same wafer were tested and analyzed to avoid effects from random individual variations.To analyze comprehensively the electrical performance of devices with different electrode patterns,in addition to the frequently used evaluation parametersfs,Q,andkteff2,we also derived and includedC0,Rp/Rs,andRsin the evaluation system,whereRp/Rsis a form of a figur of merit(FoM)define as15
IV.EXPERIMENTAL RESULTS
A.Basic device
The directly measured impedance curves—including magnitude and phase curves—of a fabricated basic device are shown in Fig.4(a).The basic device has a series resonant frequency (fs) of 795.96 kHz withkteff2=0.046%andRs=26.19 kΩ.The quality factor atfs(Qs)is calculated to be 6738 by the 3-dB method,andRp/Rsis calculated to be 6.56.The measured impedance curves are fitte with a modifie Butterworth–Van Dyke(mBVD)circuit model,as shown in the inset of Fig.4(a),which models the electrical behavior of a resonator near its resonance frequency.16The values of the equivalent circuit components were extracted by fittin the impedance predicted based on the equivalent circuit parameters to the measured impedance data,and the extracted parameters are listed in Table III.
The directly measured impedance includes not only the electrical response of the resonator itself but also that of the testing pads and connecting lines.17To estimate the parasitic impedance from the testing pads and connecting lines,de-embedding was carried out in the Advanced Design System 2014 software.The impedance curve and corresponding mBVD parameters after de-embedding are shown in Fig.4(b)and Table III.The value offsfor the de-embedded impedance is still 795.96 kHz,withkteff2=0.058%,Rs=28.85 kΩ,Qs=7903.69,andRp/Rs=14.79.Comparing the parameters before and after de-embedding indicates the quite notable impact of the testing pads and connecting lines.However,because all the devicesin this work share the same testing pads and connecting lines,which therefore do not impact the performance comparison among devices with different electrode designs,the directly measured data are adopted in the following sections.
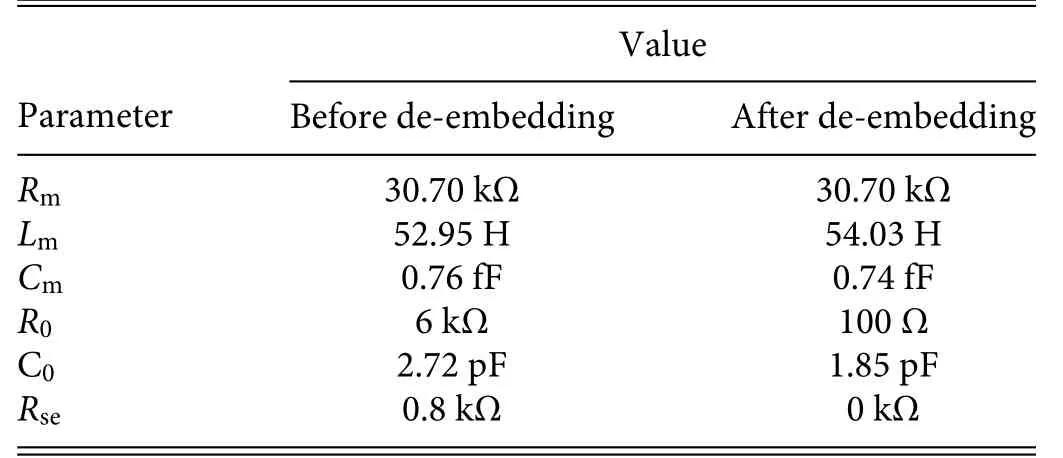
TABLE III.Parameters extracted from mBVD model.
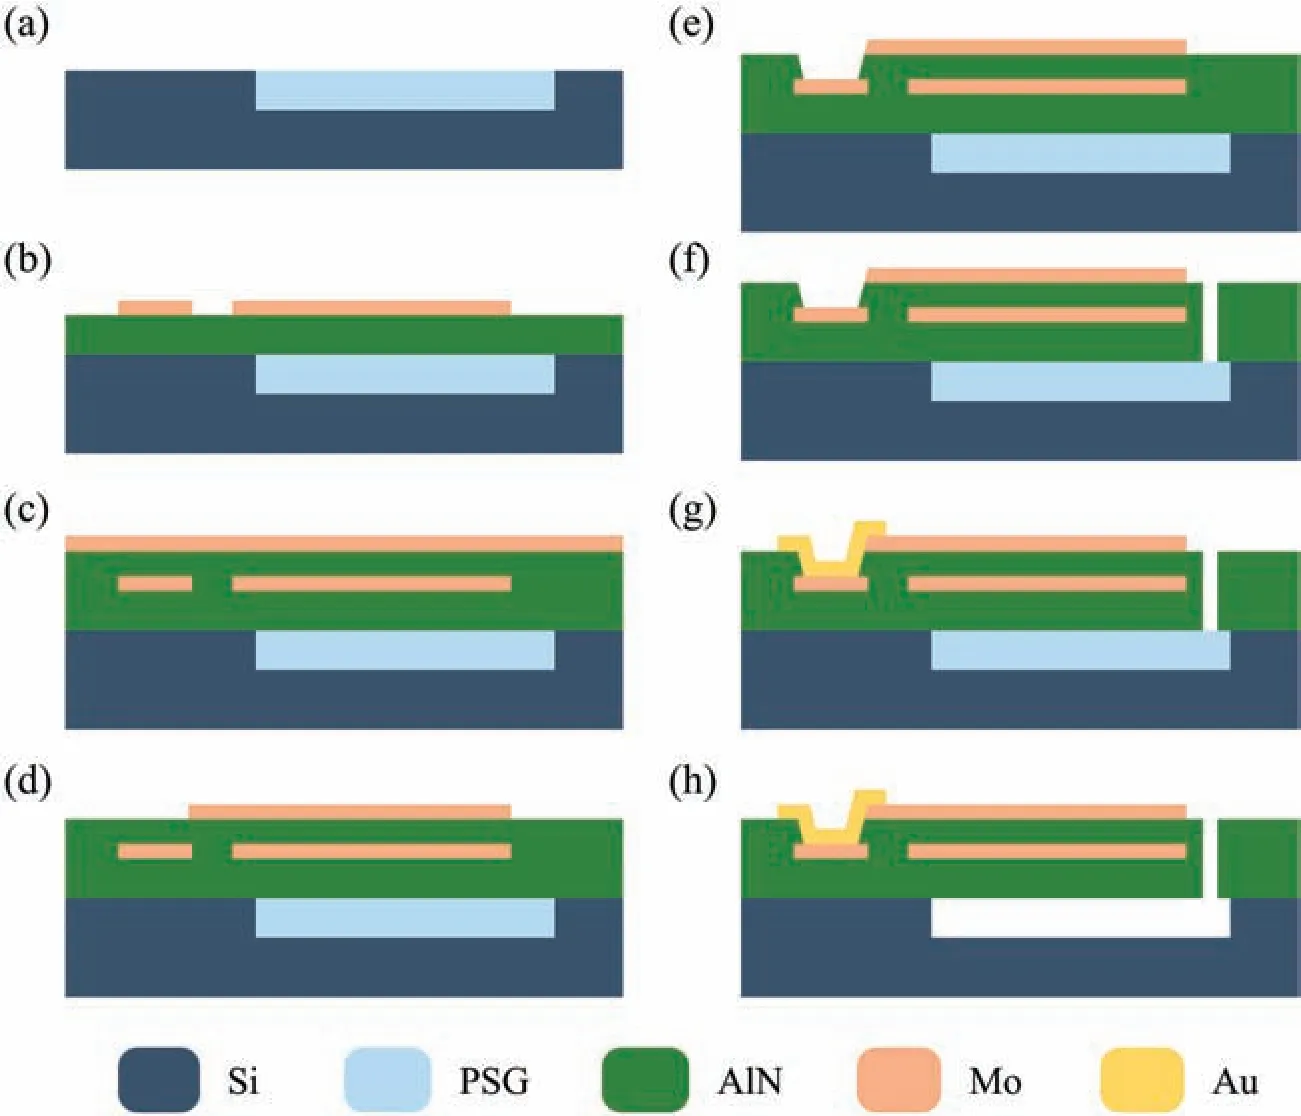
FIG.3.Key steps of microfabrication process of AlN-based TF.
The value ofRmextracted from the impedance both before and after de-embedding is 30.70 kΩ,which is the main source ofRs.Thus,Rsis often used as a substitute forRmbecause it can be read directly from the impedance curve.
B.Electrode length
Figure 5 shows the parameters derived from the measured electrical impedance as functions of the electrode length.The quality factor atfsincreases as the electrode coverage in terms of length increases from 23% to 45% (50 μm to 100 μm),reaching a maximum value of 7752.As the electrode length is extended further,Qsstarts to decrease until it reaches 6424 when the electrode edge reaches the boundary of the arms.Qsis improved by 21% by an appropriate electrode length design compared to the basic device.kteff2shares the same trends asQs.The maximum value ofkteff2of 0.066%arises under the same condition that the electrodes cover 45%of the whole arms(corresponding to 100 μm).As the electrode coverage is increased to 1,kteff2decays to 0.047%,which is only 71%of the maximum value.As the electrode length is increased,fspresents a declining trend in general.More specificallyfsat an electrode length coverage ratio of 45% (100 μm) is slightly larger than that at 23% (50 μm),and as the electrodes are lengthened further,fsdecreases from 847 kHz to 794 kHz.Finally,when the electrode length is increased,C0grows linearly.
The effect ofQscombines with that ofkteff2,resulting in anRp/Rspeak at a 45% electrode length coverage ratio (100 μm),and the improvement inRp/Rscaused by reducing the electrode length coverage ratio from 100%to 45%(100 μm)is greater than 85%.As the combined result offs,C0,kteff2,andQs,as the electrode length increases,Rsdecreases rapidly by 33% from 34 kΩ to 22 kΩ and then increases to 26 kΩ,and the minimum value appears when the electrodes cover 67%(150 μm)of the arms.
C.Electrode gap
Figure 6 shows the measured electrical parameters of devices with different electrode gaps.On the whole,Qsincreases and then decreases with increasing electrode gap.As the electrode gap is increased from 4 μm to 20 μm,Qsincreases significantl with a gradually decreasing growth rate.The maximumQsis achieved when the electrode gap is 20 μm,corresponding to an electrode coverage ratio of 55%in width.When the electrode gap exceeds 20 μm,Qsbegins to decrease with an increased rate,reaching 5925 when the electrode gap reaches 30 μm.kteff2shows a similar trend.As the electrode gap is increased from 4 μm to 10 μm,kteff2increases rapidly by 13%,and as the electrode gap is increased further to 25 μm,kteff2fluctu ates between 0.053%and 0.054%.Then,kteff2begins to decrease as the electrode gap is increased further to 35 μm,which corresponds to a single-electrode width of only 7 μm.Under this condition,the electrode coverage ratio in width is too low to induce significan electromechanical coupling.fsgrows approximately linearly as the electrode gap is increased,whereasC0decreases.

FIG.4.(a)Directly measured and(b)de-embedded impedance curves and modifie Butterworth–Van Dyke(mBVD)model fittin of a basic resonator.
BecauseQsandkteff2exhibit similar tendencies,the end result is thatRp/Rsalso increases and then decreases with increasing electrode gap.The peak value ofRp/Rs=8.1 appears at an electrode gap of 20 μm,and the growth rate in reaching that peak is greater than that for eitherQsorkteff2.As the electrode gap is increased from 4 μm to 15 μm,Rsdecreases slightly from 26.4 kΩ to 24.8 kΩ,and with further increase of the electrode gap,Rsincreases rapidly to 37 kΩ at an electrode gap of 30 μm.
D.Electrode ratio
Figure 7 shows the relationships between the measured electrical parameters and the electrode ratio.Overall,a larger electrode ratio gives a higherQs.When the electrode ratio is 1/8 or 1/4,Qsis too low to be derived by the 3-dB method,which is why the corresponding points are missing.When the electrode ratio is 1/2(i.e.,the width of the outer electrodes is only half that of the inner electrodes),Qsis reduced by 24%compared to that of devices with equal-width electrodes.When the electrode ratio exceeds 1,the outer electrodes are wider than the inner ones,and a conspicuous increase inQscan be observed.Qsreaches its maximum value of 6995 when the electrode ratio is 2,after which it decreases.The curve ofkteff2seems to have 180○rotational symmetry about the point corresponding to an electrode ratio of 1.As a whole,wider outer electrodes increasekteff2,while narrower ones decreasekteff2.The maximumkteff2of 0.054%is realized when the electrode ratio is 4.ForfsandC0,as the electrode ratio is increased,these two parameters basically remain unchanged,with volatility in small ranges;the fluctuation infsandC0are within only 0.66%and 0.76%,respectively.
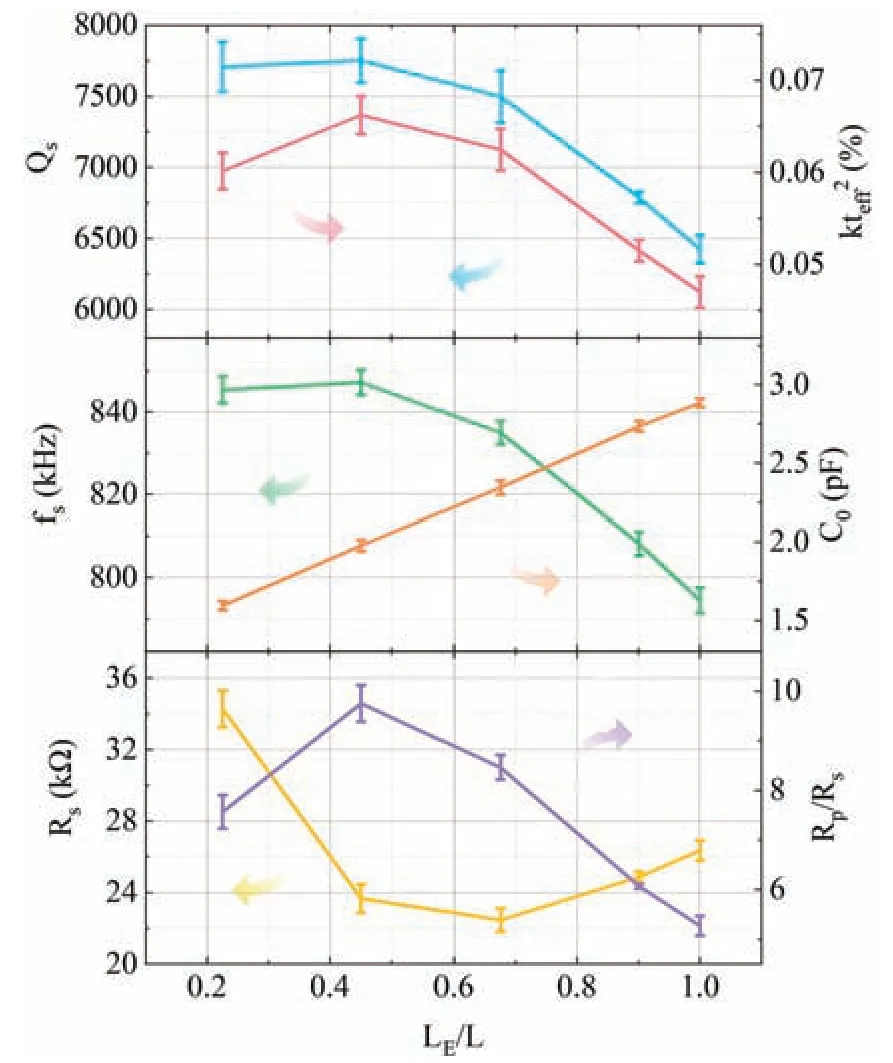
FIG.5.Measured electrical parameters of devices with different electrode lengths.
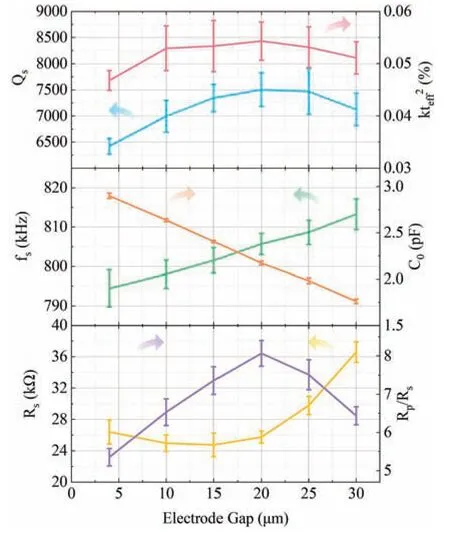
FIG.6.Measured electrical parameters of devices with different electrode gaps.
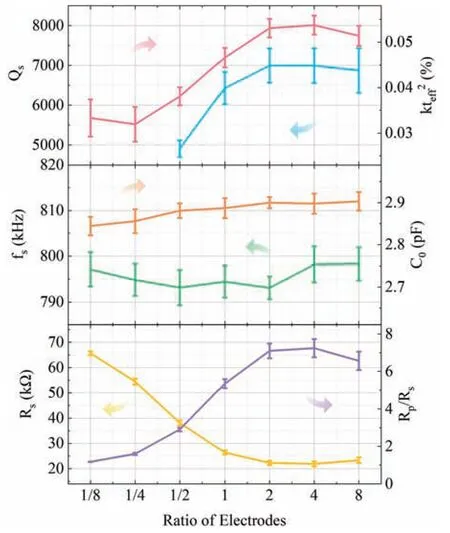
FIG.7.Measured electrical parameters of devices with different electrode ratios.
When the width of the outer electrodes is one-eighth of that of the inner electrodes,Rp/Rsis only 1.2,meaning that the impedance curve around the resonant frequency is quite flat which is why the correspondingQscannot be derived by the 3-dB method.The very small values of bothRp/RsandQsindicate rather weak resonance under such an actuation.As the electrode ratio is increased from 1/8 to 4,Rp/Rsincreases remarkably by a factor of 6.1,reaching 7.2 when the electrode ratio is 4.Then,as the electrode ratio is increased further,Rp/Rsdecreases to 6.57.Generally,increasing the electrode ratio reducesRs.As the electrode ratio is increased from 1/8 to 4,Rsdecreases by 67%,and the minimum value ofRs=22 kΩ is achieved when the electrode ratio is 4.Comparing the results suggests that low-electrode-ratio patterns degrade the performance more than high-electrode-ratio patterns improve it.
V.DISCUSSION
The total quality factor of a single resonance mode of a resonator is define as
whereQiis the quality factor related to a particular loss mechanism.The most common energy loss mechanisms are air damping,18anchor loss,19and thermoelastic damping(TED).20
A.Air damping and anchor loss
Air damping is among the best-known energy loss mechanisms,especially for resonators working at low and medium frequencies.As described in Sec.III,all the devices were tested under a pressure below 0.01 Pa,and this vacuum condition ensures that air damping can be ignored,as demonstrated in our previous work.17
Anchor loss occurs when part of the elastic energy stored in a structure is transmitted through an anchor into the surrounding substrate during resonant microstructure vibration.In Ref.21,the quality factorQanchorrelated to the anchor loss of a similar doubleended TFR working in the in-plane flexura mode was measured as being ∼9 × 10⁵.This large value ofQanchoris two orders of magnitude larger than the total quality factor measured in the present work,so the role of anchor loss in changing the quality factor is also negligible.
B.Thermoelastic damping
TED is an intrinsic energy loss mechanism induced by the coupling of strain gradients and temperature gradients.When the resonator is vibrating,a compressed region with a positive coeffi cient of thermal expansion undergoes a temperature increase,while a stretched region undergoes a temperature decrease.This temperature difference causes heat flo from warmer to cooler regions,and thus elastic energy is dissipated irreversibly as heat.
To simulate theQTEDof devices with different electrode patterns,we performed a finite-elemen analysis.The simulated temperature distribution is shown in Fig.8(a),where yellow represents hotter and red represents cooler,and the temperature fiel is obviously coincident with the strain field The simulatedQTEDvalues for devices with different electrode lengths,gaps,and ratios are shown in Figs.8(b)–8(d),respectively.The simulatedQTEDis larger than but of the same order of magnitude as the measured totalQ,according to Eq.(3),which shows that TED indeed contributes strongly to the overall energy dissipation.Nevertheless,although the values of the simulatedQTEDvary with the different patterns,the variances are quite limited;with increasing electrode length,gap,and ratio,the fluctuation are no more than 1.9%,and 0.4%,respectively,which are significantl less than those of the measured values.Also,the tendencies of the simulated data are inconsistent with those of the measured data.These disagreements in both the variation range and tendency between the simulated and measured quality factors reveal that TED is not the major contributor to the variation in the measuredQ.
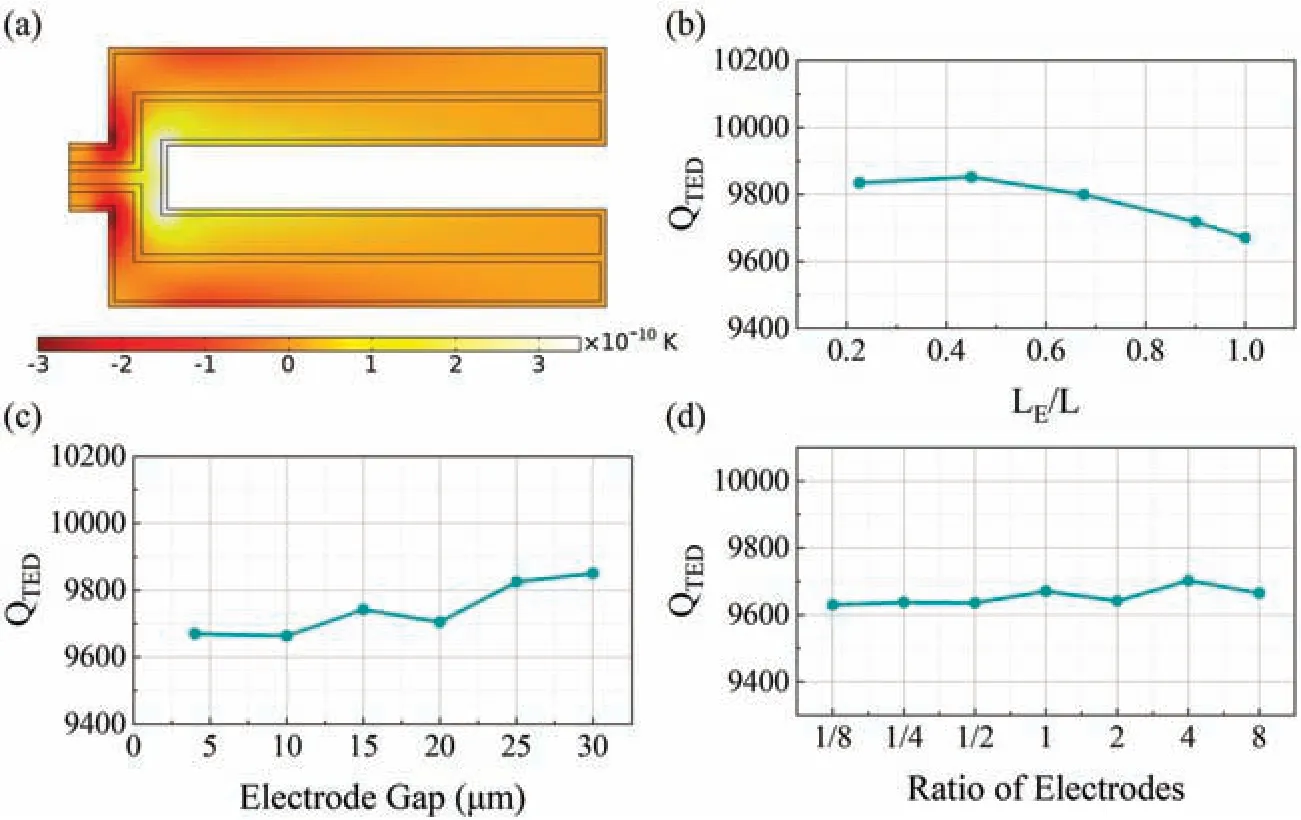
FIG.8.(a)Temperature distribution of basic device at resonance.(b)–(d)Simulated QTED of resonators with different electrode lengths,gaps,and ratios.
C.Multimode effect
The correlation between quality factor and electrode pattern is considered to be related to the multimode effect,which is an energy loss mechanism related to the interaction of adjacent resonance modes.10
In this work,both the structure and electrode pattern are designed to stimulate the in-plane flexura mode,but in practice other unwanted resonance modes may also be excited.If an adjacent mode has a frequency close to the target resonance,then the energy of the target mode will be consumed,leading to target resonance attenuation.13Moreover,if the frequency of a spurious mode approaches that of the target mode or if the resonance of the spurious mode strengthens,then the multimode effect will be more significant
For the in-plane flexura mode investigated here,the nearest resonance mode is the torsional mode,22as shown in Fig.9.The frequencies and resonance strengths of devices with different electrode designs are compared in Fig.10,whereRp/Rsis used to evaluate the resonance strength.As shown in Fig.10(a),with increasing electrode length,the frequencies of both the flexura and torsional modes decrease,but their difference is almost unchanged.However,the trend in Fig.10(b) is obviously the opposite: as the electrode coverage in terms of length is decreased from 100%to 45%,the resonance of the torsional mode decays gradually,leading to a resonance enhancement of the flexura mode.As the electrode coverage in terms of length is decreased further from 45%to 23%,although the resonance strength of the torsional mode continues to decrease,the electrodes are now too short to offer adequate actuation,resulting in a decrease inRp/Rsof the flexura mode.
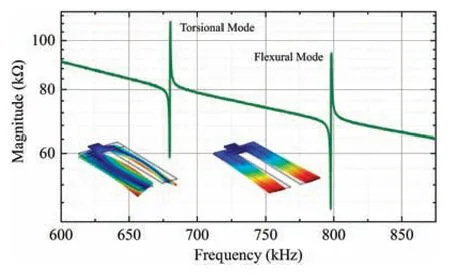
FIG.9.Measured magnitude curve including resonances of torsional and flexura modes.
The situation for the resonators with different electrode gaps is similar,with the frequency difference remaining basically unchanged with increasing electrode gap.As the electrode gap is increased from 4 μm to 20 μm,the resonance of the torsional mode weakens,thereby suppressing the multimode effect and strengthening the resonance of the flexura mode.With an electrode gap of 25 μm or 30 μm,the electrode coverage in terms of width of a single electrode is less than 20%,and both the torsional and flexura modes are weakened as a result of a weak driving force.
For the resonators with different electrode ratios,the frequencies of both the flexura and torsional modes remain virtually unchanged as the electrode ratio is varied,and the two curves for the resonance strength intersect.As the electrode ratio is decreased from 1,the torsional mode strengthens gradually,as does the multimode effect,whereas the trend for the strength of the in-plane flexura mode is downward.In contrast,Rp/Rsof the torsional mode decreases as the electrode ratio is increased from 1,thereby strengthening the flexura mode.When the electrode ratio is 1/8 or 8,the wider electrode almost covers the whole arm,so it is difficul to drive the resonator to vibrate in both the flexura and torsional modes.
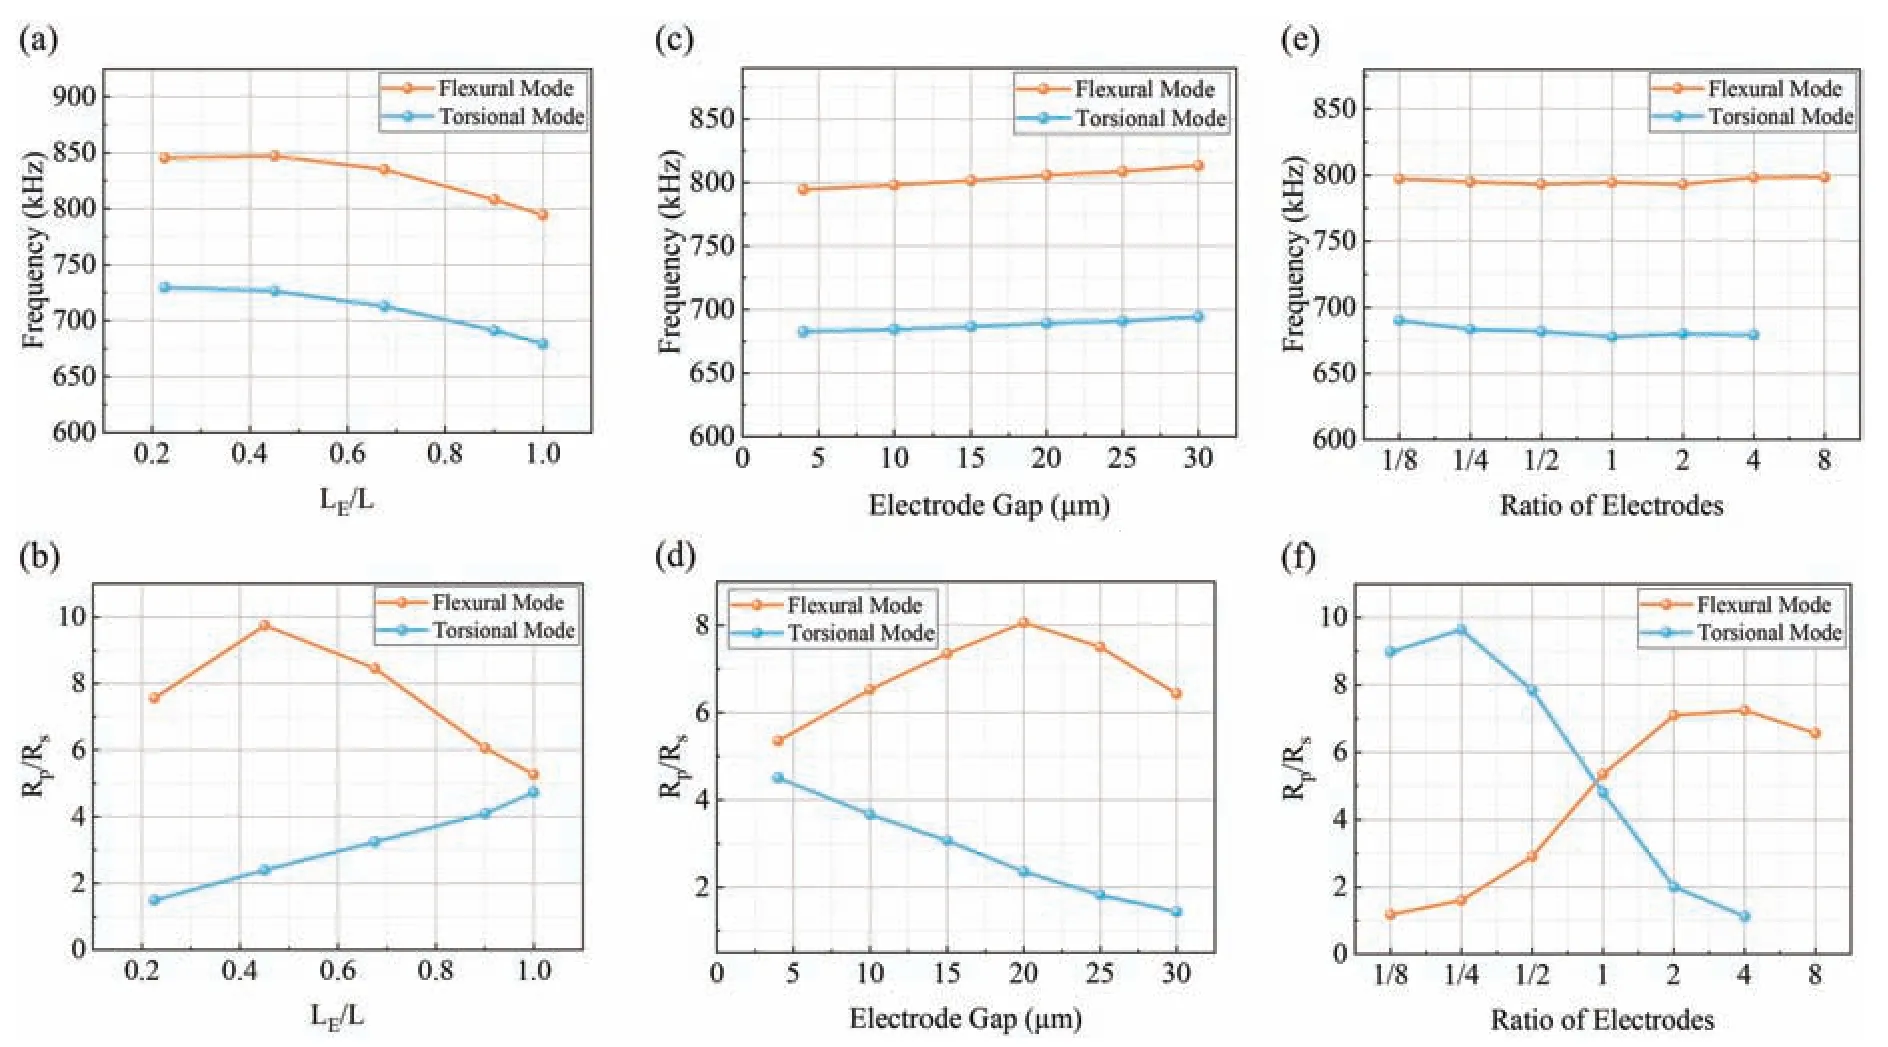
FIG.10.Resonant frequencies and Rp/Rs of flexura and torsional modes of resonators with different(a),(b)electrode ratios,(c),(d)electrode lengths,and(e),(f)electrode gaps.
Because the effective electromechanical coupling coefficien is define as the ratio of mechanical energy and electrical energy,as the energy loss mechanism of the resonators is suppressed,so the restored mechanical energy increases,leading to the rise inkteff2.That is why the trend ofkteff2is always similar to that ofQ,and as a product ofQandkteff2,the performance of the resonator vibrating in the in-plane flexura mode shares a similar trend.
In general,resonators are used in a specifi application,such as a filte with a given pass band23or an energy harvester working at a low frequency.24Therefore,the frequency is an important characteristic that requires particular attention during the resonator design process.As shown in Figs.5 and 6,as the electrode coverage is decreased,although the performance is optimized,the frequency increases because of the mass loading effect,and so steps must be taken to maintain the frequency.For the TFRs investigated herein,adjusting the arm length is one of the most efficien methods,as presented in Eq.(1).Here,we take the set of resonators with different electrode lengths as an example.If we set the resonator with fully covered electrodes as a reference,then the maximum frequency change induced by varying the electrode coverage in terms of length is 6.4%,which can be calibrated by lengthening the arms by only 3.7%.This limited extension of the arms has no impact on the anchor loss or TED in principle and has a negligible influenc on the multimode effect.
Table IV compares the performances of the present resonators with those of other one-port piezoelectric TFRs working in thein-plane flexura mode reported recently elsewhere.As can be seen,with proper electrode design,we have achieved the joint-lowestRmand highf×Qand FoM;f×Qis considered an upper limit of the FoM due to material-limited intrinsic dissipation mechanisms,28and the FoM is the product ofQandkteff2.Moreover,the performance could be enhanced further by synergizing these three electrode designs and via proper structural design.
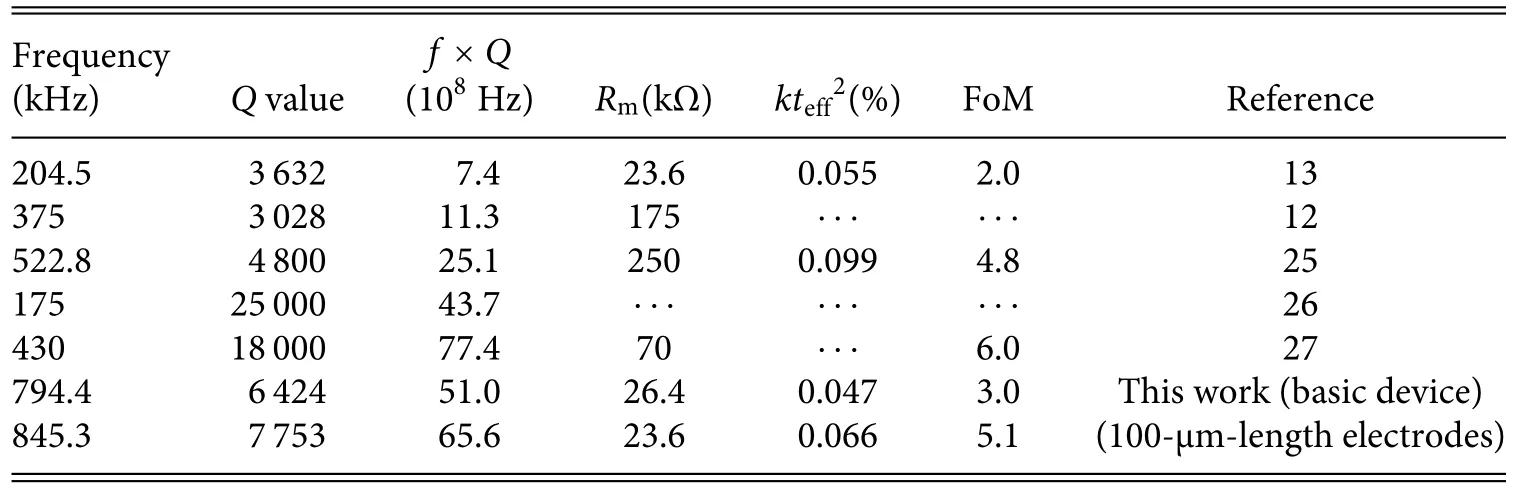
TABLE IV.Performance comparison with reported in-plane flexural-mod piezoelectric TFRs.
In summary,by accounting jointly forQ,kteff2,Rp/Rs,andRm,we offer the following advice on electrode design for better performance of piezoelectric TFRs: a range of electrode coverage in terms of length of 40% to 80%,a range of electrode coverage in terms of width of 40% to 65%,and a range of electrode ratios of 3 to 6 are conducive to obtaining better-performing piezoelectric TFRs.
VI.CONCLUSIONS
In this work,the effects of electrode design on the performance of AlN TFRs vibrating in the in-plane flexura mode were investigated.Resonators with different electrode coverages in terms of length and width and electrode ratios were designed,fabricated,and tested,and the analysis indicated that the multimode effect influ ences performance strongly but fortunately can be suppressed via optimized electrode design.In terms ofRp/Rs,properly designed electrode length,gap,and ratio can increase its value by 86%,54%,and 36%,respectively,which provides some guidelines for designing AlN-based TFRs for high performance the in-plane flexura mode.TF resonators with outstanding performance would fin applications in sensing field such as in gyroscopes,accelerometers,and pressure sensors,and the enhanced performance in terms ofQ,Rm,andkteff2(for example)will contribute to high signal-to-noise ratio,great sensitivity,and low power consumption in such application scenarios.
ACKNOWLEDGMENTS
This work was supported in part by the National Key Research and Development Program of China(Grant No.2020YFB2008800)and the Nanchang Institute for Microtechnology of Tianjin University.The authors thank engineers Quanning Li,Xuejiao Chen,Chen Sun,and Wenlan Guo of the M/NEMS laboratory at Tianjin University for their help in fabricating our devices.
AUTHOR DECLARATIONS
Conflict of Interest
The authors have no conflict to disclose.
DATA AVAILABILITY
The data that support the finding of this study are available within the article.
杂志排行

纳米技术与精密工程的其它文章
- Stress distribution variations during nanoindentation failure of hard coatings on silicon substrates
- Effects of simulated zero gravity on adhesion,cell structure,proliferation,and growth behavior,in glioblastoma multiforme
- Design and analysis of longitudinal–flexuralhybrid transducer for ultrasonic peen forming
- An advanced cost-efficient IoT method for stroke rehabilitation using smart gloves
- Electrical characterization of an individual nanowire using flexible nanoprobes fabricated by atomic force microscopy-based manipulation
- An image mosaic technique with non-overlapping regions based on microscopic vision in precision assembly