The corrosion characteristics and mechanism of directionally solidified Mg-3Zn-xCa alloys
2023-12-27YiZhngXiohuiFengQiuynHungYingjuLiXuehuiHoChngzhengWngYunshengYng
Yi Zhng ,Xiohui Feng ,Qiuyn Hung ,Yingju Li ,Xuehui Ho ,Chngzheng Wng ,Yunsheng Yng,,∗
a Institute of Metal Research, Chinese Academy of Sciences, wenhua road 72, Shenyang 110016, China
b School of Materials Science and Engineering, University of Science and Technology of China, Shenyang 110016, China
cSchool of Materials Science and Engineering, Liaocheng University, Liaocheng 252000, China
Abstract An investigation into the corrosion characteristics and mechanism of directionally solidified (DSed) Mg-3Zn-xCa (x=0,0.2,0.5,0.8 wt.%) alloys in 0.9 wt.% NaCl solution is presented.The DSed microstructure consists of columnar dendrites and eutectics distributed in the interdendritic region.The primary dendritic arm spacing (PDAS) and the volume fraction (fv) of the secondary phases are under the significant impact of the content of Ca.The corrosion rates evaluated using electrochemical measurements and immersion tests are accelerated monotonously with the increase of Ca content in DSed alloys.The corrosion resistance of the DSed alloys is significantly affected by the corrosion products film (CPF) and the secondary phases.The corrosion products of DSed Mg-3Zn alloy contain Mg(OH)2 and ZnO.The existence of ZnO greatly enhances the corrosion resistance of DSed Mg-3Zn alloy.As for the DSed alloys containing Ca content,a relatively protective CPF without deep pits can form on the surface of DSed Mg-3Zn-0.2Ca specimen during the corrosion.The fv of the secondary phases dominates the corrosion rate of the DSed Mg-Zn-Ca alloys.The corrosion of DSed Mg-3Zn-xCa alloys initiates as a result of microgalvanic coupling between the cathodes of secondary phases and α-Mg matrix anode.Then,the corrosion gradually extends longitudinally with the breakdown of CPF.
Keywords: Mg-Zn-Ca alloy;Directional solidification;Electrochemical characterization;Corrosion mechanism.
1.Introduction
Biodegradable Mg alloys have attracted great attention in recent years,and their application is a considerable benefit for both patients and the public health care system.At present,opportunities for biodegradable Mg alloys have resulted in intense research activity [1–3].Horky et al.[4] prepared Mg-0.6Zn-0.5Ca (wt.%) alloy by double equal channel angular pressing (D-ECAP).They found that the ultimate tensile strength of the alloy can reach 370 MPa with elongation of 7%.The D-ECAP Mg-Zn-Ca alloy exhibits favorable combination properties.Cihova et al.[5] investigated the degradation properties of Mg-Zn-Ca alloys in vivo,and they reported that the experimental Ma-Zn-Ca alloys can well integrate with direct bone-implant contact,exhibiting good biocompatibility.In fact,Zn is crucial for human health as an essential element and beneficial to strengthen the mechanical properties and lower the dissolution rates of Mg alloys [6,7].Meanwhile,Ca can facilitate bone healing and enhance the mechanical properties of Mg alloys [8,9].Therefore,Mg-Zn-Ca alloys are expected to be promising candidates for biodegradable materials due to their excellent properties.
In recent studies,many Mg-Zn-Ca alloys with different content have been developed,of which the corrosion properties have been extensively explored.Zhang et al.[10] prepared as-cast Mg-xZn-1Ca (1 wt.% ≤x≤6 wt.%)alloys and investigated the mechanical and corrosion properties of the alloys.The results showed that the yield strength,ultimate tensile strength,and ductility of the alloys were increased at first and then decreased with the increase of Zn content.The increasing Zn content in the alloy would lead to bad corrosion resistance in Hank’s solution.Among these alloys,Mg-3Zn-1Ca alloy exhibits the best combination properties with ultimate tensile strength,elongation,and corrosion rate of 160 MPa,8.3%,and 2.92 mm/a,respectively.Li et al.[11] reported that the mechanical properties improved at first and then decreased with the increase of Ca content in Mg-2Zn-xCa alloy (0 wt.% ≤x≤0.8 wt.%).Besides,the corrosion rate of the alloys in Hank’s solution monotonously increased with the Ca content increased.Actually,previous studies have determined that alloys with percentages of Ca and Zn less than 4 wt% and 1 wt%,respectively,exhibit good combination properties [12–14].Therefore,Mg-3ZnxCa (x≤0.8 wt.%) alloys are selected for this research.Additionally,it is worth noting that most of Mg-Zn-Ca alloys investigated now are fabricated by casting,rolling and extrusion,etc.,and their grains are equiaxed [15–17].Little attention has been paid to the alloys with columnar structure,and few systematic studies have been made on the factors affecting the corrosion rate of the alloys with columnar structure.
Actually,only specific solidification methods are available for the preparation of the alloy with columnar structure.Recent works have shown that columnar-structured Mg alloys with preferred growth orientations can be obtained by directional solidification[18–20].In these years,the microstructure evolution,microsegregation,growth orientation,and mechanical properties of various Mg alloys,including Mg-Gd,Mg-Al,and Mg-Zn,etc.,have been widely studied [21–26].Yang et al.[27] studied the microstructure evolution and growth orientation of directionally solidified (DSed) Mg-14.61Gd alloy and found that the growth orientation ofα-Mg changed from 〈112(-)0〉 and 〈101(-)0〉 to 〈112(-)0〉.They reported that the heat flux and the anisotropy of the crystal are the dominant factors controlling the growth direction of dendrites.Zhang et al.[28] investigated the microstructure evolution and microsegregation of DSed Mg-4Al alloys with different growth rates.The microstructure of DSed Mg-4Al alloy evolved from cellular to dendritic with the increase of growth rate,and the microsegregation can be described as Scheil model.However,the corrosion properties of the DSed Mg alloys designed for biodegradable materials haven’t received sufficient attention until now.
Hence,this work is intended to investigate the corrosion characteristics and mechanism of DSed Mg-3Zn-xCa (x=0,0.2,0.5,0.8 wt.%) alloys,and account for the effect of Ca on the microstructure and corrosion resistance of the DSed alloys.Besides,the factors affecting the corrosion resistance of DSed alloy were discussed.
2.Material and methods
2.1.Materials preparation
Pure Mg,pure Zn,and Mg-25 wt.%Ca master alloy were used to prepare Mg-3Zn-xCa (x=0,0.2,0.5,0.8 wt.%) alloys.First,the alloys were melted in an electric resistance furnace at 720 °C under a protective atmosphere of CO2-SF6.Then,the melt was poured into a 350 °C graphite mold with a dimension ofϕ60 mm × 140 mm and cast into ingots.The ingots were cut intoϕ6.6 mm × 140 mm cylindrical bars for directional solidification.The bars were put into an alumina crucible and loaded into a directional solidification setup[29,30] and heated to 900 °C to remelt under the protection of Ar.Subsequently,the crucible was moved downward at a speed of 120 μm/s with a temperature gradient of 13 °C/mm.Samples for microstructure characterization were obtained by quenching the crucibles rapidly into the water after directional solidification for 500 s.
2.2.Microstructure characterization
The microstructures were characterized by SEM (FEI INSPECT F50) and TEM (Tecnai F30) equipped with energy dispersive X-ray spectrometry(EDS).Cuboids were cut below the quenched solid/liquid interface for SEM.The longitudinal sections for SEM observation were etched by 1 wt.% oxalic acid solution after grinding and polishing.The foils for TEM observation were taken from the cross-section of the DSed samples,which were ion beam milled in a precision ion polishing system (Leica RES101).
A Bruker scanning Kelvin probe force microscope(SKPFM) was utilized to judge the differences of relative Volta potential between the secondary phases andα-Mg matrix.The specimens were mechanically polished and ultrasonically cleaned with ethanol.Then the specimen was electrochemical polished in a solution of perchloric acid and ethanol at -30 °C under 12 V.The corrosion morphology was analyzed by laser profilometry (Zeiss LSM700) with the height difference measured.
2.3.Electrochemical measurements and immersion tests
A standard three-electrode cell electrochemical workstation with a saturated calomel electrode as the reference electrode(PARSTAT4000) was used to investigate the electrochemical characteristics of the alloys in 0.9 wt.% NaCl solution.Specimens for electrochemical measurements were cut in the longitudinal direction and mounted with epoxy resin with a rectangular area of 0.7 cm2left for each sample.The specimens were ground with SiC papers up to 2000 grit and ultrasonically cleaned in absolute ethyl alcohol before the test.To avoid the perturbation of the heater and obtain precise experimental data,especially the EIS,the electrochemical measurement was carried out at room temperature.After the specimen was immersed in NaCl solution for 1 h reaching the steadystate of the open circuit potential (OCP),potentiodynamic polarization curves and electrochemical impedance spectroscopy(EIS) were used to start recording.The EIS was set from 100 kHz to 10 mHz with a magnitude of 10 mV around the OCP,and presented as Nyquist plots.More than three samples were tested for each alloy,and the most representative plots were presented in this paper.By using the Tafel extrapolation method,the corrosion current density (icorr,mA/cm2)was obtained using the cathodic branch of the polarization curve.The corrosion rate (Pi,mm/a) was calculated using the Formula (2) as follows [31]:
For the immersion tests,the specimens with dimensions of 10 mm × 6 mm × 3 mm were cut from the DSed samples.After grinding,cleaning,and weighing,the specimens were immersed in 220 ml of 0.9 wt.% NaCl solution at 37 °C for 48 h with the hydrogen evolution and weight loss recorded.Corrosion morphology after immersion was observed by SEM.Then,the specimens were taken out and treated by ultrasonic cleaning for 3 to 5 min in a solution(consisting of 200 g CrO3,10 g AgNO3,and 1000 ml distilled water) to remove the corrosion products,which were then washed and dried.The specimens before and after immersion without corrosion products were weighted by an electronic balance (Sartorius CPA225D) with a precision of 0.01 mg.The average value was taken from more than three measurements for each sample.Based on the hydrogen evolution,a corrosion rate (CRHE,mm/a) was obtained by Formula(3) [32]:
The corrosion rate based on weight loss(CRWL,mm/a)was calculated by Formula (4) [31]:
whereΔVH2(ml) is the volume of the hydrogen during the immersion test,ΔMm(g) is the weight loss after the immersion test,Sm(cm2)is the exposed area of the specimen,Tm(h)is the total immersion time of the specimen,andρm(g/cm3)is the density of the specimen.
To explore the corrosion mechanism,the corrosion morphologies were observed after the immersion tests for different time.Corrosion products were analyzed by XRD (Philips PW170X) and performed with Cu Kαradiation at 40 mA and 40 kV.The chemical composition of the corrosion product formed in 0.9 wt.% NaCl solution for 2 h was analyzed by X-ray photoelectron spectroscopy (XPS,ESCALAB 250).The XPS data was analyzed using Xpspeak 4.1 software.
3.Results
3.1.DSed microstructures
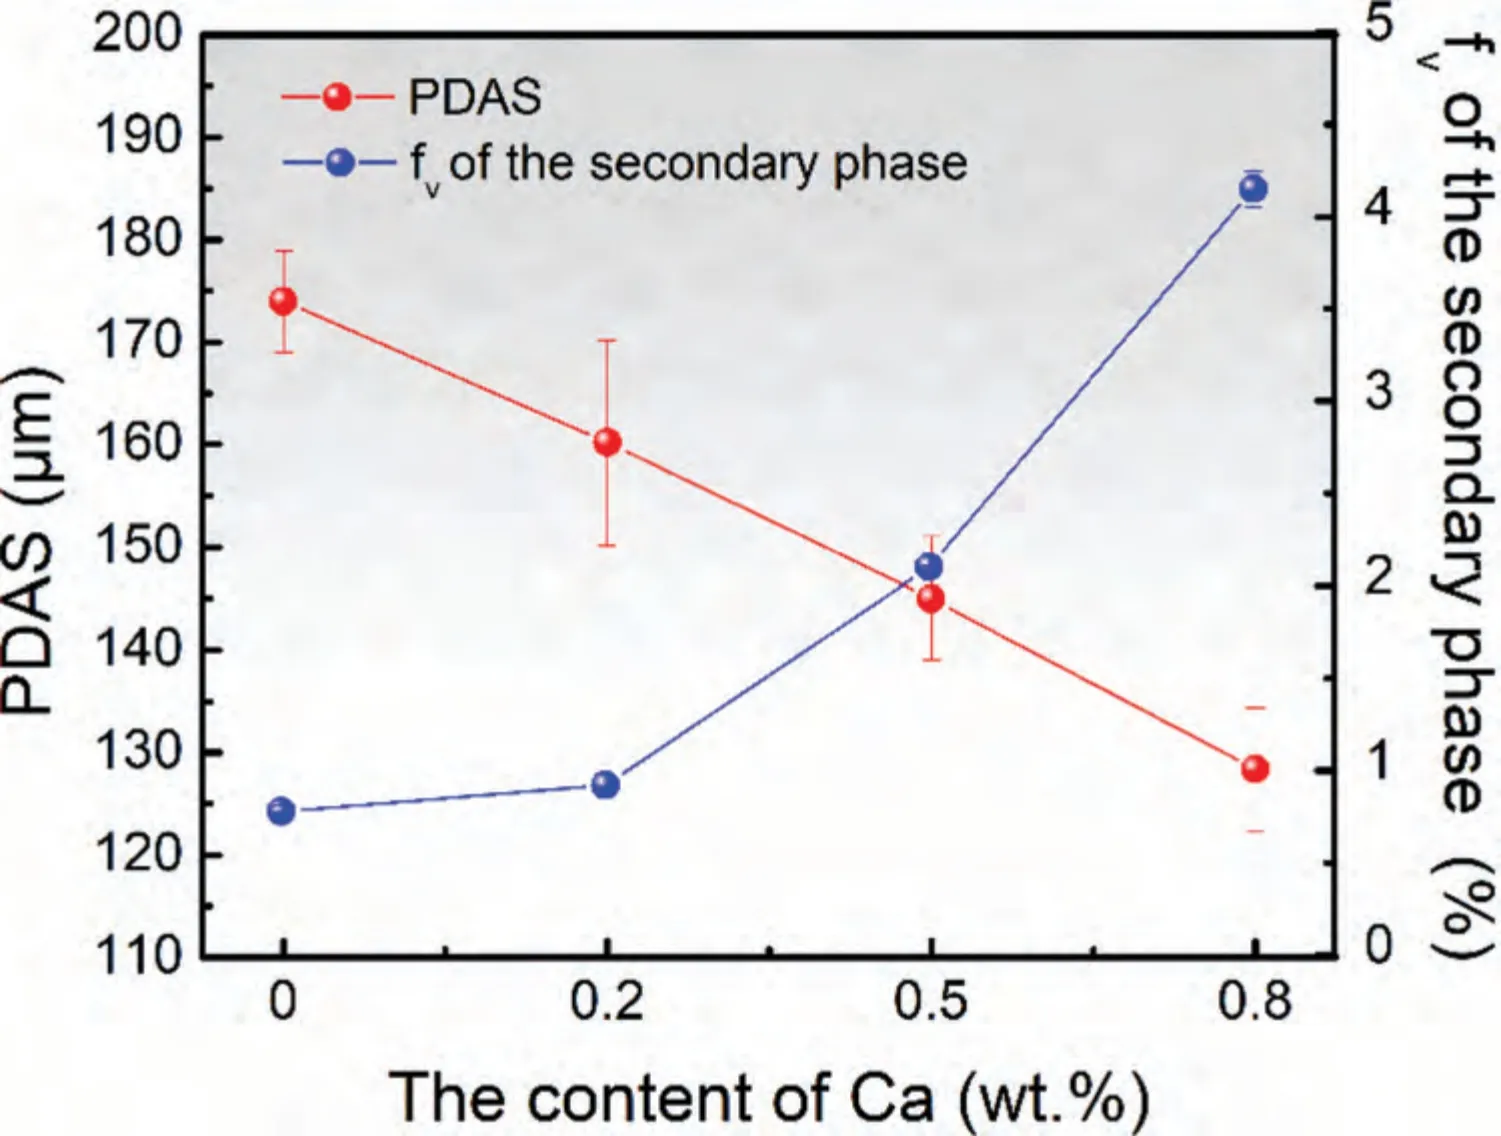
Fig.2.The varied PDAS and fv of secondary phase with the content of Ca in DSed Mg-Zn-Ca alloys.
Typical columnar dendritic structures with trunks parallel with the growth direction are observed on the longitudinal sections of the DSed alloys,as Fig.1 shows.With the increase of Ca content,the primary dendritic arm spacing(PDAS) substantially decreases from 174 μm to 128 μm,and the secondary arms are largely developed.The secondary phase mainly distributes between the dendrites,and the quantity of the secondary phase increases with the increase of the content of Ca.As Fig.1(e) and (f) show,the secondary phases exist as eutectics.The varied PDAS and the volume fraction (fv) of the secondary phase with the content of Ca are given in Fig.2.Fig.3 shows the diffraction patterns of Mg-3Zn-xCa alloys.It can be found that the alloy without Ca is mainly composed ofα-Mg and MgZn phase,while alloys with Ca content over 0.2 wt.% are mainly composed ofα-Mg and Ca2Mg6Zn3phase.
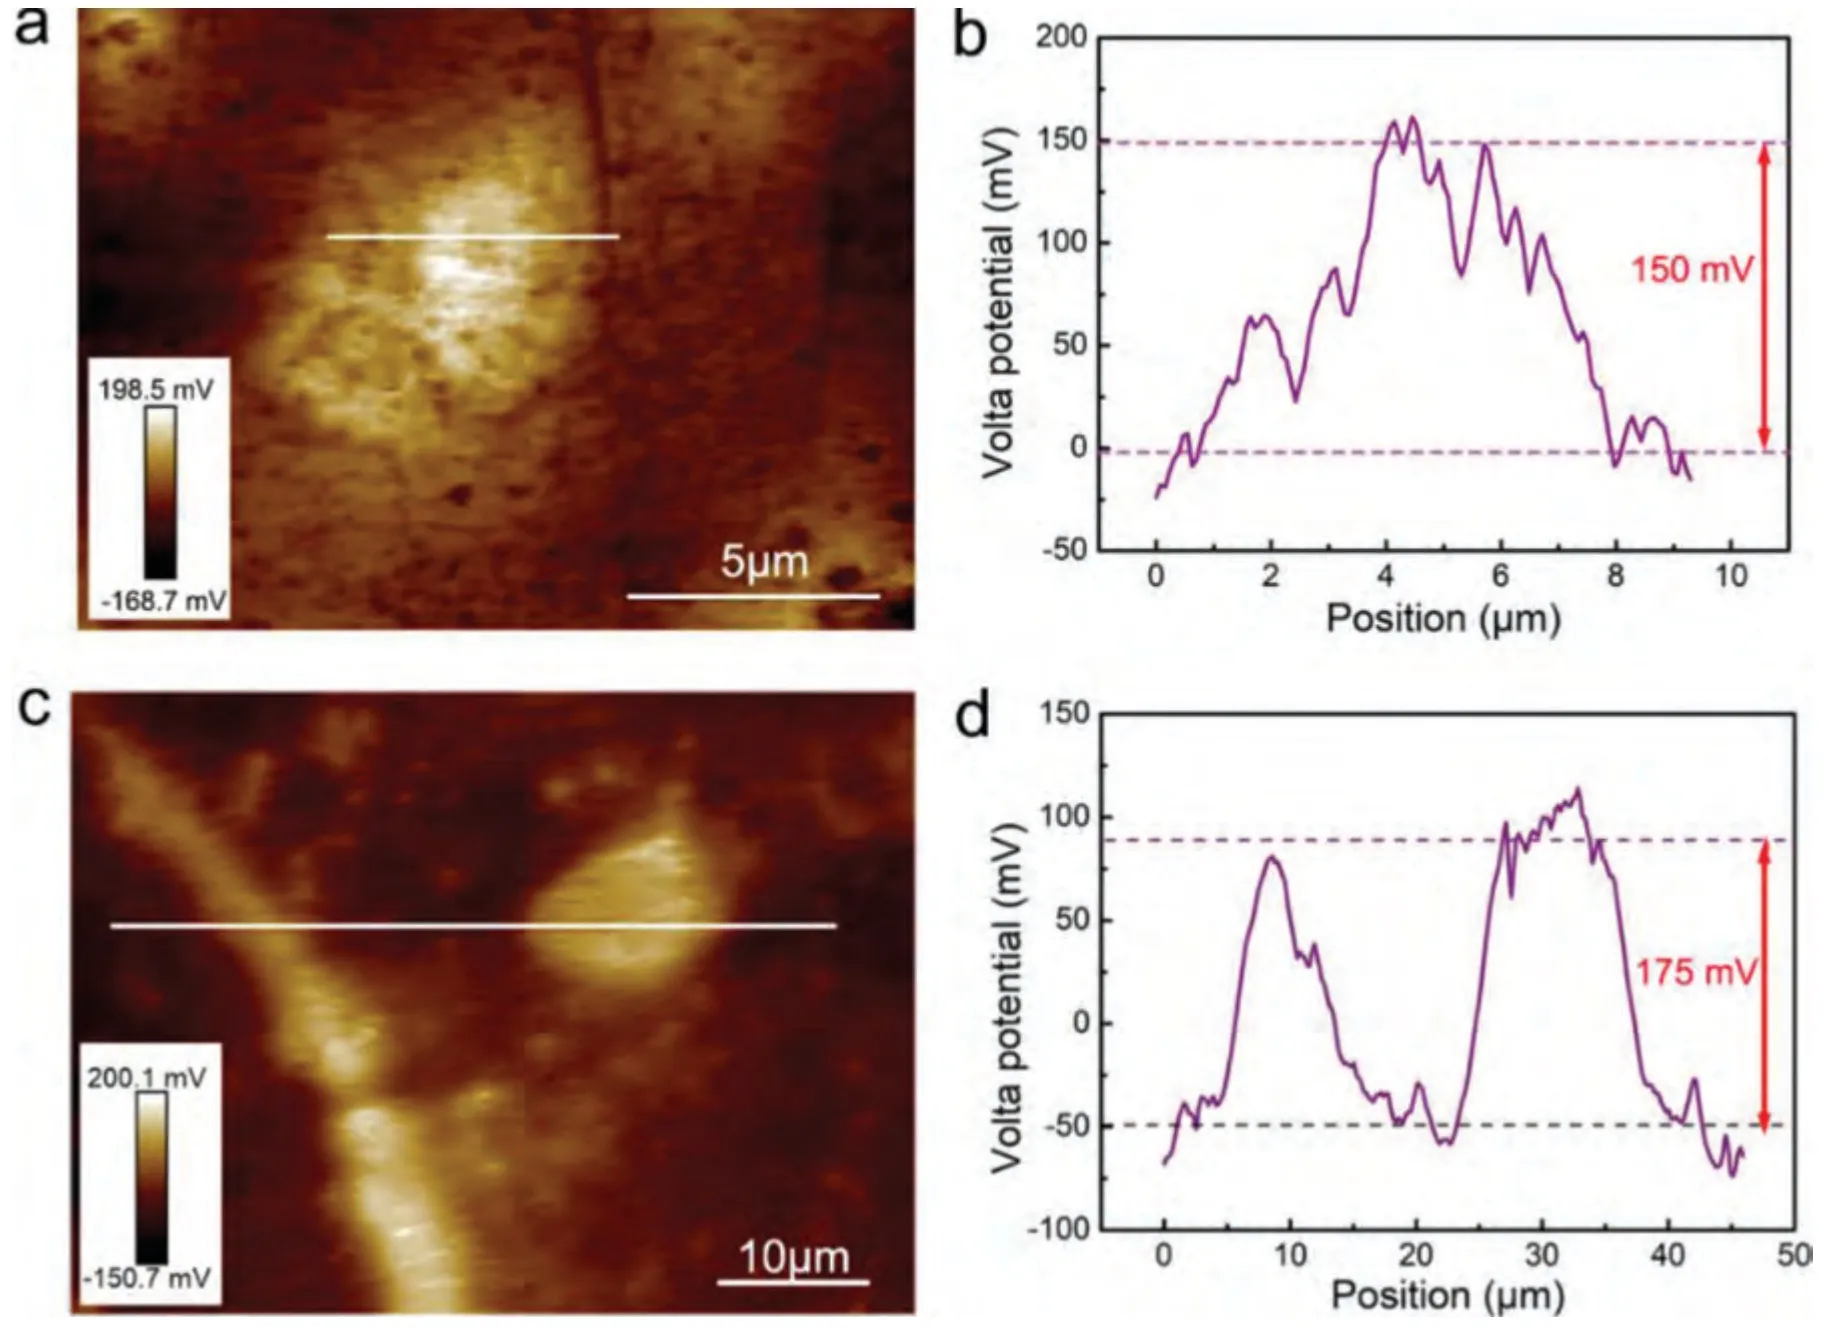
To confirm the electrochemical potential differences between the secondary phases andα-Mg,the Volta potential maps were acquired by SKPFM and presented in Fig.4.The bright area has much nobler potential than the dark area at the SKPFM work function mode,which indicates that the Volta potentials of the secondary phases and grain boundary are higher than that ofα-Mg matrix.

Table 1 Tafel fitting results of the polarization curves for DSed Mg-Zn-Ca alloys with different Ca content.
3.2.Corrosion characteristics
3.2.1.Electrochemical characterization
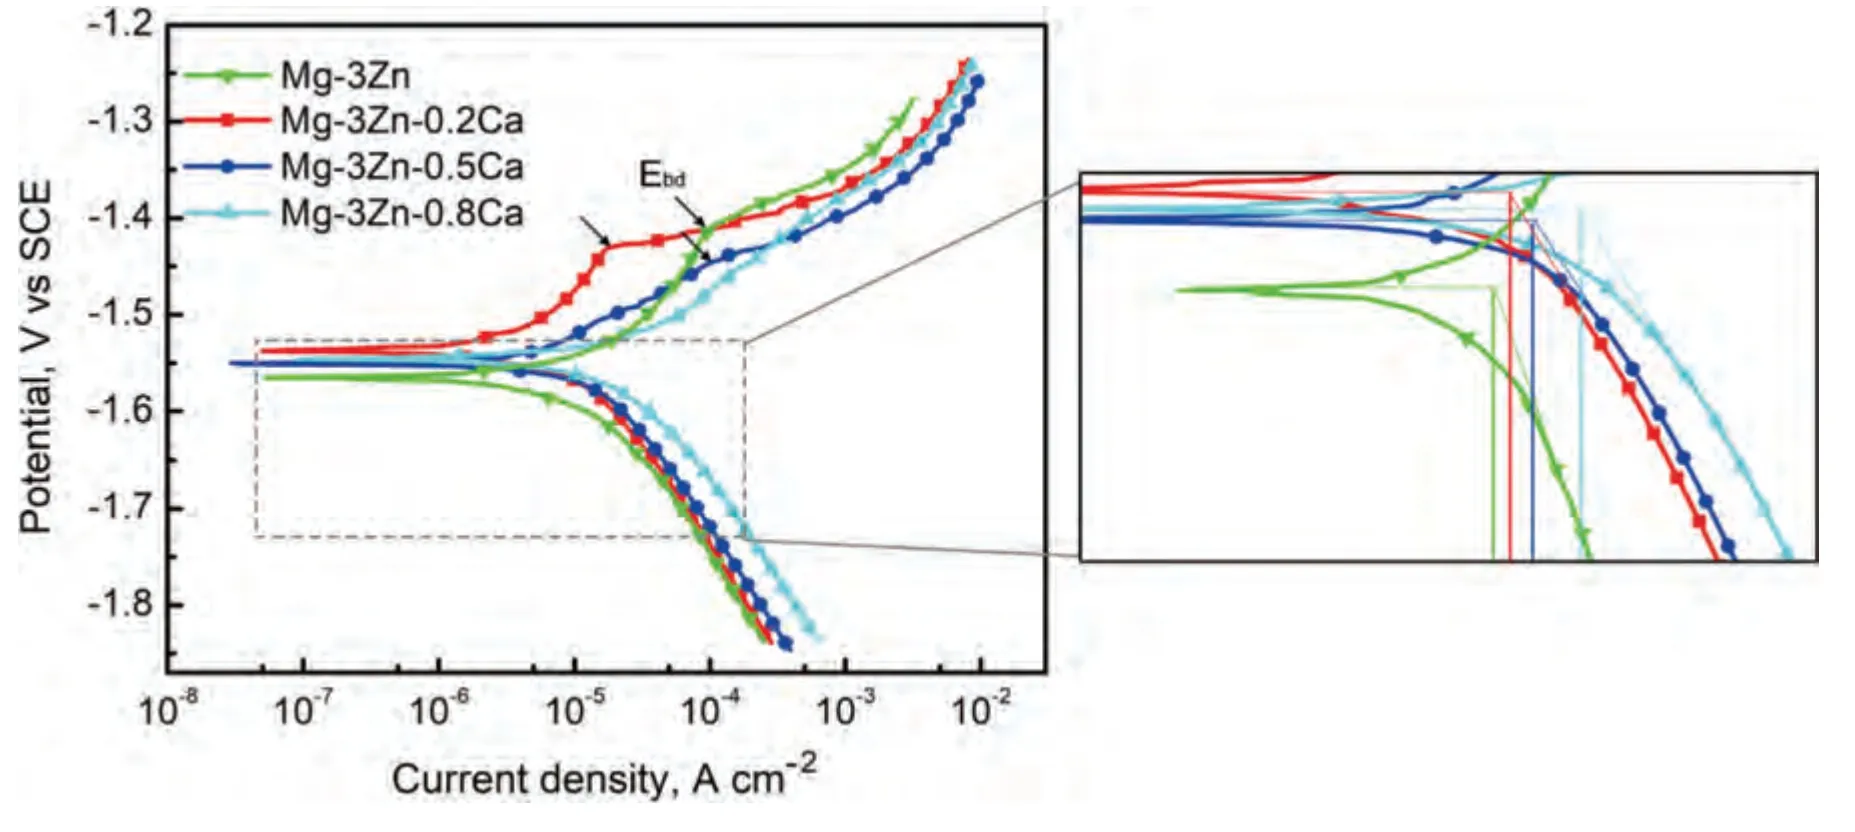
Fig.5 displays the potentiodynamic polarization curves of the DSed Mg-3Zn-xCa alloys.As Fig.5 shows,except for DSed Mg-3Zn-0.8Ca,inflection points marked as black arrows can be seen at the anodic branch curve.The inflection point corresponds to a breakdown potential (Ebd),which implies the formation of protective corrosion products film(CPF).Besides,it is well known that alloy with higher reaction resistance and lower theoretical efficiency of the hydrogen evolution reaction at the cathodic phase exhibits a higher Tafel slope in the cathodic branch [33].Therefore,it can be seen that DSed Mg-3Zn-0.8Ca exhibits the smallest reaction resistance among these three alloys,while Mg-3Zn shows the largest reaction resistance.The sudden increase in anodic current density at Ebd,indicating the absence of additional anodic dissolution and the suppression of negative difference effect within the cathodic polarization region [34].Therefore,the corrosion rates of DSed Mg-3Zn-xCa alloys in this work are calculated using the cathodic branches.The fitting results of the Tafel slope of cathodic branches (bc),corrosion potentials(Ecorr),andicorr,are listed in Table 1.TheEcorrvalues of these experimental alloys are very close,while theicorrvalues have a significant difference.The corrosion ratesPicalculated byicorrwere listed in Table 2.
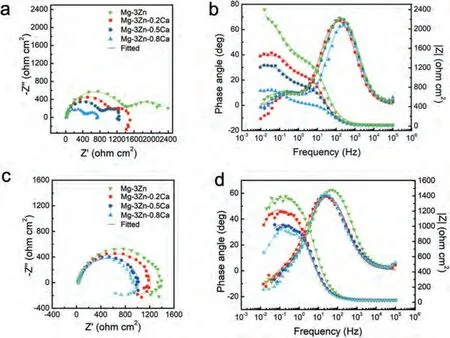
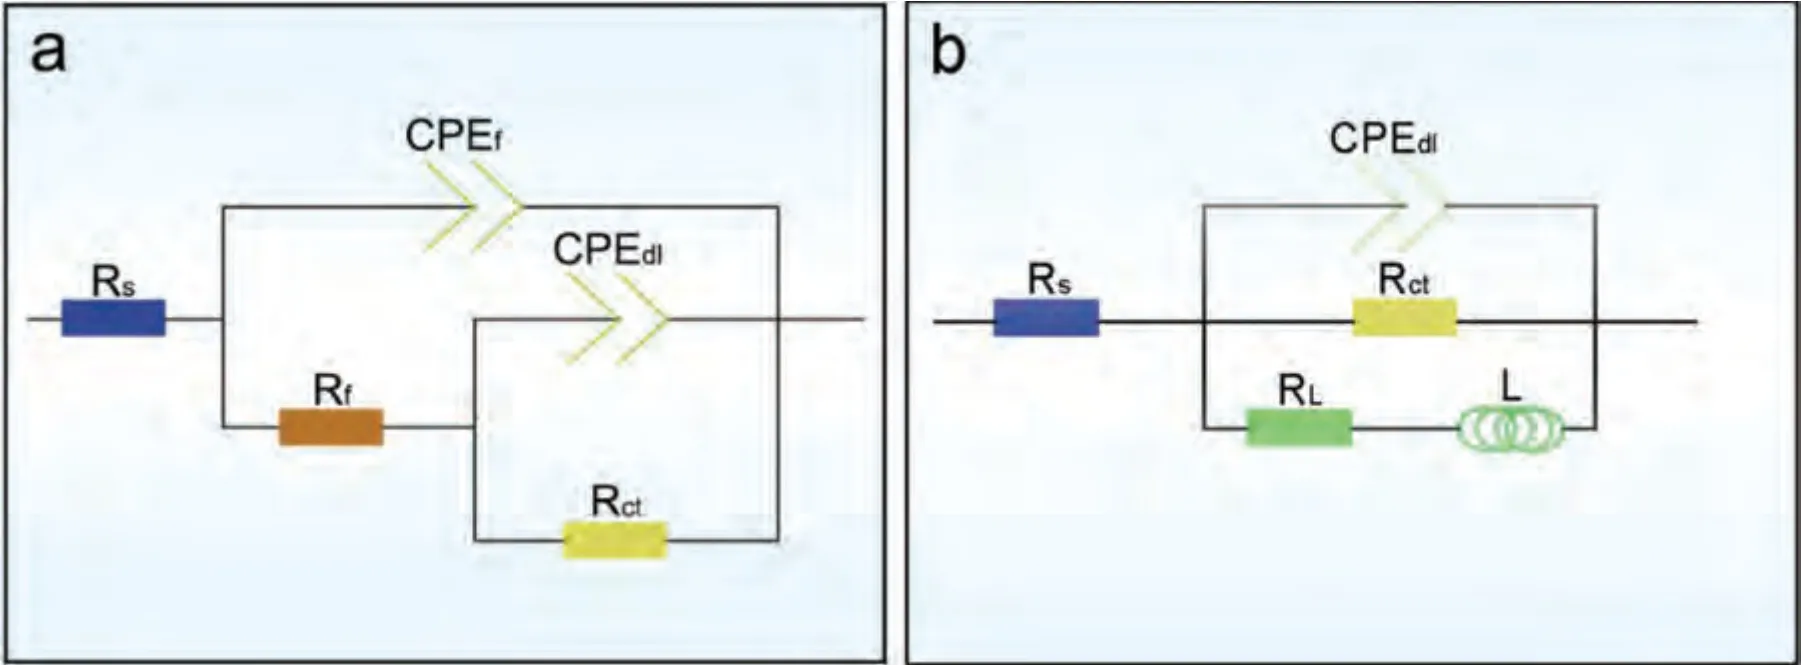
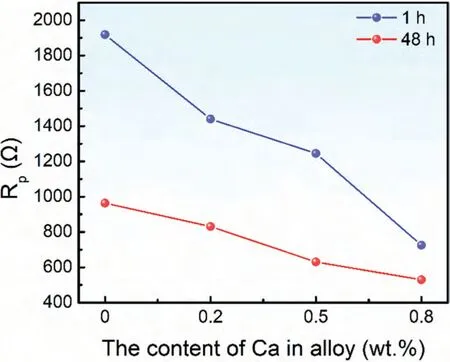
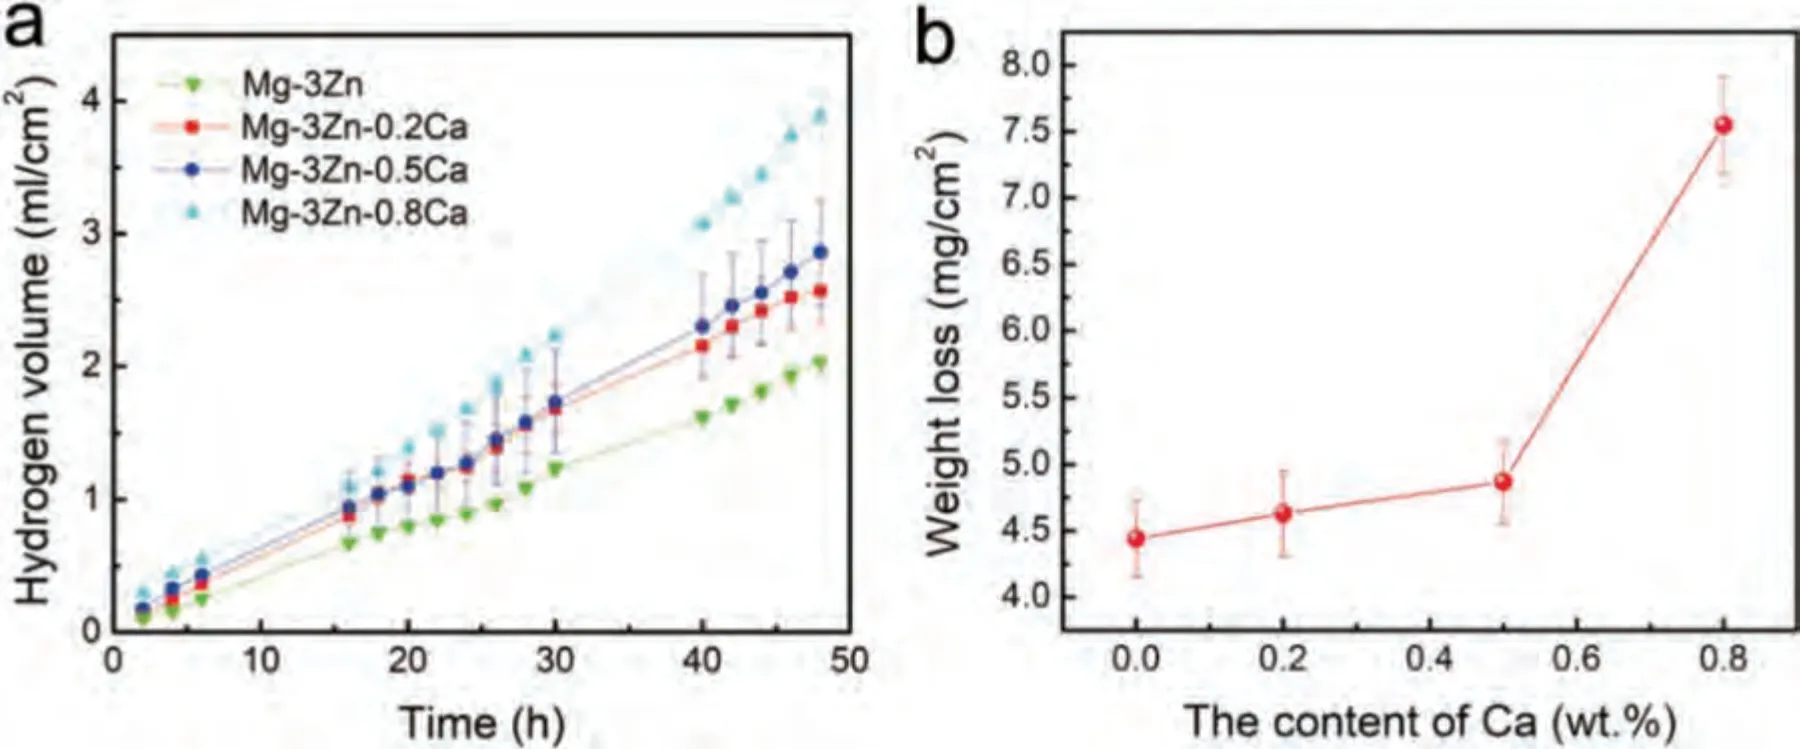
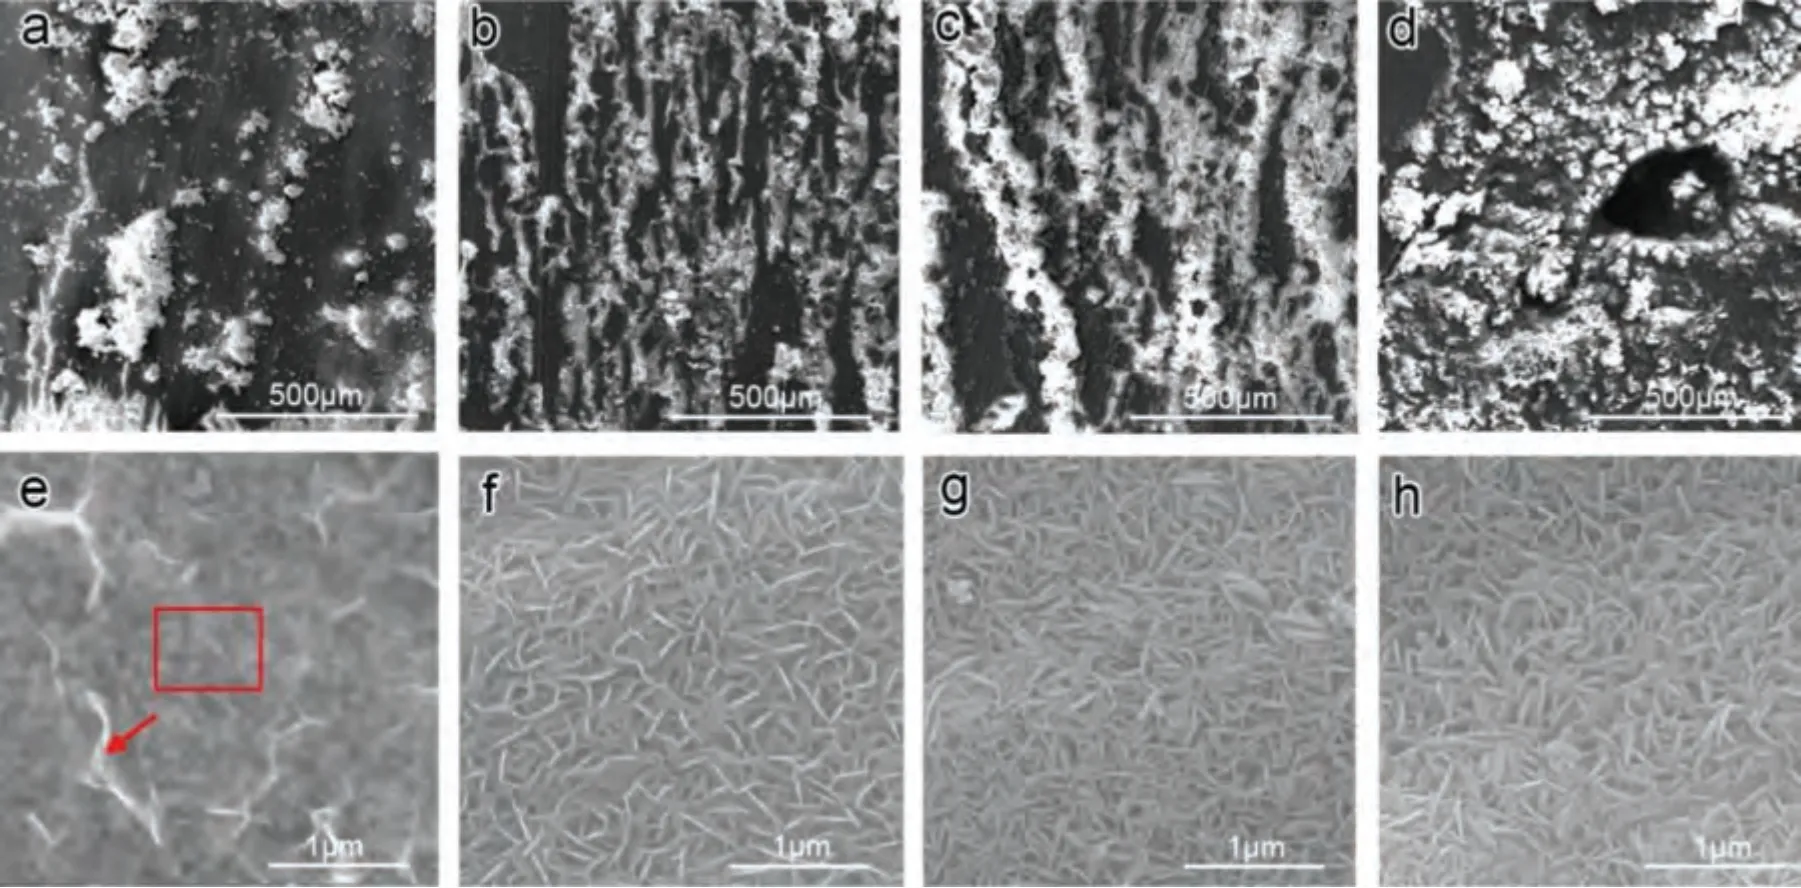
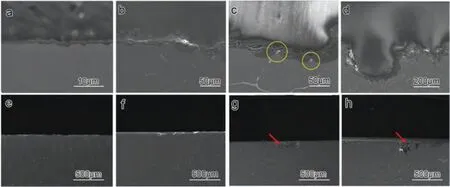
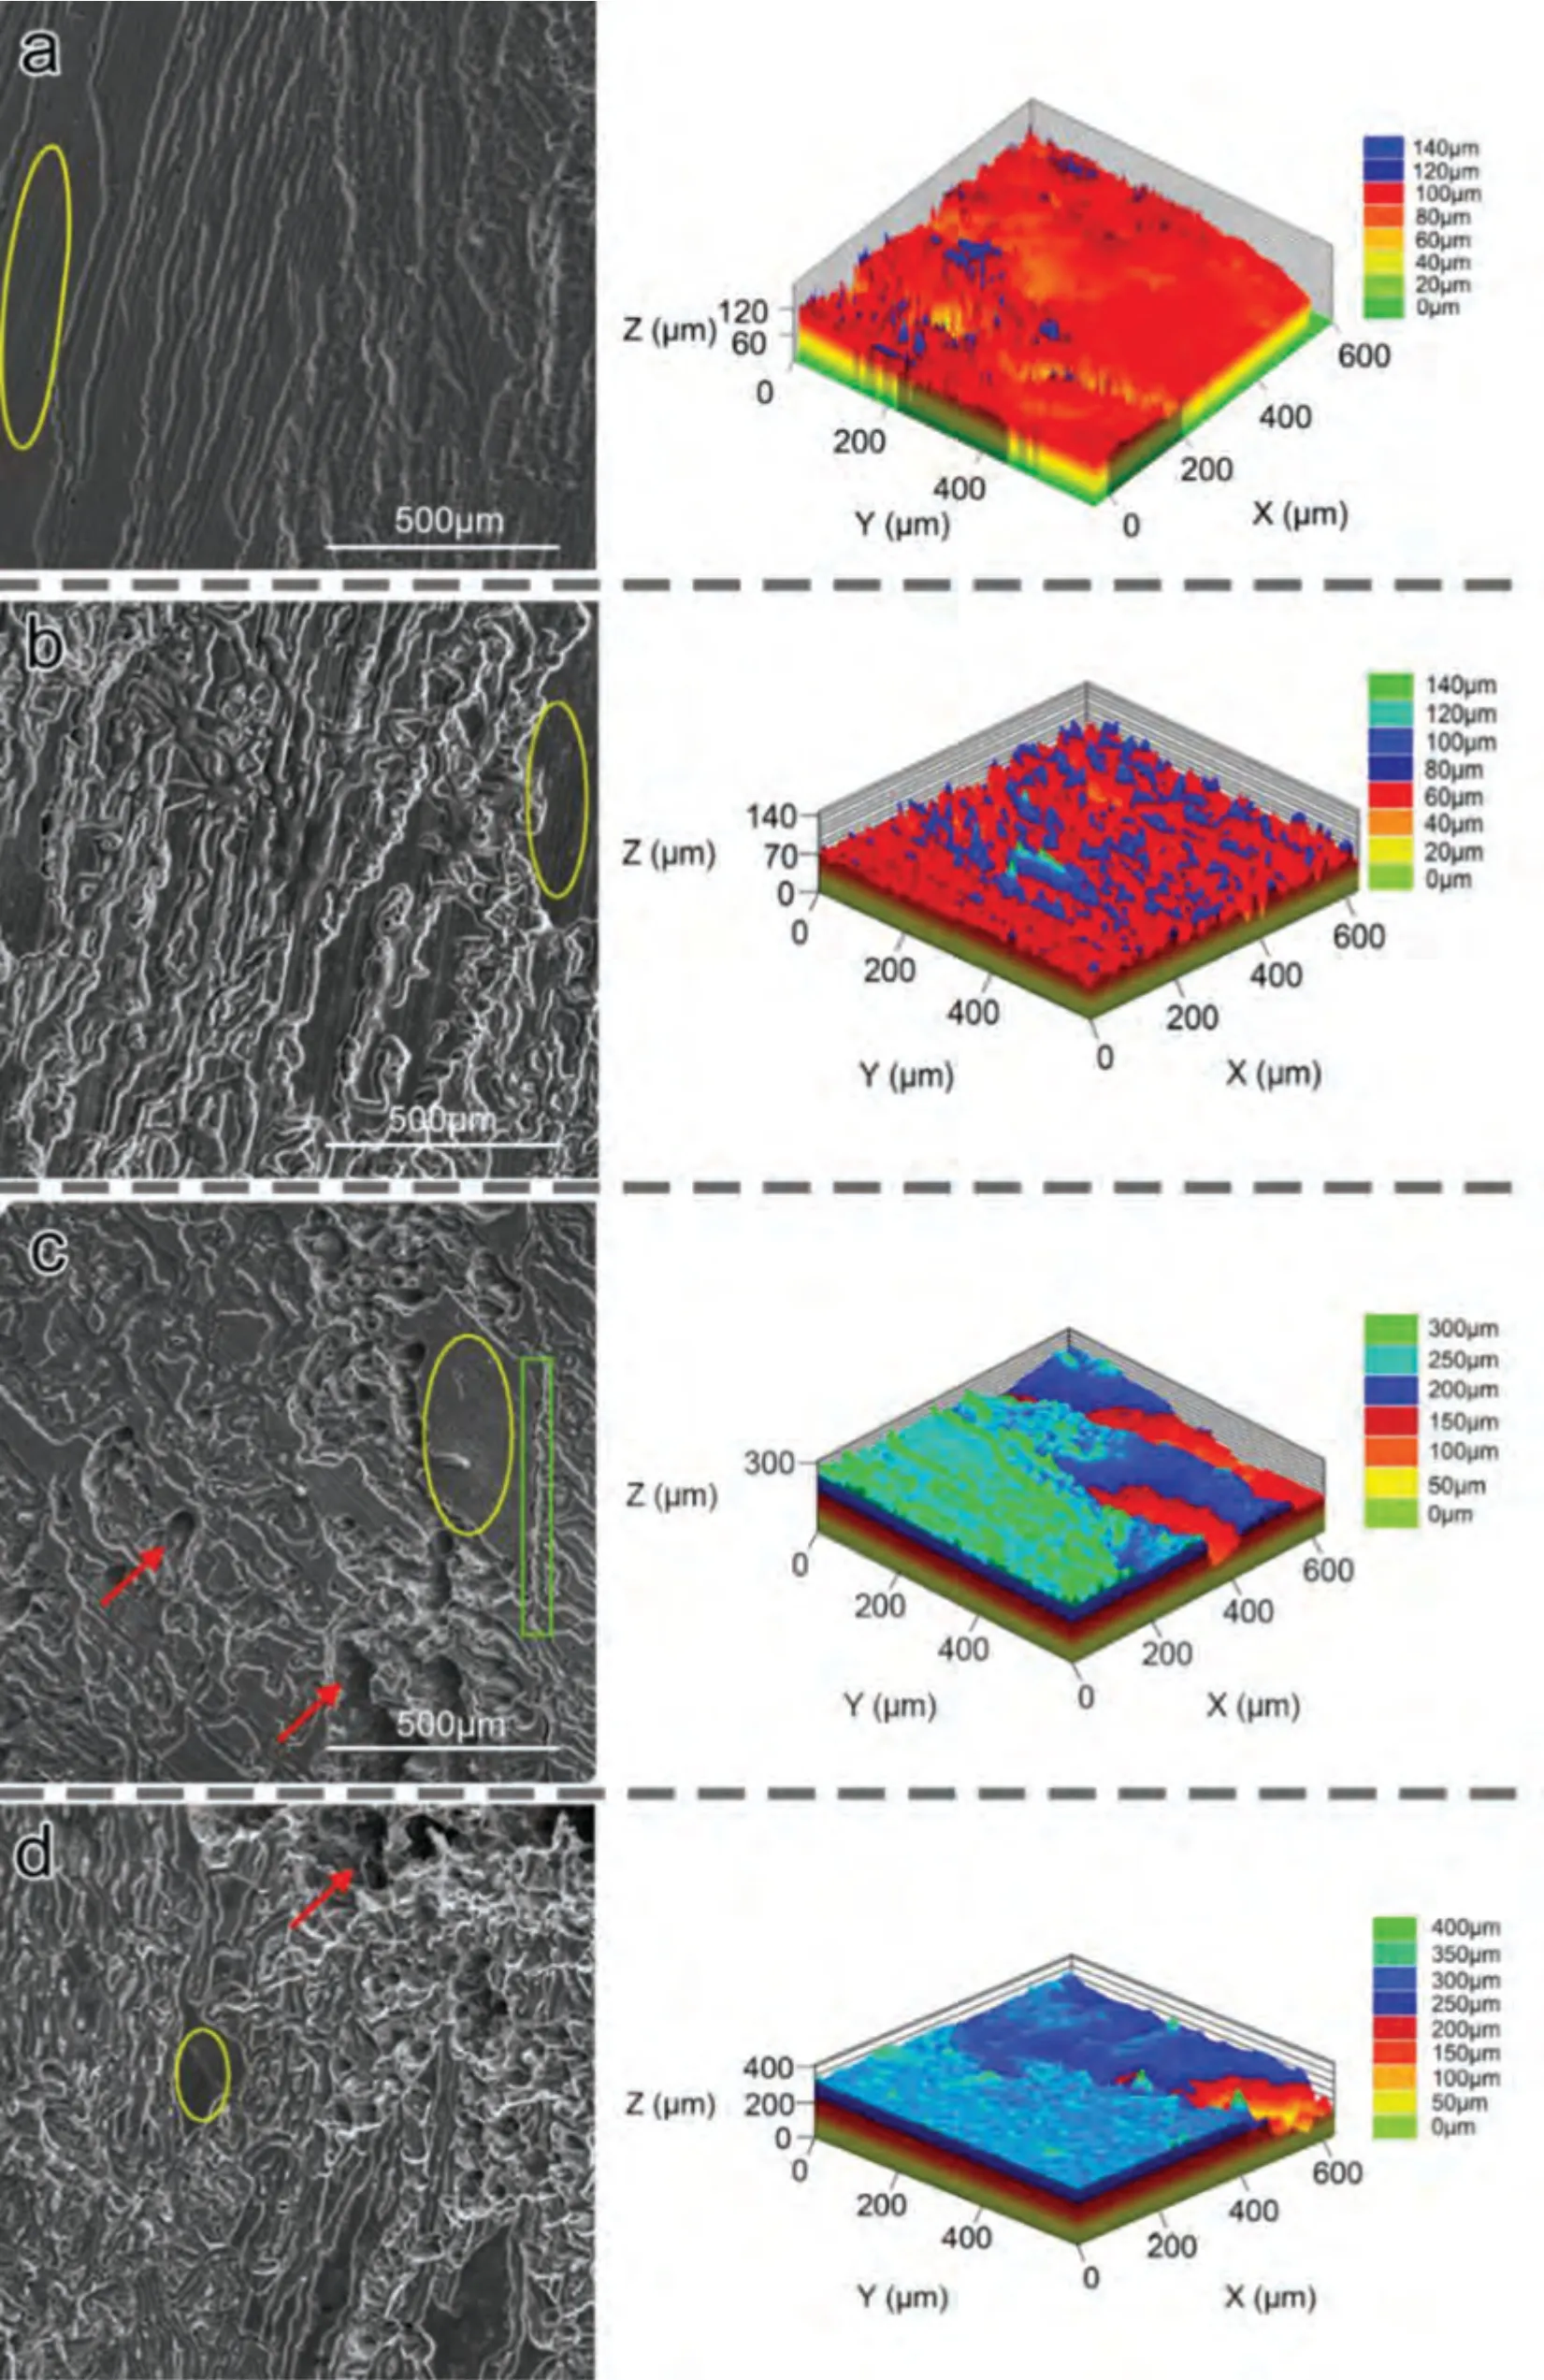
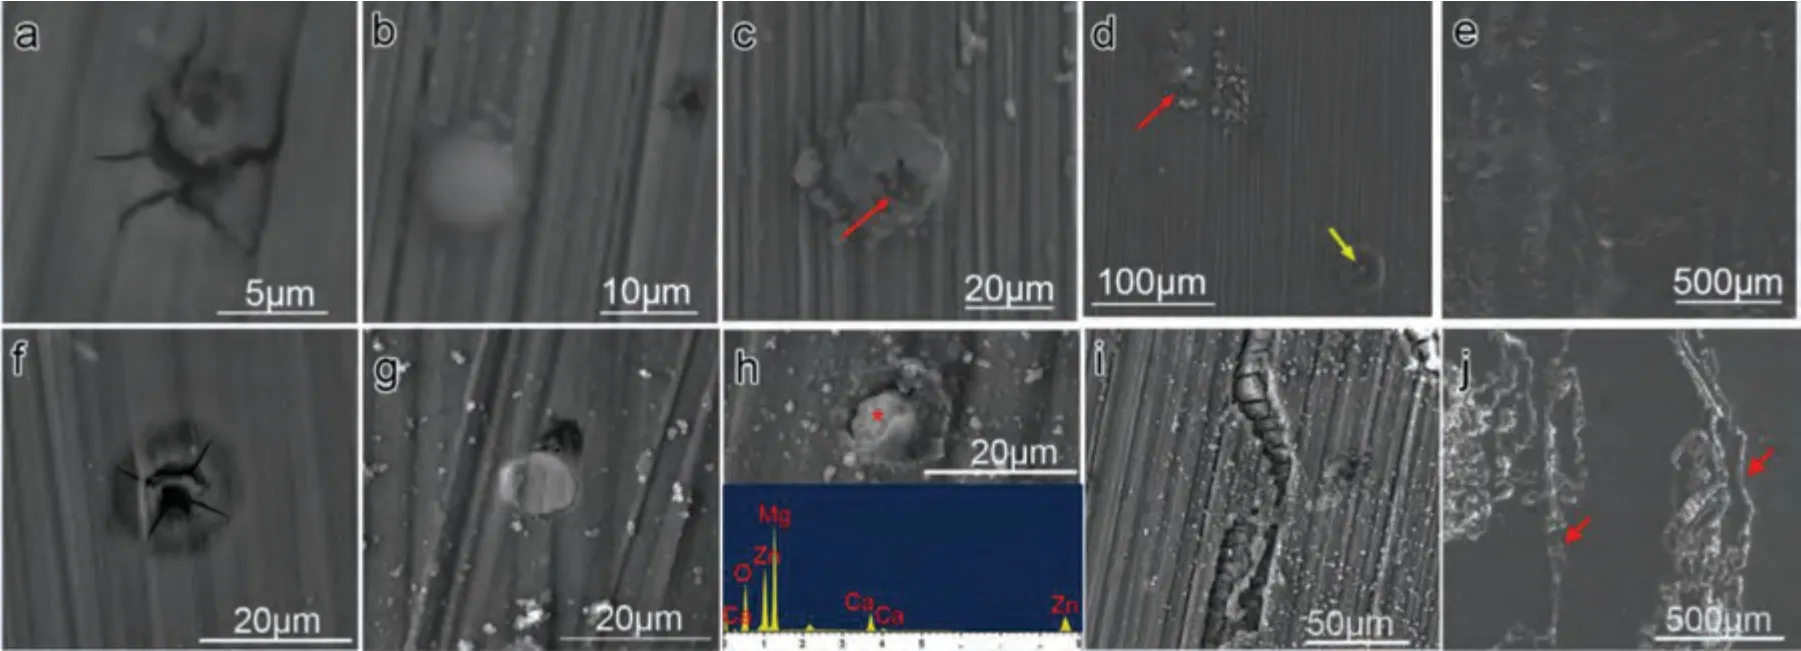
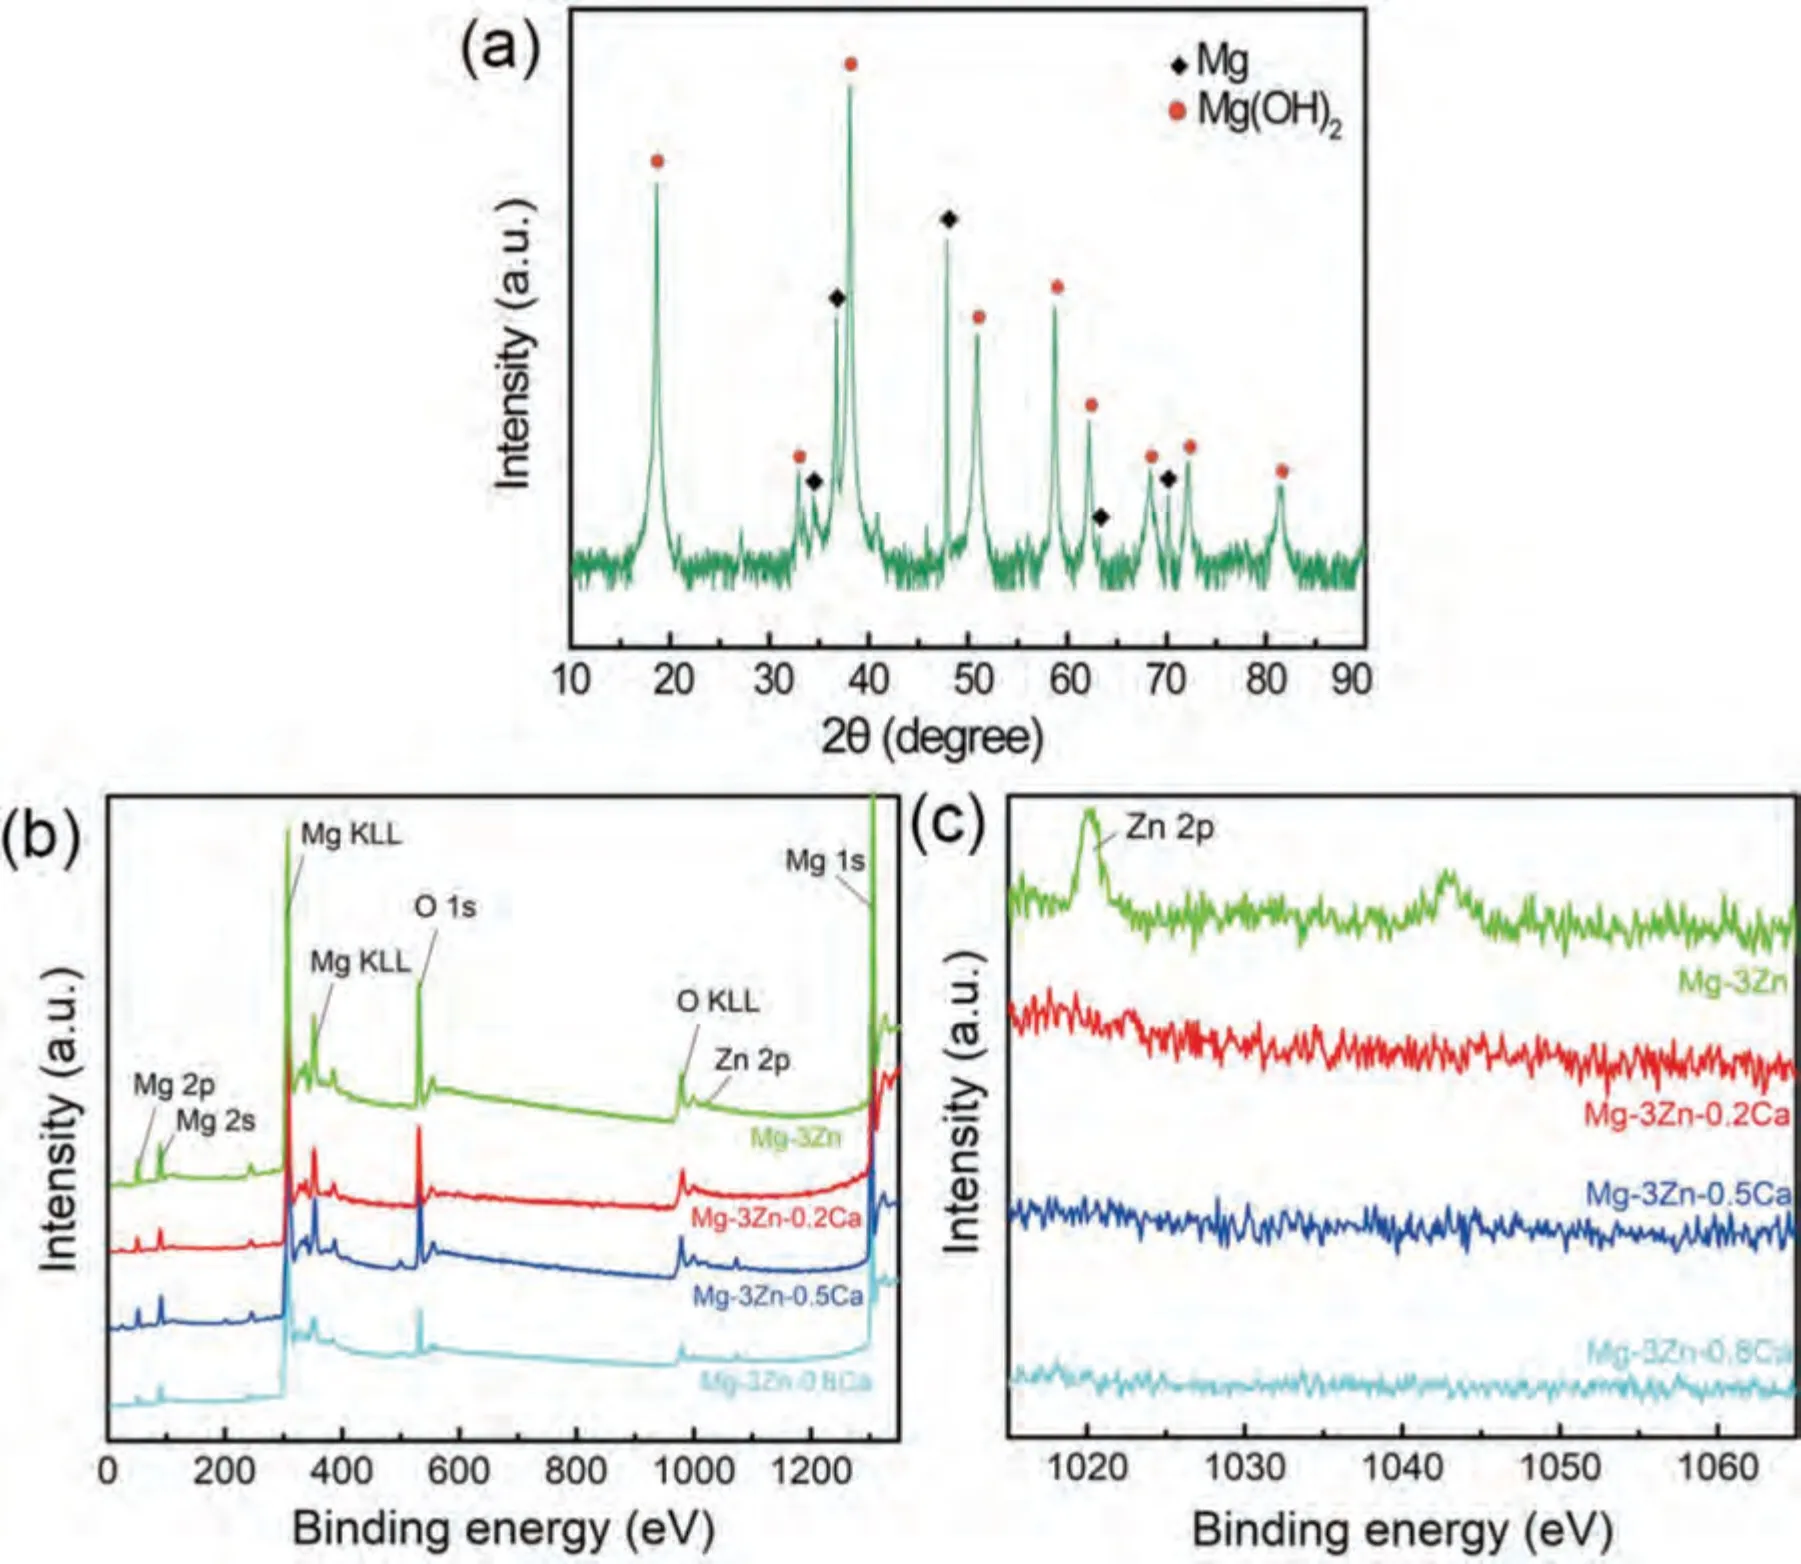
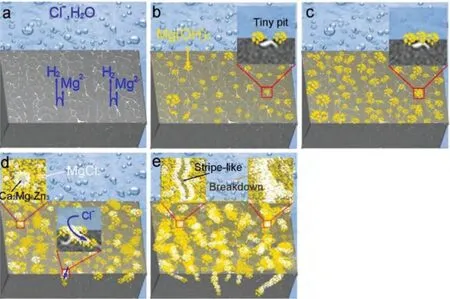
Based on the fitting results,the corrosion rates of the experimental DSed alloys can be sequenced as Mg-3Zn Fig.3.The diffraction patterns of the Mg-Zn-Ca alloys with different Ca content. Fig.4.(a,c) The Volta potential maps,(b,d) the corresponding line-profile analysis of relative Volta potential.(Mg-3Zn: a,b;Mg-3Zn-0.5Ca: c,d). Fig.5.Potentiodynamic polarization curves of DSed Mg-3Zn-xCa alloys with different Ca content in 0.9 wt.% NaCl solution. Table 2 The corrosion rates of DSed Mg-Zn-Ca alloys with different Ca content calculated by electrochemical measurement and immersion tests. To further investigate the electrochemical behavior of the experimental alloys,the Nyquist and Bode plots were obtained by EIS.Fig.6 depicts the Nyquist and Bode plots for the DSed Mg-3Zn-xCa alloys after the immersion for 1 h and 48 h As shown in Fig.6(a),the Nyquist plots of DSed Mg-3Zn-xCa alloys after immersion for 1 h include two capacitive loops representing the characteristics of double electric layer and surface film [34].The diameter of the capacitive loops decreases with the increase of Ca content in alloy,meaning the reduction of the corrosion resistance.As for Bode plots of phase degree vs.frequency (Fig.6(b)),the two wave crests demonstrate the presence of the two capacitance loops.In the case of Bode plots of |Z| vs.frequency (Fig.6(b)),the impedance values rise from high frequency to low frequency and tend to be stable. The equivalent circuit is given in Fig.7(a) to further quantitatively analyze the corrosion characteristics of the DSed Mg-3Zn-xCa alloys,where Rsrefers to the solution resistance,Rctdenotes the charge transfer resistance,Rfrepresent resistance of the corrosion product film formed in NaCl solution,respectively.Besides,CPEfrepresents the constant phase elements (CPE) of CPF,and CPEctrepresents the CPE of electrical double layer.The fitted parameters of the equivalent circuit are listed in Table 3.The values of Rfand Rctdecrease with the increasing Ca content in the Mg-Zn-Ca alloy,indicating the drop of corrosion resistance of the DSed Mg-3Zn-xCa alloys.For the DSed alloys after immersion in 0.9 wt.% NaCl solution for 48 h,a capacitive loop at high frequency,and an inductive loop at low frequency can be seen in Fig.6(c).The existence of the inductive loop suggests that the DSed Mg-Zn-Ca alloys suffered localized corrosion during the long-term immersion [35].The corresponding equivalent circuit of the DSed alloys after immersion in 0.9 wt.%NaCl for 48 h is shown in Fig.7(b),where RLand L are used to describe the inductive loop referring to the resistance of Mg ion reaction and the inductance of Mg ion reaction at the damaged area of the CPF [36].The fitted parameters of the equivalent circuit are summarized in Table 3 as well. To compare the corrosion resistance of the DSed Mg-3ZnxCa alloys,the polarization resistance (Rp) was calculated by Rf,Rt,and RL: where Eqs.(5) and (6) correspond to the case of the alloys with 1 h and 48 h immersion respectively.Fig.8 shows the calculated Rpvalues of the DSed Mg-3Zn-xCa alloys with various Ca contents.It can be seen that the value of Rpdecreases with the increase of Ca content in the alloy,suggesting the negative effect of the addition of Ca on the corrosion resistance of Mg-Zn-Ca alloy.Additionally,the values of Rpfor the alloys with 1 h immersion are higher than that of the alloys with 48 h immersion,which indicates that the protection of the CPF is limited.Therefore,the EIS results show that the corrosion resistance of the four alloys is sequenced as Mg-3Zn,Mg-3Zn-0.2Ca,Mg-3Zn-0.5Ca,and Mg-3Zn-0.8Ca in terms of the corrosion resistance reduction,which is in good agreement with the polarization curves results. 3.2.2.Immersion test The hydrogen evolution and weight loss of the DSed Mg-Zn-Ca alloys after immersing in 0.9 wt.% NaCl for 48 h are presented in Fig.9.The hydrogen volume and weight loss after the specimens immersing for 48 h increase with the addition of Ca.TheCRHEandCRWLare calculated and listed in Table 2.It is found that theCRHEandCRWLrise with the increase of the content of Ca,which is consistent with the electrochemical measurements. Fig.6.(a,c) Nyquist plots and (b,d) Bode plots of the DSed alloys after immersion in 0.9 wt.% NaCl for (a,b) 1 h and (c,d) 48 h. Fig.7.The equivalent circuit of the DSed alloys after immersion in 0.9 wt.% NaCl for (a) 1 h and (b) 48 h. Table 3 The fitting results of the EIS spectra. Fig.8.The varied Rp with the content of Ca in DSed Mg-3Zn-xCa alloys. Fig.9.(a) The varied hydrogen volume with immersion time and (b) weight loss of the DSed Mg-3Zn-xCa alloys after immersing for 48 h. 3.2.3.Corrosion morphologies Fig.10 displays SEM images of the corrosion morphology for the DSed alloys after immersion for 48 h It can be seen that the corroded area of the specimen increases with the increase of Ca content,and the corrosion patterns are parallel to the growth direction of DSed samples.Besides,a deep corrosion hole can be observed in Fig.10(d) for the DSed Mg-3Zn-0.8Ca specimen.At the same time,it can be observed that the CPFs of the DSed alloys containing Ca mainly consist of needle-like particles.However,few needlelike particles marked with the arrow distribute on the CPF of the DSed Mg-3Zn alloy,and there is a compact film with different morphology marked as a rectangle under the needlelike particles. Fig.10.Corrosion morphology of the DSed Mg-3Zn-xCa alloys with different Ca content and their corresponding CPF morphology after the immersion tests:(a,e) 0 wt.%,(b,f) 0.2 wt.%,(c,g) 0.5 wt.%,(d,h) 0.8 wt.%. Fig.11.Corrosion morphology of the DSed Mg-3Zn-xCa alloys with different Ca content and their corresponding CPF morphology after the immersion tests:(a,e) 0 wt.%,(b,f) 0.2 wt.%,(c,g) 0.5 wt.%,(d,h) 0.8 wt.%. Fig.11 shows the corrosion morphology observed from the cross-section of the DSed specimens after the immersion.It can be seen from Fig.11(a) and (b) that relatively thin CPFs have formed on the surfaces of DSed Mg-3Zn and Mg-3Zn-0.2Ca specimens compared with DSed Mg-3Zn-xCa specimens with Ca content over 0.2%.The surfaces of DSed Mg-3Zn-0.5Ca and Mg-3Zn-0.8Ca specimens become extremely uneven after the corrosion,as shown in Fig.11(c) and (d).Besides,the corrosion ofα-Mg matrix around the Ca2Mg6Zn3phase particles can be observed in Fig.11(c)marked with yellow circles,suggesting the micro-galvanic corrosion between the secondary phase andα-Mg matrix. Fig.12 shows the corrosion morphology of the DSed Mg-3Zn-xCa alloys after the removal of the corrosion products.Some regions marked with ellipses in Fig.12 were just slightly corroded after the immersion test,indicating localized corrosion.The DSed Mg-3Zn and Mg-3Zn-0.2Ca alloys suffer relatively slight corrosion without deep pits on the surface compared with alloys with higher Ca content.The deep pits on the surface of Mg-3Zn-0.5Ca and Mg-3Zn-0.8Ca specimens are marked with arrows in Fig.12(c) and(d),and their depth are over 160 μm and 300 μm,respectively.The eroded grain boundary marked within the rectangle can be observed in Fig.12(c) as well.For the cross-section of the experimental specimens,as shown in Fig.11(e) and(f),the corroded surfaces are relatively flat for DSed Mg-3Zn and Mg-3Zn-0.2Ca specimens,compared with the DSed Mg-3Zn-0.5Ca and Mg-3Zn-0.8Ca specimens.Whereas,there are some deep corrosion holes,which are marked with red arrows in Fig.11(g) and (h),on the surfaces of DSed Mg-3Zn-0.5Ca and Mg-3Zn-0.8Ca specimens,indicating their severe corrosion. Fig.12.Corrosion morphology of DSed Mg-3Zn-xCa alloys with different Ca content after the removal of the corrosion products: (a) 0 wt.%,(b) 0.2 wt.%,(c) 0.5 wt.%,(d) 0.8 wt.%. Fig.13.Corrosion morphologies of the (a-e) DSed Mg-3Zn and (f-j) Mg-3Zn-0.2Ca alloys immersed for different times in 0.9 wt.% NaCl solution: (a,f)1 min;(b,g) 10 min;(c,h) 30 min;(d,i) 60 min;(e,j) 8 h. To investigate the corrosion processes,the corrosion morphologies of the DSed Mg-3Zn and DSed Mg-3Zn-0.2Ca specimen after immersion for different duration times were observed,as Fig.13 shows.After the immersion for 1 min,tiny pits can be observed in Fig.13(a) and (f) on the surfaces of DSed Mg-3Zn and Mg-3Zn-0.2Ca specimens.Then,the corrosion products gradually cover these pits,and simultaneously create new pits on the surfaces after the immersion for 10 min,as shown in Fig.13(b) and (g).When the immersion time is extended to 30 mins,the breakdown of CPFs can be seen in Fig.13(c) and (h).Besides,there is a Ca2Mg6Zn3phase particle inside the corrosion pit formed by the breakdown of CPF for DSed Mg-3Zn-0.2Ca specimen in Fig.13(h).For the DSed Mg-3Zn specimen after the immersion of 60 min,island-shaped corrosion products,which is led by the breakdown of CPF and marked as a red arrow,and corrosion pit with secondary phase particle inside marked with a yellow arrow can be observed in Fig.13(d).Whereas,for the DSed Mg-3Zn-0.2Ca specimen after the immersion of 60 min,the corrosion pits expand longitudinally into strips,exposing theα-Mg matrix,as Fig.13(i) shows.When the DSed Mg-3Zn-0.2Ca specimen is immersed for 8 h,the corrosion products covered the existed stripe-like corrosion pattern(Fig.13(j)),tracing the profiles of grain boundaries.However,different from the DSed Mg-3Zn-0.2Ca specimen,the corrosion products are distributed flatly in blocks on the surface of DSed Mg-3Zn specimen after the immersion of 8 h 3.2.4.Corrosion products Fig.14(a) shows the XRD pattern of the corrosion products of DSed Mg-3Zn-0.2Ca alloy.The XRD result shows that the corrosion products contain a large amount of Mg(OH)2.At the same time,XPS is used to further analyze the difference of the corrosion products between the experimental alloys without and with Ca element,and the results are presented in Fig.14(b) and (c).The XPS general diagrams show that the corrosion products are mainly consisted of Mg and O,as shown in Fig.14(b).Except for DSed Mg-3Zn specimen,no element of Zn and Ca is detected in the corrosion products of DSed Mg-3Zn-xCa (x≥0.2 wt.%) specimens.It can be seen in the high-resolution XPS spectra of Zn 2p (Fig.14(c))that there are two high Zn 2p peaks for DSed Mg-3Zn specimen.The two Zn 2p peaks are 2p1/2 and 2p3/2,respectively.The Zn 2p3/2 peak at the binding energy of approximately 1021.4 eV represents zinc oxide (ZnO).Therefore,it can be known that the corrosion products of DSed Mg-3Zn alloy contain Mg(OH)2and ZnO,while the corrosion products of DSed Mg-3Zn-xCa (x≥0.2 wt.%) only contain Mg(OH)2. Columnar dendritic grains can be observed in the microstructure of DSed Mg-3Zn-xCa alloys,and the PDAS decreases with the increase of Ca content.Previous studies have reported the addition of Ca can effectively refine the microstructure of Mg alloys [37,38].Li et al.[39] investigated the microstructure of as-cast Mg-2Zn-xCa alloys.They found that the grain size of the alloys decreased from 388 μm to 175 μm with the Ca content increased from 0 wt.% to 0.8 wt.%.In this work,the PDAS decreases from 174 μm to 128 μm with the Ca content increased from 0 wt.% to 0.8 wt.%.Apparently,the refinement effect of Ca for DSed Mg alloy is limited.For DSed alloys,the PDAS can be calculated by formula [40]: whereΔT0is the temperature difference between the melting temperature and solidification temperature,Dis the diffusion coefficient,Γis Gibbs-Thomson coefficient,kis the distribution coefficient,Vis the growth rate,Gis the temperature gradient.The solidification condition is the same for DSed Mg-Zn-Ca alloys in this study.Hence,the PDAS is determined byΔT0.It can be known from the Mg-Zn-Ca phase diagram that the value of k is smaller than 1 [41].Therefore,the temperature differenceΔT0between the melting temperature and the eutectic temperature decreases with the Ca content increases,resulting in the drop of PDAS.Besides,based on the lever rule,it can be seen from the phase diagram that the fvof the secondary phase in the eutectics increases with the Ca content increase in the alloy. Fig.14.(a) The diffraction pattern of the corrosion products,(b) the XPS general diagram after sputtering 2400s,(c) the high-resolution XPS spectra of Zn 2p. It can be known from Figs.11 and 13 that the DSed experimental alloys mainly undergo micro-galvanic corrosion.According to the experimental results,a schematic diagram is provided in Fig.15 for the description of the corrosion mechanism of the DSed Mg-3Zn-xCa alloys in 0.9 wt.% NaCl solution.The corrosion happens immediately when the specimen contacts NaCl solution,as shown in Fig.15(a).For DSed Mg-3Zn-xCa alloys,the corrosion prefers to happen around the secondary phase as a consequence of the micro-galvanic coupling corrosion,resulting in the formation of tiny pits at the beginning of corrosion,as shown in Fig.15(b).Hence,it can be known that the secondary phase is a key factor affecting the corrosion properties of DSed Mg-3Zn-xCa alloys.In fact,the high fvof secondary phase corresponds to the high ratio of cathode/anode areas,which will accelerate the corrosion.Therefore,as the EIS results show,the value of Rctdecreases with the increase of Ca content in DSed Mg-3Zn-xCa alloys due to the increase of the amount of the secondary phases in the microstructure.In this work,both of MgZn phase in DSed Mg-3Zn alloy and Ca2Mg6Zn3phase in DSed Mg-3Zn-xCa (x=0.2,0.5,0.8) alloys act as cathodes during the corrosion process.Therefore,there is no specific distinction between the types of the secondary phase in the later discussion of the role of the secondary phase during the corrosion of the experimental alloys. Fig.15.Diagrammatic drawing of the corrosion mechanism of DSed Mg-Zn-Ca alloys with columnar grain structure in 0.9 wt.% NaCl solution. With the progress of corrosion,the corrosion products form,accumulate,and cover the pits (Fig.15(c)).Previous studies have revealed that the protection of CPF was significantly related to the corrosion resistance of Mg alloys[42,43].It can be seen in Fig.5 that theEbdof DSed Mg-3Zn alloy is more positive compared with the DSed alloys containing Ca,which means that a more protective CPF has formed on the surface of DSed Mg-3Zn alloy during the corrosion.At the same time,the high value of Rffitted by EIS results also indicates the superior protection ability of CPF for DSed Mg-3Zn alloy.The XRD and XPS results have shown that the CPF of DSed Mg-3Zn alloy consists of Mg(OH)2and ZnO,while the CPFs of the experimental alloys containing Ca element only consist of Mg(OH)2.The solid solution of Zn element in Mg matrix promotes the formation of Zn hydroxide.Then,the Zn hydroxide will change into ZnO due to its low solubility product constant [44].It is well accepted that the formation of ZnO film is beneficial to improve the corrosion resistance of Mg alloys due to the chemical stability of ZnO [45].Therefore,the corrosion resistance of DSed Mg-3Zn alloy is better than the DSed alloys containing Ca. Additionally,previous studies have reported that the fine microstructure was beneficial to the corrosion resistance due to the formation of a protective CPF [46,47].Although the grains are refined with the addition of Ca,the PDAS is still larger than 120 μm in this study.The large PDAS will make little contribution to the formation of a protective CPF.Besides,the CPF of Mg(OH)2is characterized by metastability and partial protection[48].In particular,it is strongly attacked with the presence of Cl-to produce soluble compounds [49],leading to the exposure ofα-Mg matrix and the expansion of corrosion after the breakdown of the CPF,as shown in Fig.15(d) and (e).For the Mg-3Zn-xCa alloys with Ca ≥0.5 wt.%,the Cl-will ulteriorly attack theα-Mg matrix along with the continuously distributed Ca2Mg6Zn3phase,forming deep corrosion hole and destroying the integrity of CPF,as Fig.11 shows.Therefore,the protection of CPF for DSed Mg-3Zn-0.2Ca alloy is superior to that of DSed Mg-3Zn-0.5Ca and Mg-3Zn-0.8Ca alloys,showing higher Rfand better corrosion resistance. In general,the secondary phase plays an important role in the corrosion of DSed Mg-3Zn-xCa alloys.The existance of MgZn and Ca2Mg6Zn3phase results in the micro-galvanic corrosion.Besides,the fvof secondary phases dominates the corrosion rate of the DSed Mg-3Zn-xCa alloys in 0.9 wt.%NaCl solution. Conclusions In this work,the corrosion characteristics of the DSed Mg-3Zn-xCa (x=0,0.2,0.5,0.8 wt.%) alloys were investigated,and the corrosion mechanism was analyzed.The following conclusions can be drawn: (1) The addition of Ca is detrimental to the corrosion resistance of the DSed Mg-3Zn-xCa alloy in 0.9 wt.%NaCl solution.The corrosion rate monotonously rises with the increase of Ca content in DSed Mg-3Zn alloy.The corrosion rate calculated by the weight loss increases from 4.65 mm/a to 7.43 mm/a when the Ca content increases from 0 wt.% to 0.8 wt.%. (2) The secondary phases play an important role in the corrosion of DSed Mg-3Zn-xCa alloys.Micro-galvanic corrosion happens between the high Volta potential secondary phases and the low Volta potentialα-Mg matrix.The increment of the fvof the secondary phases will accelerate the corrosion and weaken the protection of CPF. (3) The DSed Mg-3Zn and Mg-3Zn-0.2Ca alloys can form relatively protective CPFs,and they suffer relatively homogeneous corrosion in 0.9 wt.% NaCl solution.The corrosion products of DSed Mg-3Zn alloy consist of Mg(OH)2and ZnO,while the corrosion products of DSed Mg-3Zn-xCa alloys with Ca≥0.2 wt.% only contain Mg(OH)2. (4) The corrosion initiates around the secondary phases forming tiny pits,and then extends longitudinally with the breakdown of CPF.The limited protection of CPF makes the corrosion ongoing. Declarations of interest None. Acknowledgments This work was supported by the Key Research and Development Plan of Shandong Province (2019JZZY020329),the National Key Research and Development Program of China(2017YFB0103904),the National Natural Science Foundation of China (51701211),and DongGuan Innovative Research Team Program (2020607134012).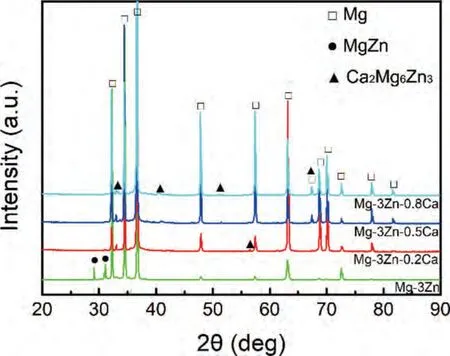


4.Discussion
4.1.Effect of Ca addition on DSed microstructure
4.2.Corrosion mechanism of DSed Mg-3Zn-xCa alloys
杂志排行
Journal of Magnesium and Alloys的其它文章
- Magnesium and its alloys for better future
——The 10th anniversary of journal of magnesium and alloys - Magnesium alloys in tumor treatment: Current research status,challenges and future prospects
- Twin-solute,twin-dislocation and twin-twin interactions in magnesium
- Recent advances on grain refinement of magnesium rare-earth alloys during the whole casting processes: A review
- Magnesium research in Canada: Highlights of the last two decades
- Structure-function integrated magnesium alloys and their composites
