Identification of Fishing State of Purse Seine Fishing Vessels Based on Multi-Indices
2023-12-21XUZhenqiWANGJintaoZHOUChengLEILinCHENXinjunandLIBin
XU Zhenqi, WANG Jintao, 2), 3), 4), 5), *, ZHOU Cheng, 2), 3), 4), 5), LEI Lin, 2), 3), 4), 5),CHEN Xinjun, 2), 3), 4), 5), and LI Bin
Identification of Fishing State of Purse Seine Fishing Vessels Based on Multi-Indices
XU Zhenqi1), WANG Jintao1), 2), 3), 4), 5), *, ZHOU Cheng1), 2), 3), 4), 5), LEI Lin1), 2), 3), 4), 5),CHEN Xinjun1), 2), 3), 4), 5), and LI Bin6)
1),,201306,2),,201306,3),201306,4),,201306,5),,201306,6).,.,123445,
With the popularization of vessel satellite AIS (automatic identification system) equipment and the continuous improve-ment of the AIS data’s coverage, continuity and effectiveness, AIS has become an important data source to study the navigation char- acteristics of vessel groups. This study established an identification model to extract the fishing state and intensity information of fishing vessels, based on the AIS data of purse seine fishing vessels, combined with the variables of vessel position, speed and course. Expert experience, spatial statistics and data mining analysis methods were applied to establish the model, and the Western and Cen- tral Pacific Ocean areas were studied. The results showed that the overall accuracy of identification of the fishing state using Support Vector Machine method is higher, and the method has a good modeling effect. The spatial distribution characteristics of the vessels’ fishing intensity based on AIS data showed a significant cluster distribution pattern. The obtained high-intensity fishing area can be used as a prediction of purse seine fishing grounds in the Western and Central Pacific areas. Through the processing and research of AIS data, this study provided important scientific support for the identification of fishing state of purse seine fishing vessels. The spatial fishing intensity of fishing vessels based on AIS data can also be used for the analysis of fishery resources and fishing grounds, and further serve the sustainable development of marine fisheries.
automatic identification system (AIS); fishing state; machine learning; fishing intensity
1 Introduction
Marine fishery has become an important industry in the national economy and plays an important role in national food security. Because of the restrictions and uncertainties in fishing technology, changes in market demand and over- fishing, marine fishery is facing countless difficulties caus-ing fish resource depletion and benefit decline. Fishing, making contradiction between marine economic and envi- ronmental benefits, is regarded as a destroyer of marineecosystem (Jackson., 2001). Owing to being away from land and having no effective regulatory tools, these issues are more likely to happen to offshore fishing. Meanwhile, the fishing log data of pelagic boats are still poor timeli- ness (Zou., 2015). Thus, the problems of how to mo- nitor fishing activities effectively and evaluate the status of fisheries resources by instant feedbacks from offshore boats need to be resolved for fishery scientists and govern-ments (Hoel and Olsen, 2012; James., 2018).
The automatic identification system (AIS) is a naviga- ble device that automates the fusion of modern techniques for vessel to shore and vessel to vessel identifications (Hu., 2013). Commonly, the AIS data contain static infor- mation (including name of the vessel, Maritime Mobile Ser- vice Identify (MMSI), length, breadth and type of the ves- sel), dynamic information (including time, speed, course, position, state of sail and rate of rotation of the vessel), and other relevant information (including voyage information and navigation safety information) of vessels. It is an idealtool for fishery managers to determine the location of a fish- ing vessel and send information on latitude and longitude, heading, speed,, in nearly the real time. The analysis and mining of AIS data make full use of fishing vessel sta- tus identification, fishery analysis, fishery resource manage- ment and illegal unreported unregulated (IUU) fishing mo- nitoring (Longépé., 2018; Oozeki., 2018). Recent- ly, the AIS data analyzed by the new developed technolo- gies such as artificial intelligence algorithms are being ra- pidly applied to the fishery for monitor and management (Yuan., 2018).
Purse seine fishing is the most efficient fishing method in modern fishery. Purse seines are long nets deployed hang- ing vertically from floats around schooling fish on or near the surface by the vessel or by a separate skiff (Souza.,2017). Purse seine fishery can be divided into free fish groupand attached fish group according to the cluster attribute of target fish species, the latter mainly includes drift attach- ed group and whale and dolphin attached group. According to the characteristics of the fishing object cluster, purse seine operation surrounds the fish group with long belt or nets with one bag and two wings. It forces the fish group to concentrate on the fish taking part or net bag by means of purse seine or combined with enclosure and towing, to achieve the purpose of fishing. Due to the fast-swimming speed of fish, purse seine fishing vessels need to have the performance of high speed to catch up with fish group. To avoid fish escaping, the free speed of the seine should be more than 10 knots. Once the net surrounds the fish group, the bottom of the net is pulled shut and the net is dragged away. Then the fish will drift with the nets before being retrieved and transferred to the vessel. To achieve the pur- pose of this work, a purse seine set is defined at the time that the net is closed around the fish and lifted off the wa- ter surface until the fishing operation is completed. In the meantime, the purse seine vessel stays almost stationary and speed is generally slow, which is about 2.5 knots and less (Bertrand., 2005; Bez., 2010).
Currently, various methods have developed for identifica- tion of fishing state, fishing intensity, and dynamic changesin fishing exploitability using single feature of AIS data, such as ‘speed’ or ‘heading’ variables. Zhang. (2016) found the upper and lower limits of the appropriate speed threshold during fishing by asking the expert experience,collecting relevant vessel records, and analyzing the speed threshold distributions of all vessels to identify the fishing behavior of trawlers. The Gaussian Mixture Models (GMM)were used to mine the characteristic parameters of the speed interval and identify the fishing state to obtain the precise information about the spatial and temporal distribution of fishery resources and fishing intensity (Li., 2021).
Particularly, the Hidden Markov Model (HMM), a com- parative classical probability model, is widely used for iden- tification of fishing state. Peel and Good (2011) establish-ed HMM to predict the behavior of fishing vessels through the change of the speed of fishing vessels. Youen. (2010)analyzed the track data to identify different behavior states of fishing vessels based on Bayesian Hidden Markov Mo- del (HBM). Souza. (2017) also established HMM by using AIS track data to identify fishing and non-fishing be-havior states. Additionally, the clustering models, a machine learning method, are also utilized to identify the state of fishing vessels. Mazzarella. (2014) defined the dwell point in the trajectories of fishing vessels in combination with the speed, heading and other characteristics of fishingvessels. Then, the dwell points in the trajectories of fishing vessels are extracted to identify the fishing behavior of fish-ing vessels through the Density-Based Spatial Clustering of Applications with Noise (DBSCAN) clustering method.
However, there are still some shortcomings and limita- tions in identifying fishing state and fishing intensity using AIS data. For example, identification only by speed thres- hold will overestimate the operating state of fishing ves- sels, and it is easy to misjudge non-fishing state as fishing state (Bertrand., 2007). This would bring deviation and bias in assessment and management for fish resources. Be- cause tuna production in the Western and Central Pacific Ocean (WCPO) mainly caught by purse seine fishing ranks the first and accounts for more than 50% of the world’s tuna production (WCPFC, 2018, 2020). This study attempts to propose a fishing identification method based on several ap- proaches using multiple features in AIS data from purse seine vessels. Then we analyze and evaluate the spatio- temporal dynamics of fishing intensity occurred in the WCPO. The results will be useful for sustainable utilization of tuna species in the Pacific Ocean.
2 Materials and Methods
2.1 Data Source and Processing
The AIS data of purse seine fishing vessels in the Wes- tern and Central Pacific by 2012–2016 were collected fromGlobal Fishing Watch (https://globalfishingwatch.org/). We extracted relevant information including maritime mobile service identification (MMSI), time, longitude, latitude, dis- tance of shore, distance of port, speed, and heading. In or- der to extract the trajectories of fishing vessels, we set the AIS data sequence asm={1,2,3, ···, p}, and thenis used to represent the trajectories of each fishing boat.
,(1)
whererepresents each AIS data series of fishing vessel,1,2,3, ···,prepresents the variables of AIS data, in- cluding longitude (Lon), latitude (Lat), distance of shore (DOS), distance of port (DOP), speed (Spe) and heading (Hea). The abnormal values in the variableswere deleted, and the partial missing values were supplemented by rele- vant methods (Ning, 2020). Finally, we obtained 657139 valid fishing vessel track data samples.
2.2 Characteristics and Threshold of Purse Seine Fishing Tracks
Purse seine vessels can demonstrate some ‘fixed’ pat-terns of activities when they are in fishing. To better illus- trate thetrack characteristics of purse seine fishing opera- tions, we plotted AIS trajectory for one boat as an exam- ple (Fig.1). When catching up with the fish, purse seine fishing vessels maintain a high speed. Once they surround the fish, the speed slows down or even stops. After clos- ing the net, the heading has a turning trend and continues to the next fishing point. The fishing state of each data sample was classified by the expert experience and previ- ous research (Souza., 2017). As the result, there are 158127 data samples annotated with ‘Fishing’ (indicated by the number 1) whereas 499012 data samples annotat- ed with ‘Non-Fishing’ (indicated by the number 0).
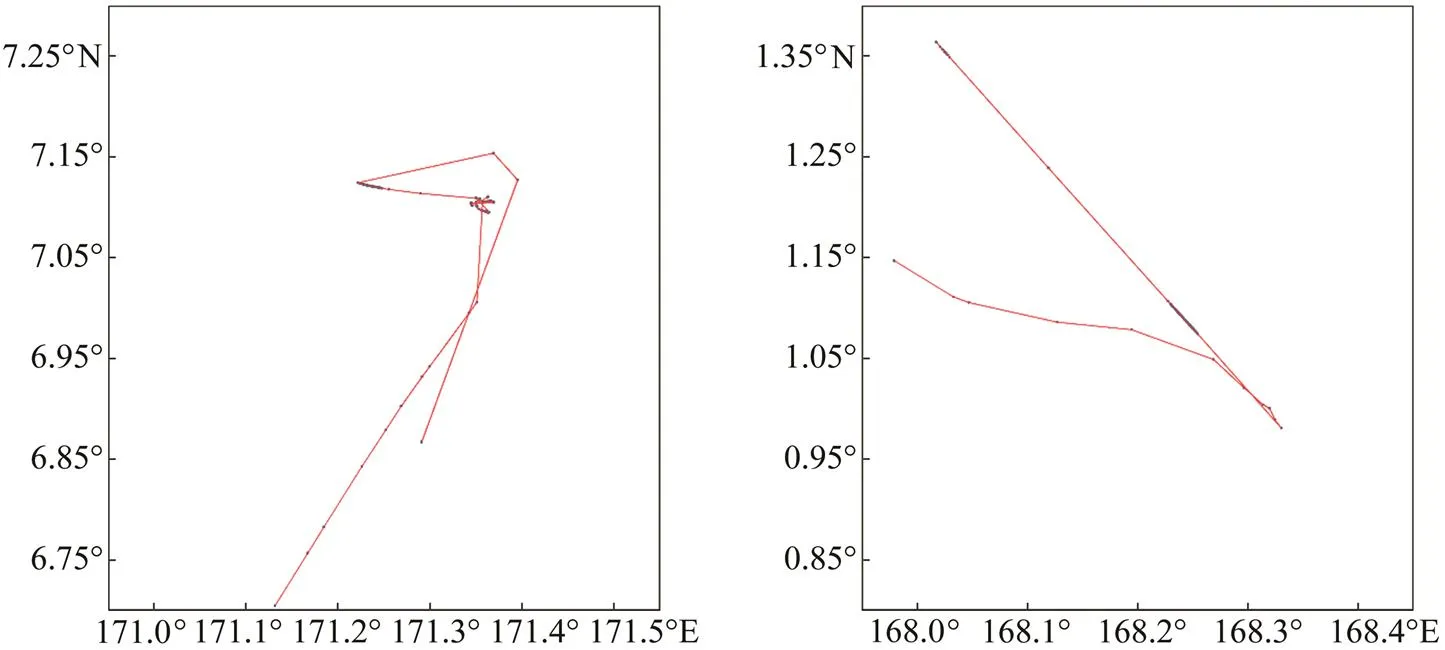
Fig.1 Diagram of purse seine fishing vessels tracks. The picture shows part of the route tracks of two randomly selected purse seine fishing vessels.
2.3 Construction of Support Vector Machines
Support Vector Machines (SVM) are a type of supervisedlearning algorithm that can be used for classification or re- gression tasks. The main idea behind SVM is to find a hy- perplane that maximally separates the different classes in the training data. The SVM with kernel function which can transform nonlinear problem into linearly separable pro-blem has strong ability of nonlinear mapping (Cortes., 1995). The SVM can be expressed by the following equa- tion:
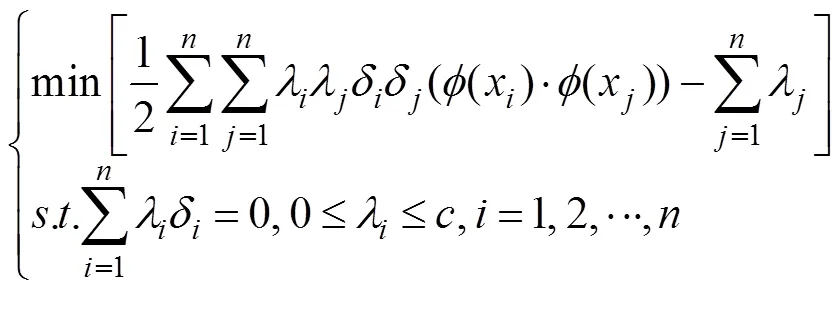
where≥0 andis the penalty parameter. Bringing these relations into the Lagrangian function allows one to solve to obtain the Lagrangian multiplier, the optimal solution. Then the optimalωand*are

Finally, use the optimal classification decision function for classification and identification. The formula is:

and the inner product in the classification decision func- tion is replaced by a kernel function. The kernel function in a kernelized SVM tells us that, given two data points in the original feature space, the similarity is between the po- ints in the newly transformed feature space. The selection of kernel function is a key step in constructing the SVM model, and the radial basis function (RBF) with only one parameter and higher performance were thus considered in this paper (Stevenson., 2019). RBF is the default kernel used in SVM.
2.4 Construction of Naive Bayesian Model
Naive Bayesian Model (NBM) has extremely scalableability. Bayesian reasoning method is based on probability and make inferences about the probability distribution ofoptimal decisions (Bulashevska and Eils, 2006; Zhang., 2006). Naive Bayesian is considered to be one of the best algorithms and has several advantages, such as easier im- plementation, faster speed, and higher efficiency. NBM re- quires less training data and is scalable. It can handle both continuous and discrete data and is suitable for text data or fog computing support. The NBM is easy to construct and especially effective for huge datasets. The fishing state identification algorithm based on Naive Bayes can be de- fined as:

whereis the track to be classified,yis the category variable, andXis the characteristic variable of. For any track={1,2,···,}, the classification algorithm se- lects the category with the largest a posteriori probability(y|) as the category of the track.
We can use Maximum A Posteriori (MAP) estimation to estimate the results. In spite of their apparently over-sim- plified assumptions, NBM classifiers have worked quite well in many real-world situations, famously document classi- fication and spam filtering (Zhang, 2004). They require a small amount of training data to estimate the necessary pa- rameters. Construction of NBM includes two steps: struc- ture learning and parameter learning. Due to the assump- tion of conditional independence, each node in NBM is in- dependent of each other, and the structure is relatively sim-ple. Thus, the parent node is the fishing state of vessels, and the child node is the characteristic variable.
2.5 Test and Evaluation of the Model
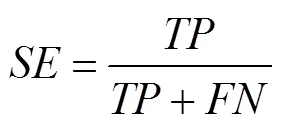
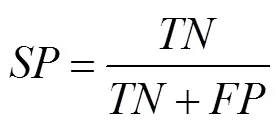
The SVM and the NBM classification models were es- tablished with variables of Time, Lon, Lat, DOS, DOP, Spe, and Hea as input variables, and the fishing state as output variable. The performance metrics of models including sen-sitivity (), specificity (), Youden index (), accuracy (), whilecoefficients were calculated from con-fusion matrix (Table 1, Al-Hashem., 2021).repre- sentsthe number of correctly identified fishing states,represents the number of incorrectly identified fishing states,represents the number of correctly identified non-fish- ing states, andrepresents the number of incorrectly iden- tified non-fishing states (Table 1).

Table 1 Confusion matrix of 2-class
Based on the confusion matrix, the formulas for,,, andare as follows:


Meanwhile, formula ofindex is as follows (Fred., 2000):
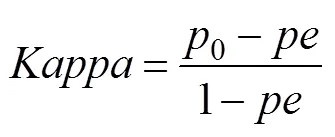

where0is the,is the total number of samples. Thevalue range ofcoefficient is −1.00–1.00, it is usual- ly between 0–1.00. When the value is −1.00, it indicates that the result is completely inconsistent with the actual si- tuation (Table 2).
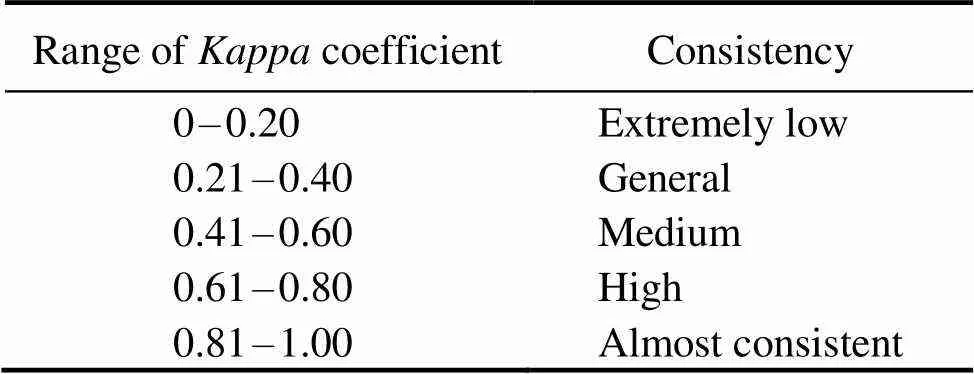
Table 2 Kappa coefficient and consistency level
The robustness of models was also evaluated using cross- validation. In each run, data samples were randomly divided into two subsets that are used as training data and testing data in the ratio of 70% and 30%, respectively. The models fit on the training data are used to predict fishing state basedon testing data. Then the performance metrics of SVM and NBM for each run were calculated and compared to select the optimal model.
2.6 Mapping of the Fishing Intensity
The kernel density estimation (KDE), a nonparametric method to estimate the probability density, was used to cal- culate the intensity of purse seine fishing (Borruso, 2008). The computational equation can be expressed as:

whereK() is the kernel function;is the bandwidth;is the number of known fishing vessel points in the bandwidthrange;is the dimension of the data. Then the monthly dis- tribution maps of fishing intensity are depicted to demon- strated the spatio-temporal dynamics in fishing effort dur- ing 2012–2016.
We fitted the SVM and NBM models using the ‘e1071’ package and used the density plot tool in ‘ggplot2’ to plot the density of fishing vessel distribution in the R software environment (V3.6.0).
3 Results
3.1 Comparison of Model Accuracy
Two different identification models were simutiously train- ed and tested based on training and testing dataset by 100 cross-validation. Generally, SVM identification model was with higher accuracy and better stability with higher,,,, andvalues than NBM, and thus SVM was employed as our final model (Fig.2).
3.2 Spatio-Temporal Distribution of Fishing Intensity
The kable distribution patterns were observed by the spa- tial distribution maps of fishing intensity derived from the results of identified 657, 139 samples by SVM model (Fig.3).In term of space, fishing activities of purse seine were main-ly concentrated at low latitudes between approximately 10˚S–15˚N and 145˚E–135˚W in the tropical zone of WCPO. The distribution pattern of high fishing intensity in tropicalwaters changed from ‘scattered points’ to ‘larger mas’. Fish- ing activity with relative lower intensity is also found dur- ing June–August at the Northwestern waters of the WCPO (Fig.3).
On the time of month scale, there is an obvious seasonal changing (increased from February to June and then de- creased) in fishing intensity. Many purse seine vessels with highest fishing intensity caught fishes near the equatorial waters between 10˚S–10˚N in the WCPO, whereas little fishing activities happened near Line islands in February. In perspective of latitude, the areas occupied by the high fishing intensity are relative stable near the equator all year round (Fig.3).
4 Discussion
Traditional methods used for exploring the spatio-tem- poral distribution of fish species are marine survey, estab- lishing statistical models based on fish logbook data and marine environmental data (Chen., 2017; Wei., 2019; Wang., 2022). The fishing characteristic analy- sis and fishing status discriminant by mining AIS data us- ing machine learning provide another way of confirming the abundance and distribution of fishes. We established a classification model for detecting fishing state and calcu- lating fishing intensity of purse seine vessels. Subsequent-ly, the extracted information was used to infer potential fish- ing grounds for tuna purse seine vessels in the West-cen- tral Pacific Ocean.
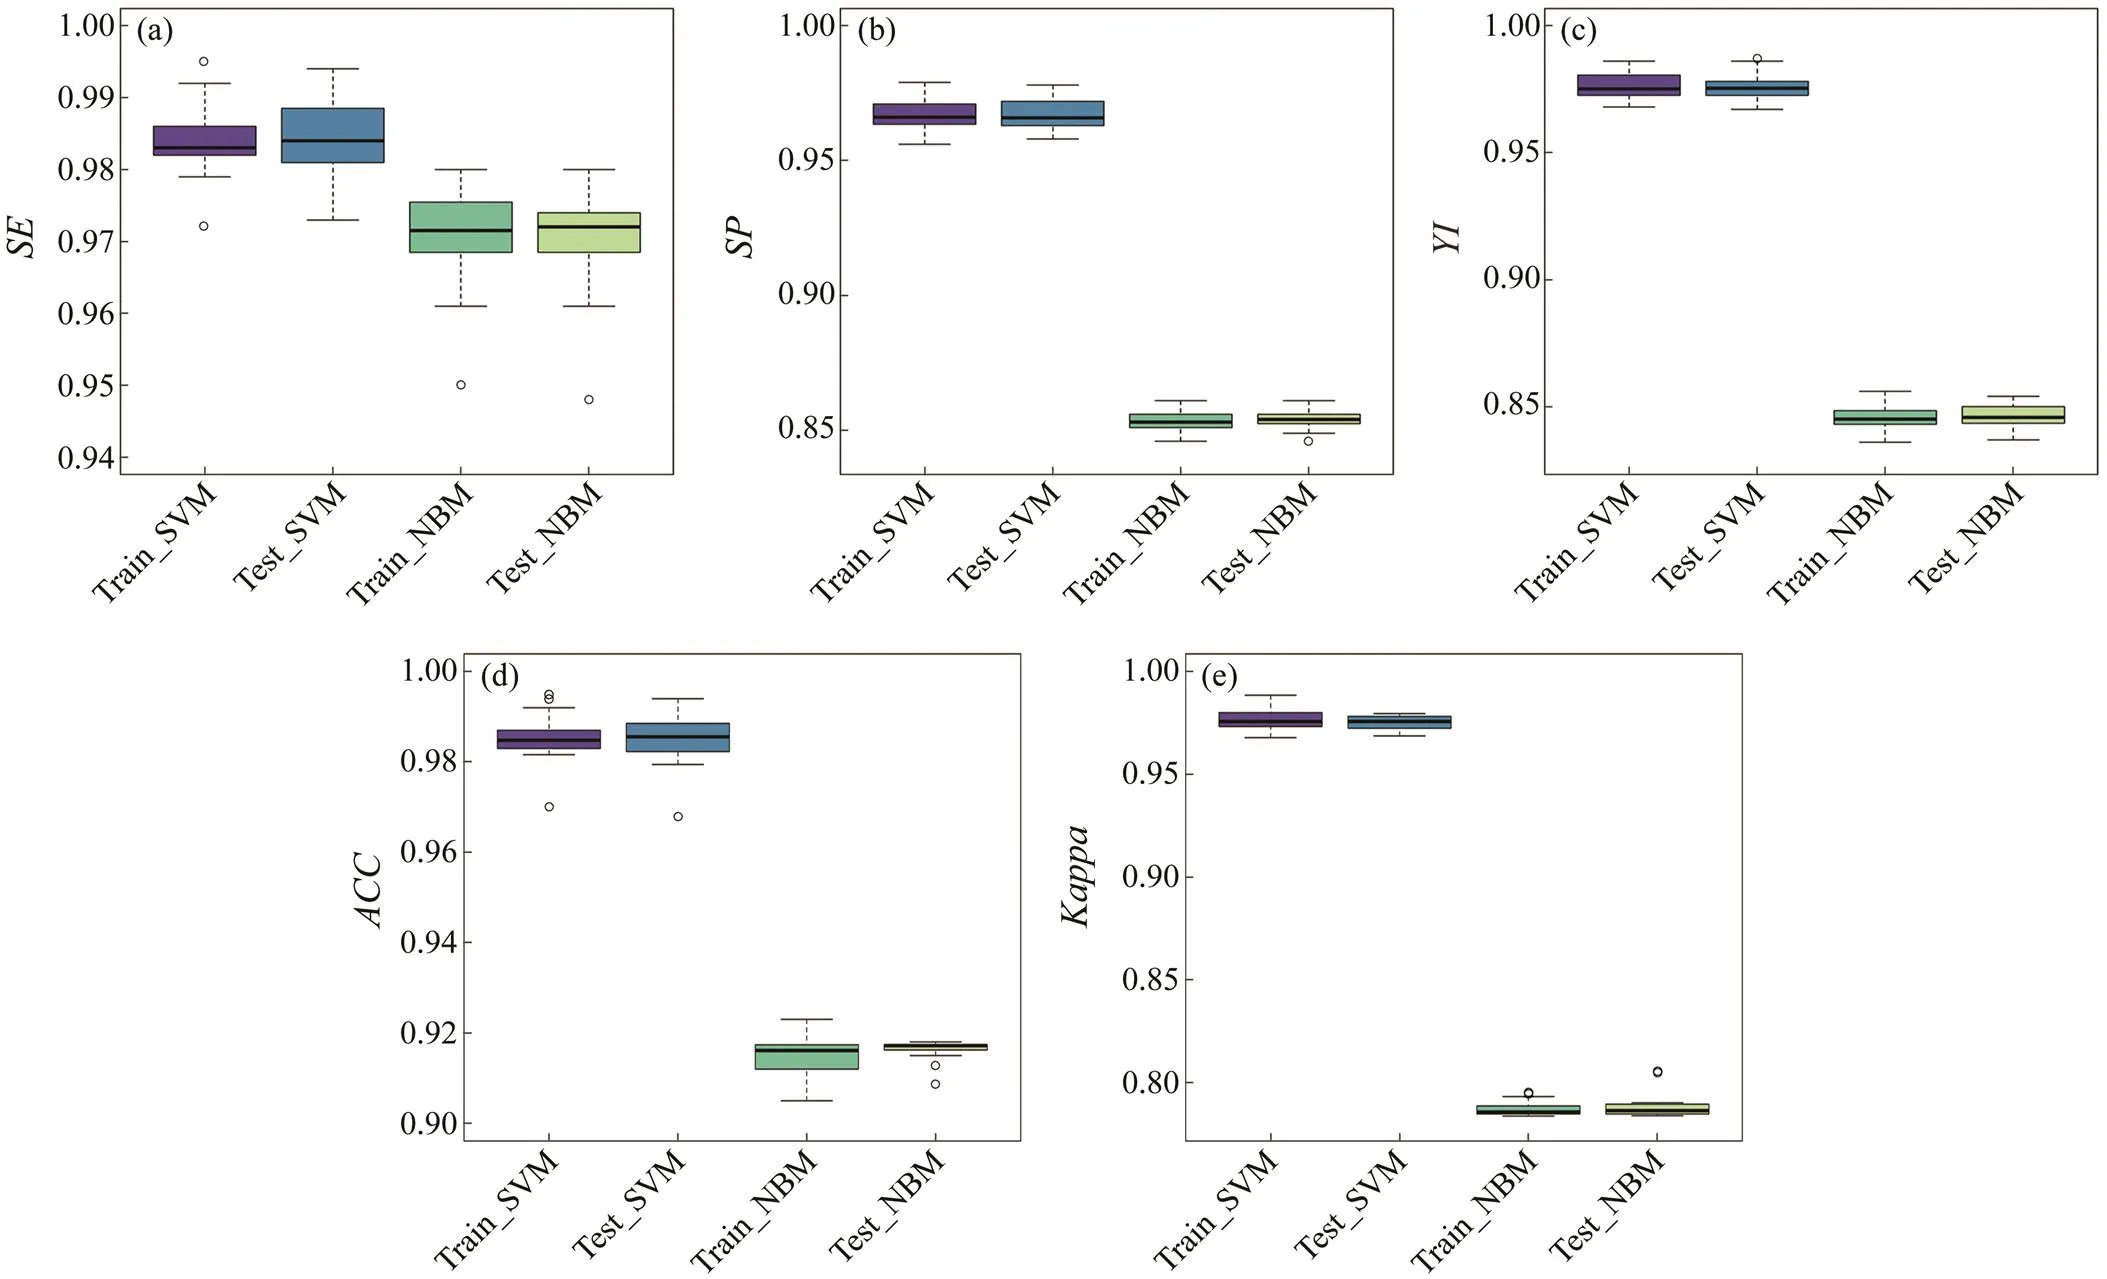
Fig.2 Performance metrics including sensitivity (SE, a), specificity (SP, b), Youden index (YI, c), accuracy (ACC, d), and Kappa coefficient (e) for NBM model and SVM model over 100 cross-validation.
The accurate spatial analysis and estimation of fishing intensity depend on the high identification ability of discri-mination models. Generally, speed is often used to identify the operation state. However, models with only ‘speed’ va-riable could easily misjudge the ‘non-fishing’ state as ‘fish- ing’ state, which brings deviation in exploring potential fish-ing locations and evaluating the fishery resources (Bertrand., 2007). In our study, based on the ‘speed’ variable, we creatively added the variables of distance of shore, distance of port, which can further improve the accuracy of the iden-tification model, and we used newer machine learning and statistical models for identification. Based on the cross-va- lidation, the constructed models SVM and NBM, using mul- ti-indices including,,,and, demon- strated strong powers of discrimination and prediction with accuracy over 90% in this study. Moreover, the SVM with higherandvalues had better performance than NBM. Our results are superior to those of previous resear- ches in which artificial neural networks, random forests and other methods were employed (Shono., 2014; Wereand Buick, 2015; Yang., 2015). By comparing the sen- sitivity and specificity of the two models, it was found that the models of both NBM and SVM had a high sensitivity, indicating that the omission rate was lower using both mo- dels. The sensitivity of SVM is higher, so the omission rate of SVM is relatively lower than that of NBM. In addition, the specificity of SVM is higher than that of NBM, indi- cating a relatively low probability of model identification error for SVM. The reason might be that the NBM has few-er estimated parameters and is not sensitive to missing data.Thus, the SVM model is more suitable for the identifica- tion of fishing state for tuna purse seine vessels.
We had detected some areas, such as 0˚–10˚S and 140˚–150˚W in January and November, 10˚S–10˚N and 140˚E–180˚ in June, 0˚ and 160˚E–180˚ from July to January, withhigh fishing intensity of purse seine which can indicate that those areas are suitable habitats for pelagic fish in the WCPO. The targets of purse seine fishing are mainly clustered pe- lagic fishes, such as tuna, mackerel and sardine. According to the source of fishing vessel data and the distribution areaof operational fishing intensity in this study, it is most like- ly that the catch object is tuna in the area with high opera- tional intensity in this study. The catches of skipjack () and yellowfin tuna () rank the first and the second in the production of purse seine operated in WCPO (WCPFC, 2020). Lehodey. (1997) found that the high production areas for skip- jack in WCPO were mainly around 5˚S–5˚N, 140˚E–175˚W in years with both normal and abnormal weather, which is generally consistent with our conclusions on the high fish- ing areas. Zhou. (2021) concluded that the areas with high abundance of yellowfin tuna resources in WCPO are in the range 5˚N–5˚S, 150˚–175˚E, which are essentially the same as the areas with high fishing intensity we have indicated. Therefore, the high-intensity fishing area in the study can be considered as the high production area for skip- jack and yellowfin tuna in WCPO.
Overfishing is regarded as the most serious threat to ma- rine organism and even to the whole marine ecosystem. Re- gional fisheries management organizations (RFMOs) had implemented many measures to prevent overfishing and combat illegal, unreported, and unregulated (IUU) fishing; however, overfishing and IUU still occur sometimes. It is largely because of high cost of monitoring fishing in thedeep sea (Pauly., 2002). Our established SVM discri- mination model used to predict fishing states of purse seinevessels based on received AIS data is a valid and useful tool with low-cost for monitoring fishing activities in the deep sea.
AIS is an automatic passive response system, and the re- ceived data are limited by the distance of the information transmitted by the vessel borne terminal to the space-based or shore-based receivers. However, bad weather of the sea and abnormal satellite network signals will affect the col- lection of AIS data, causing data sparse granularity, delay, and even data loss. This brings some challenges to the app- lication of our models. The data with wider coverage, strong er continuity, and more accuracy will helps to build models with higher performances to effectively support the iden- tification of fishing state and the calculation of fishing in- tensity. Finally, we will also collect and consider the size of fishing vessels which can affect the variables of ‘speed’ and‘heading’ to strengthen our models (Ning, 2020).
In summary, two models for identifying fishing state were established and evaluated, and the distribution of high-in- tensity fishing areas was investigated. The methods of this study may also be useful for other fishing methods. The ac-quisition and exploration of the distribution of fishing areas with high fishing intensity in this study is of great signifi- cance for fishing and fishery resources management.
Acknowledgement
This study is financially supported by the Project of De- veloping of Tuna Fishing Grounds Forecasting (No. ZD 202101-06).
Al-Hashem, M. A., Alqudah, A. M., and Qananwah, Q., 2021. Per- formance evaluation of different machine learning classifica- tion algorithms for disease diagnosis.,12 (6): 1-28, http://doi.org/10.4018/IJEHMC.20211101.oa5.
Bertrand, S., Bertrand, A., Guevara-Carrasco, R., and Gerlotto, F., 2007.Scale invariant movements of fishermen: The same for- aging strategy as natural predators., 17(2): 331-337.
Bertrand, S., Burgos, J. M., Gerlotto, F., and Atiquipa, J., 2005. Lévy trajectories of Peruvian purse-seiners as an indicator of the spatial distribution of anchovy ()., 3: 477-482.
Bez, N., Walker, E., Gaertner, D., Rivoirard, J., Gaspar, P., and Walters, C., 2011. Fishing activity of tuna purse seiners esti- mated from vessel monitoring system (VMS) data., 68 (11): 1998-2010.
Borruso, G., 2008. Network density estimation: A GIS approach for analysing point patterns in a network space., 12 (3): 377-402.
Bulashevska, A., and Eils, R., 2006. Predicting protein subcellu- lar locations using hierarchical ensemble of Bayesian classifi- ers based on Markov chains., 7 (1): 1-13.
Chen, Y. Y., Chen, X. J., Guo, L. X., Wang, R., Xiao, W. P., andXu, L. Q., 2017. Preliminary analysis of predict model of fish- ing effort spatial distribution for skipjack tuna catches by purse seine in the west-central Pacific Ocean., 39 (10): 32-45.
Cortes, C., and Vapnik, V., 1995. Support-vector networks., 20 (3): 273-297.
Dai, X. Y., Yu, X. H., and Rao, Z. Y., 2018. Research on applica- tion of pork quality detection based on near infrared spectros- copy., 39 (9): 22-26, 48.
Fred, K. H., 2000. Bias and prevalence effects on Kappa viewed in terms of sensitivity and specificity., 53 (5): 499-503.
Hoel, A. H., and Olsen, E., 2012. Integrated ocean management as a strategy to meet rapid climate change: The Norwegian case., 41 (1): 85-95.
Hu, B. H., 2013. AIS application on fishing vessels., 13 (6): 60-61, 63 (in Chinese with English ab- stract).
Jackson, J. B. C., Kirby, M. X., Berger, W. H, Bjorndal, K. A., Botsford, L. W., Bourque, B. J,, 2001. Historical over- fishing and the recent collapse of coastal ecosystems., 293: 629-637.
James, M., Mendo, T., Jones, E. L., Orr, K., McKnight, A., and Thompson, J., 2018. AIS data to inform small scale fisheries management and marine spatial planning., 91: 113-121.
Kroodsma, D. A., Mayorga, J., Hochberg, T., Miller, N. A., Boer- der, K., Ferretti, F.,., 2018. Tracking the global footprint of fisheries., 359 (6378): 904-908.
Lehodey, P., Bertignac, M., Hampton, J., Lewis, A., and Picaut, J., 1997. El Niño Southern Oscillation and tuna in the western Pacific., 389 (6652): 715-718.
Li, A. G., Ye, Z. J., and Wan, R., 2015. Model selection between traditional and popular methods for standardizing catch rates of target species a case study of Japanese Spanish mackerel in the gillnet fishery., 161: 312-319.
Li, X. E., Zhou, L., Xiao, Y., Wu, W. Z., Su, F. Z., and Shi, W., 2021. Spatial characteristics mining of fishing intensity in the northern South China Sea based on fishing vessels AIS data., 23 (5): 850-859 (in Chinese with English abstract).
Liu, S. Y., 2017. Analysis of status with utilization and conser- vation of the tuna resources in the Western and Central Paci- fic Ocean. Master thesis. Shanghai Ocean University (in Chinese with English abstract).
Longépé, N., Hsjduch, G., Ardianto, R.,Joux, R. D., Nhunfat, B., and Marzuki, M. I., 2018. Completing fishing monitoring with spaceborne vessel detection system (VDS) and automatic iden- tification system (AIS) to assess illegal fishing in Indonesia., 131: 33-39.
Mazzarella, F., Vespe, M., and Damalas, D., 2014. Discovering vessel activities at sea using AIS data: Mapping of fishing foot- prints.. Spain, 1-7.
Ning, Y., 2020. Research on the behavior identification method of fishing vessels based on deep learning. Master thesis. Lanzhou University (in Chinese with English abstract).
Oozeki, Y., Inagake, D., Saito, T., Okazaki, M., and Fusejima, I., 2018. Reliable estimation of IUU fishing catch amounts in the northwestern Pacific adjacent to the Japanese EEZ: Potential for usage of satellite remote sensing images., 88: 64-74.
Pauly, D., Christensen, V., Guénette, S., Pitcher, T. J., Sumaila, U. R., Walters, C. J.,., 2002. Towards sustainability in world fisheries., 418 (6898): 689-695.
Peel, D., and Good, N. M., 2011. A hidden markov model ap- proach for determining vessel activity from vessel monitoring system data., 68 (7): 1252-1264.
Shono, H., 2014. Application of support vector regression to CPUEanalysis for southern bluefin tunaand its comparison with conventional methods., 80: 879- 886.
Souza, E. N. D., Boerder, K., Matwin, S., and Worm, B., 2017. Improving fishing pattern detection from satellite AIS using data mining and machine learning., 11 (7): e015248.
Stevenson, H., Bacon, A., Joseph, K. M., Gwandaru, W. R. W., andPrasad, S., 2019. A rapid response electrochemical biosensor for detecting THC in Saliva., 9 (1): 12701.
Vermard, Y., Rivot, E., and Mahevas, S., 2010. Identifying fish- ing trip behaviour and estimating fishing effort from VMS data using bayesian hidden markov models., 221 (15): 1757-1769.
Wang, J. T., Cheng, Y. Q., Lu, H. J., Chen, X. J., Lin, L., and Zhang, J. B., 2022. Water temperature at different depths affects the distribution of neon flying squid () in the Northwest Pacific Ocean., 8: 1-10.
WCPFC, 2000.. Australia.
WCPFC, 2021.. Federated States of Micro- nesia.
Wei, P., Wang, X. H., and Ma, S. W., 2019. Analysis of current sta-tus of marine fishing in South China Sea., 28 (6): 976-982 (in Chinese with Eng- lish abstract).
Were, A., and Buick, D. T., 2015. Comparative assessment of sup-port vector regression, artificialneural networks, and random forests for predicting and mapping soilorganic carbon stocks across an Afromontane landsca., 52: 394- 403.
Yang, S. L., Wu, Y. M., Zhang, B. B., Zhang, Y., Fan, W., Jin, S. F.,., 2017. Relationship between fishing grounds tempo- ral-spatial distribution ofand thermocline cha- racteristics in the Western and Central Pacific Ocean., 28(1): 281-290.
Yang, S. L., Zhang, S. M., Zhou, W. F., Cui, X. S., Zhang, B. B., and Fan, W., 2020. Calculating the fishing effort of longline fishing vessel in the western and central Pacific Ocean using AIS., 36 (3): 198-203 (in Chinese with English abstract).
Yang, S. L., Zhang, Y., Zhang, H., and Fan, W., 2015. Comparison and analysis of different model algorithms for CPUE standar- dization in fishery., 31 (21): 259-264 (in Chinese with Eng- lish abstract).
Yuan, Z. H., Yang, D. H., Fan, W., and Zhang, S. M., 2018. On fishing grounds distribution of tuna longline based on satellite automatic identification system in the Western and Central Pa- cific., 40 (6): 649-659 (in Chinese with Eng- lish abstract).
Yuan, Z. H., 2019. Research on fishing grounds distribution of tuna longline based on satellite automatic identification system in the Western and Central Pacific Ocean. Master thesis. Shanghai Ocean University (in Chinese with English abstract).
Zhang, H., 2004. The optimality of Naive Bayes.. Miami Beach, Florida, 562-567.
Zhang, S., Jin, S., and Zhang, H., 2016. Distribution of bottom trawling effort in the Yellow Sea and East China Sea., 11 (11): e0166640.
Zhang, S. W., Pan, Q., Zhang, H. C., Shao, Z. C., and Shi, J. Y., 2006. Prediction of protein homo-oligomer types by pseudo amino acid composition: Approached with an improved fea- ture extraction and Naive Bayes Feature Fusion., 30 (4): 461-468.
Zhou, W. F., Chen, L. L., Cui, X. S., and Zhang, H., 2021. Effects of thermocline and space-time factors on yellowfin tuna fish- ing ground distribution in the Central and Western Pacific in abnormal climate., 23 (10): 192-201.
(September 22, 2022;
March 2, 2023;
April 18, 2023)
© Ocean University of China, Science Press and Springer-Verlag GmbH Germany 2023
. E-mail: jtwang@shou.edu.cn
(Edited by Qiu Yantao)
杂志排行
Journal of Ocean University of China的其它文章
- Effects of 5-Azacytidine (AZA) on the Growth, Antioxidant Activities and Germination of Pellicle Cystsof Scrippsiella acuminata (Diophyceae)
- Using Rn-222 to Study Human-Regulated River Water-Sediment Input Event in the Estuary
- Parameterization Method of Wind Drift Factor Based on Deep Learning in the Oil Spill Model
- YOLOv5-Based Seabed Sediment Recognition Method for Side-Scan Sonar Imagery
- A Metadata Reconstruction Algorithm Based on Heterogeneous Sensor Data for Marine Observations
- Large Active Faults and the Wharton Basin Intraplate Earthquakes in the Eastern Indian Ocean
