Using Rn-222 to Study Human-Regulated River Water-Sediment Input Event in the Estuary
2023-12-21XUYuezhiXIAOLiuGAOMaoshengYANGDisongZHAOShibinXUHaoweiWANGLishaandZHANGXiaojie
XU Yuezhi, XIAO Liu, GAO Maosheng, YANG Disong, ZHAO Shibin, XU Haowei, WANG Lisha, and ZHANG Xiaojie, *
Using Rn-222 to Study Human-Regulated River Water-Sediment Input Event in the Estuary
XU Yuezhi1), 2), XIAO Liu3), GAO Maosheng4), YANG Disong1), 2), ZHAO Shibin1), 2), XU Haowei1), 2), WANG Lisha1), *, and ZHANG Xiaojie1), 2), *
1),,266100,2),,,266100,3),,266100,4),,266071,
The implementation of the water sediment regulation scheme (WSRS) is a typical example of artificially controlling land-source input. During WSRS, the water discharge of the Yellow River will increase significantly, and so will the input of terrigenous materials. In this study, we used a natural geochemical tracer222Rn to quantify terrestrial inputs under the influence of the 2014 WSRS in the Yellow River Estuary. The results indicated that during WSRS the concentration of222Rn in the estuary increased by about four times than in the period before WSRS. The high-level222Rn plume disappeared quickly after WSRS, indicating that222Rn has a very short ‘memory effect’ in the estuary. Based on the investigation conducted from 2015 to 2016, the concentration of222Rn tended to be stable in the lower reaches of the Yellow River. During WSRS, the concentrations of222Rn in the river water increased sharply at about 3–5 times greater than in the non-WSRS period. Based on the222Rn mass balance model, the fluxes of222Rn caused by submarine groundwater discharge (SGD) were estimated to be (3.5±1.7)×103, (11±3.9)×103, and (5.2±1.9)×103dpmm−2d−1in the periods before, during, and after WSRS, respectively. This finding indicated that SGD was the major source of 222Rn in the Yellow River Estuary, which can be significantly increased during WSRS. Furthermore, the SGD-associated nutrient fluxes were estimated to be 9.8×10³, 2.5×10², and 1.1×10⁴μmolm−2d−1for dissolved inorganic nitrogen, phosphorus, and silicon, respectively, during WSRS or about 2–40 times greater than during the non-WSRS period.
222Rn; submarine groundwater discharge; water sediment regulation scheme; nutrient; Yellow River
1 Introduction
In recent years, due to the aggravation of ecological problems in estuaries, more attention has been paid to terrigenous input into estuaries. Influenced by various human activities, such as the construction of water conservancy projects, agricultural irrigation and industrial discharge, water and sediment flux and nutrient concentration in runoffs are all in dynamic changes (Milliman, 1997; Chen, 2010). For example, after the construction of the Aswan Dam, the sediment discharge of the Nile River to the Medi- terranean Sea dropped from 108tonsy−1to almost zero (Fanos, 1995). During the impoundment period of the Three Gorges Dam from 2002 to 2006, the Si/N in the Yangtze River Estuary decreased from 2.7 to 1.3, while the TN/TP increased from 22 to 80 (Chai, 2009). Estuaries are the main intermediate zone, where runoff transport terri-genous substances to the sea (Statham, 2012). They are highly sensitive to these changes (Sun, 2019; Jiang, 2020). Water and sediments from river basins are considered important substances for the evolution and development of estuaries. In recent years, human activities have induced a massive increase in riverine nutrient loads, which is considered the main reason for the series of ecological problems related to the eutrophication of estuaries in China (Li, 2016).
At present, radium isotopes have been used as powerful tracers to study terrestrial inputs in estuaries (Peterson, 2008; Xu, 2016; Wang, 2021). However, due to the small partitioning coefficient of radium isotopes in brine water (Cochran, 1986), radium concentrations are largely determined by the desorption of particulate matter (Li, 1977). As an inert gas,222Rn is less affected by particle desorption and could thus be an alternative candidate to trace riverine input in estuaries. With a half-life of 3.83 days,222Rn is a radioactive gas derived from the alpha decay of its parent isotope,226Ra. The major sources of222Rn in estuaries include the decay of226Ra in estuarine water, runoff input, SGD, and sediment diffusion (Dulaiova, 2006). There are many advantages to using222Rn as a tracer in estuaries. For example,222Rn behavior in estuaries is conservative; its half-life of 3.83 days makes it suitable to characterize oceanic processes on timescales of about 20 days, it can easily and continuously be detected at natural yet low concentrations, and its concentration in groundwater is 3–5 orders of magnitude greater than that in surface water (Burnette and Dulaiova, 2003). Based on these characteristics,222Rn has been widely applied in tracing water rock exchange, ocean-atmosphere exchange, and SGD processes in estuarine areas (Martens and Chan, 1989; Cable, 1996; Che, 2020). However, there are few reports about the geochemical behavior of222Rn in rivers, and even fewer studies have focused on tracing the influence of river input in estuaries222Rn under the impact of human activities.
The Yellow River is the second longest river in China and serves as the main source of terrestrial materials in the Bohai Sea (Fan and Huang, 2008). The Yellow River has been characterized by the imbalance of less water but more sediments, which has become increasingly severe due to the influence of human activities and natural climate change since the middle of the 20th century. To improve the water and sediment contradiction, the Yellow River Water Resources Commission has implemented the annual water sediment regulation scheme (WSRS) since July 2002 (Wang, 2005). By creating artificial flood peaks to flush the lower reaches of the Yellow River, tremendous amounts of water and sediment were transported into the Bohai Sea within a short period of time (about 2–3 weeks). According to Wang(2007), the water and sediment input of the Yellow River can reach 2/3 of the annual amount during WSRS. At the same time, water and sediment can also bring considerable loads of nutrients into the Bohai Sea, accounting for about half of the annual flux (Yao, 2009; Liu, 2012). However, there were rare reports about222Rn in the Yellow River thus far. In this study, the distributions of222Rn in the surface seawater of the Yellow River Estuary before, during, and after the WSRS event were mapped. Concentrations of222Rn in the lower reaches of the Yellow River were investigated to understand the variation of land-source input fluxes caused by WSRS. Based on the222Rn mass balance model, in 2014, the flux of222Rn and associated nutrient fluxes caused by SGD were estimated under the influence of the WSRS.
2 Method
2.1 Study Area
This study was conducted in the lower reaches of the Yellow River and the Yellow River Estuary, covering an area of 3.97×10⁹m2with an average depth of 12.63m. In 2014, three surveys were conducted in this area representing three periods: before, during, and after the WSRS. The same sampling method was adopted in each of the three surveys. Sampling details can be found in Xu(2013). Briefly, seven sections and 35 sampling stations were set up in the study area (Fig.1). The first survey was conducted from June 12 to June 14 before the WSRS. During this period, the discharge of the Yellow River ranged between 214 and 458m3s−1. The second survey was conducted between July 7 and July 9 during the WSRS, and the discharge ranged from 2360 to 3320m3s−1. The third survey was conducted between July 17 and July 20, which was right after the WSRS, when the discharge was between 283 and 384m3s−1. Surface water samples were collected for radium isotopes.222Rn in surface seawater was measuredduring each survey.
Five sampling stations, namely, LJ, YW, SL, KY, and HK, were set in the lower reaches of the Yellow River along the river channel (Fig.1). The quarterly sampling for222Rn was conducted at these stations from May 2015 to February 2016. The daily measurement of222Rn at LJ Station was conducted during the WSRS period in 2015.
Five sampling stations were set in the intertidal zone of the Yellow River Delta (Fig.1). Groundwater samples were obtained for the measurement of222Rn and nutrients by digging holes at these stations and collecting the seeping water on July 10 and July 11.
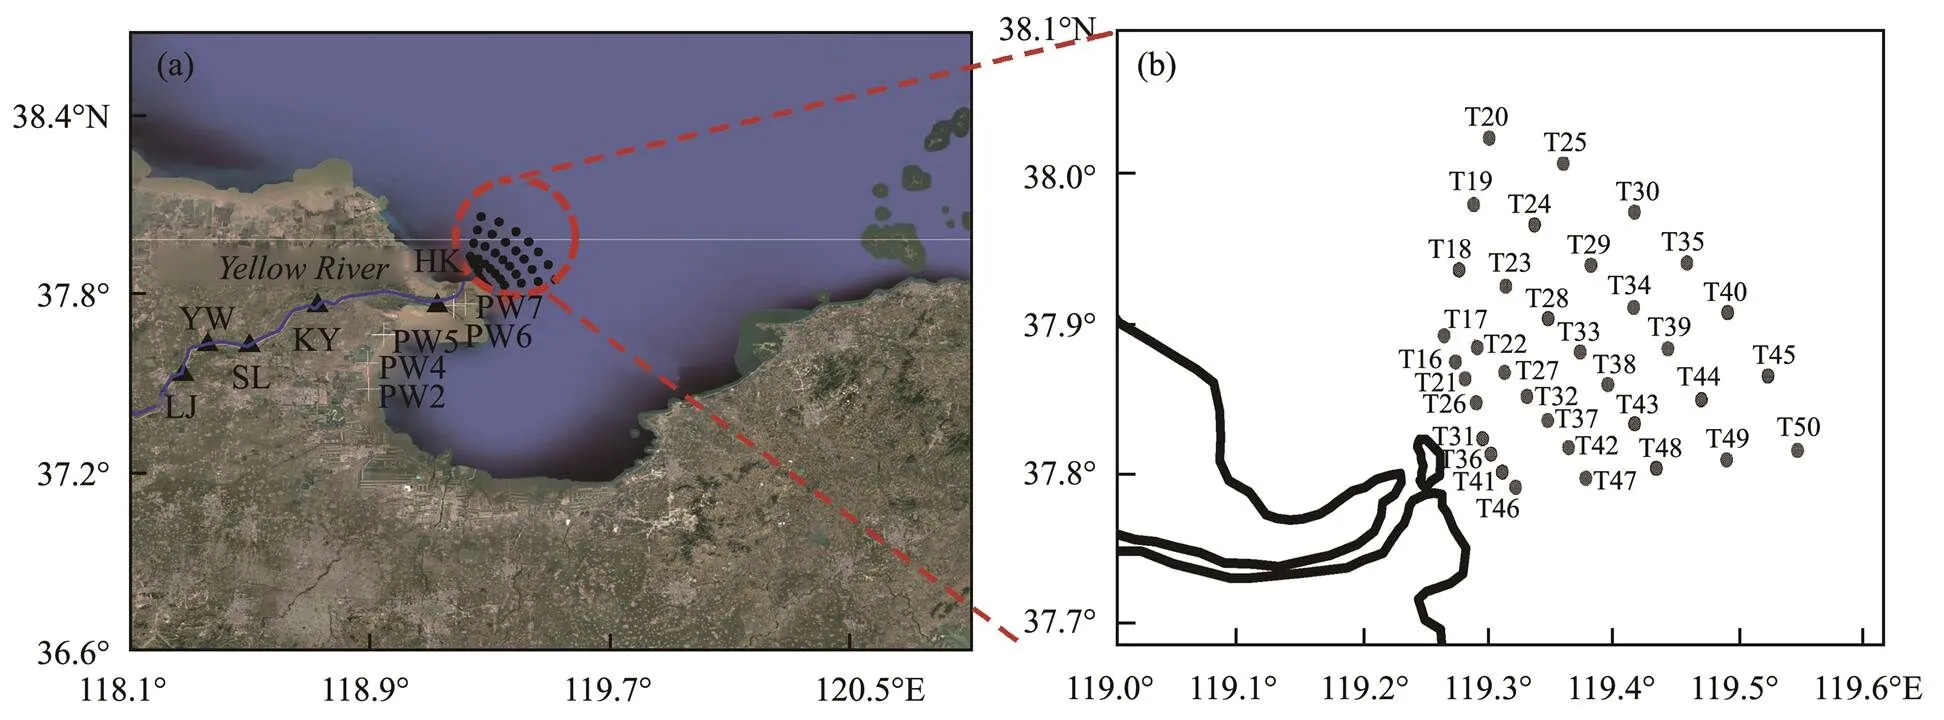
Fig.1 (a) Map of the study area in the lower reach of the Yellow River, including five stations along the river channel and five stations in the intertidal zone. (b) Sampling map in the Yellow River Estuary in 2014.
2.2 Sampling and Measurements
The temperature and salinity at each station were measured using an XR-420 model submersible multichannel conductivity-temperature-depth sensor (RBR Canada).
For224Ra, a 100L seawater sample was passed through the Mn-fiber to quantitatively and slowly adsorb dissolvedradium (water flow rate: <2Lmin−1). The salt and particulate matter on Mn-fibers were washed with radium-free wa- ter after enrichment. The fibers were then dried to a water/fiber mass ratio of about 1:1 (Sun and Torgersen, 1998; Kim, 2001).224Ra were determined using the Radium Delayed Coincidence Count (RaDeCC) system (Moore and Arnold, 1996).
For222Rn, the first step was determining surface waterusing a dual detector (RAD7, Durridge) continuous radon measurement system (Dulaiova, 2005). In the Yellow River Estuary, surveys were carried out at a speed of 3–6kmh−1. While the surface water was continuously pumped from a depth of approximately 0.5m,222Rn was separated from water through an air–water exchanger and then analyzed with two parallel RAD7s. The instrument was set to count the concentration of222Rn every 30min, after which the222Rn concentration of surface seawater at each station was finally obtained by combining it with accurate GPS positioning data. In the second step, RAD7 and the air–water exchanger were used to measure the222Rn concentration of river water in the lower reaches of the Yellow River. RAD7 was set to count every 30min and continuously measured for 2h. The data of the first 30minutes were not used as the RAD7 was not yet in a stable state during that time. The final data were converted into the concentration of222Rn in the water according to the method proposed by Lambert and Burnett (2003). In the third step, the groundwater samples were carefully placed in a 250mL sampling bottle provided by RAD-H2Oaccessories to avoid the formation of bubbles. RAD7 (Protocol: WAT-250) and aeration accessories were used tomeasure222Rn concentration.
For dissolved inorganic nutrient concentrations, groundwater water samples were filtered immediately after collection with acid-precleaned acetate cellulose filters (0.45μm), after which the filtrates were divided into three 100mL polyethylene bottles. Chloroform was added into one bottle, which was then stored at room temperature for the determination of dissolved inorganic silicon (DSi). The other two bottles were quickly frozen at −20℃ for dissolved inorganic nitrogen (DIN) and dissolved inorganic phosphorus (DIP) measurements. Nutrients were determined using a QUAATRO Continuous Flow Analyzer (BRAN+LUEBBE, Germany), and standard deviations were less than 3%.
2.3 Lab Simulation Experiment
Suspended particulate matter (SPM) is the key factor affecting the concentration of radium isotopes in water (Yang, 2019). However, whether the process of SPM regeneration would affect the activity of222Rn in water remains unknown. As the most sediment-laden river in the world, it is necessary to study the process of222Rn contributed by SPM in the Yellow River.
This study mixed tap water and filtered radium-free seawater to achieve water salinities of 0, 15, and 35, thus simulating the salinity gradient in the estuarine mixing zone. During the experiment, water samples with different salinities were sealed in 4.5L glass bottles and then purged with nitrogen gas by a bubbling device. The concentration of222Rn was detected by RAD7 in real time. RAD7 was set to count continuously every 2h for 48h to obtain the concentrations of water samples before adding the SPM. After 48h, 45g SPM was added to each water sample to achieve an SPM concentration of 10gL−1. RAD7 was still set to count continuously every 2h for 60h to obtain the222Rn concentrations of water samples after adding SPM. During the lab simulation experiment, a magnetic stirrer was turned on to ensure that the water samples were fully stirred and mixed.
3 Results
3.1 222Rn Distributions in the Yellow River Estuary
The spatial distributions of222Rn concentration in surface seawater during the three voyage surveys in 2014 are shown in Figs.2a–c, with the respective222Rn concentrations ranging from 0.25 to 1.8, 0.81 to 4.2, and 0.41 to 2.1 dpmL−1. The concentration of222Rn was at a low level before WSRS in the offshore area (Fig.2a). During WSRS, the concentration of222Rn showed an obvious increase, and there were two significantly high-value zones along the river outlets (Fig.2b). The highest value of222Rn concentration occurred in the Station T17 in the northwest part of the survey area, with an average value of222Rn concentration at 2.9±0.67dpmL−1(=4), or about four times greater than before WSRS. The distributions of222Rn concentration showed that the river water was divided into two parts by the sand barrier after leaving the mouth of the Yellow River during the WSRS and generally migrated toward the north. About 10 days after WSRS, the concentration of222Rn in the sea area quickly recovered to the normal level, and the average value was about 30% greater than before WSRS. In comparison, the case was the opposite for the224Ra, of which the high-value zone near Station T17 did not disappear after the WSRS implementation (Fig.2i). This phenomenon showed that222Rn had a very short ‘memory effect’ in this area. Therefore, the high222Rn in estuaries was caused by very recent and episodic source inputs, such as pulse river discharge or SGD.
The salinity values varied from 21 to 29 before the WSRS (Fig.2d). There was a low salinity center near Station T21 at the river mouth area, but salinity was 26 at most of the stations. Furthermore, the salinity values varied from 6 to 29 (Fig.2e) during the WSRS implementation. There were two lower salinity value zones, which mostly coincide with the high concentration zones of222Rn. The lowest value of salinity appeared in the northwest area. A lower salinity value phenomenon is direct evidence of the influence of river water. The matching of salinity and222Rn distributions proved that222Rn can effectively indicate the region of riverine input in the estuary. After the WSRS, the salinity distribution of the whole sea area was more uniform, ranging from 24 to 28. The concentration was slightly lower than before WSRS in most of the areas (Fig.2f), as the average concentration went down from 26.72±1.7 (=35) to 26.22±0.77 (=22). This result was also consistent with the222Rn result, and these two phenomena both indicated that the influence of river input in the estuary had been significantly weakened after WSRS.
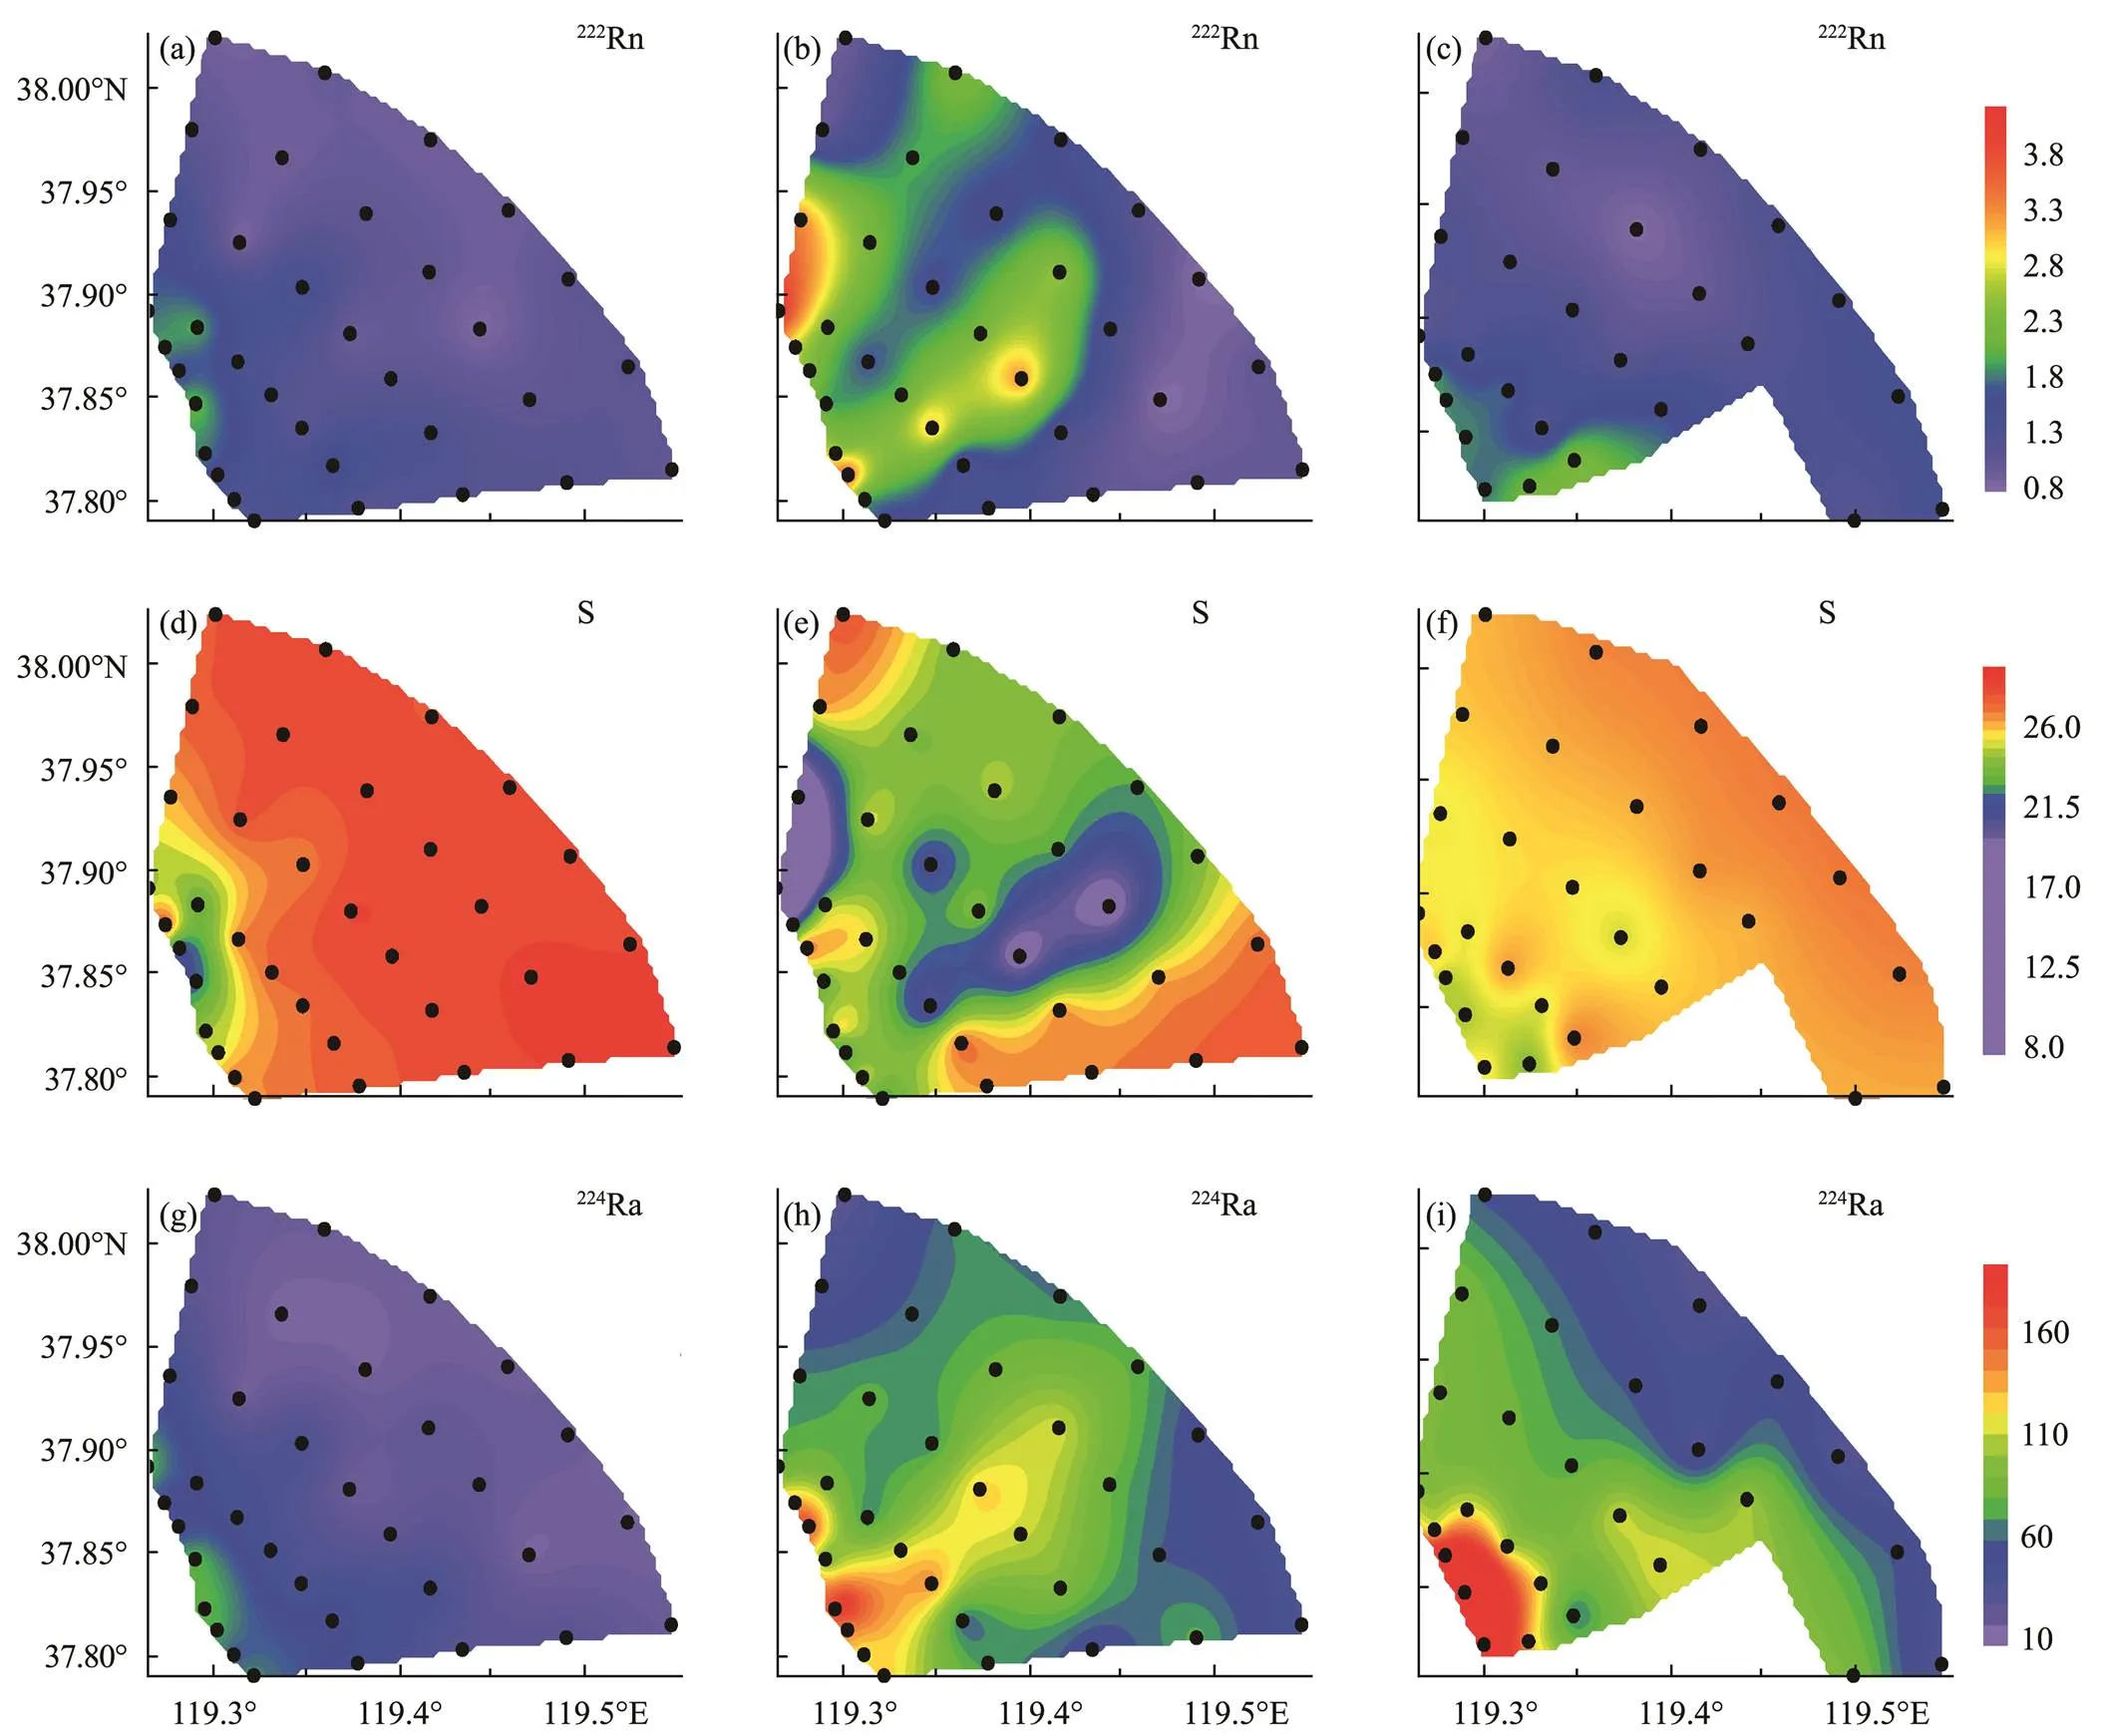
Fig.2 Spatial distributions of 222Rn (dpmL−1) (a–c), salinity (d–f), and 224Ra (dpmL−1) (g–i) in surface water before (a, d, g), during (b, e, h), and after the WSRS (c, f, i) in the Yellow River Estuary.
3.2 222Rn Distributions in the Yellow River
The distributions of222Rn concentration in the lower reaches of the Yellow River from 2015 to 2016 are shown in Fig.3. As can be seen, the concentrations of222Rn tended to be stable from LJ to HK Stations. Before WSRS implementation, the concentration varied from (1.2±0.53)–(3.9±0.51)dpmL−1, with the lowest ((1.2±0.53)–(1.8±0.66)dpmL−1) (=3) in June 2015. During WSRS (July 2015), the concentration increased sharply, which was 3–5 times greater than in the non-WSRS period. The maxi- mum reached up to 10±1.3dpmL−1(=3).
The222Rn concentrations and the river water discharge at the Station LJ during the WSRS in 2015 are shown in Fig.4. The figure shows that with the increase of the water discharge,222Rn concentrations also increased, but the peak value of222Rn concentration appeared on July 6, 3 days earlier than the peak value of water discharge. After July 6, the concentration of222Rn decreased gradually, while the water discharge continued to increase and gradually decreased after the peak on July 9.
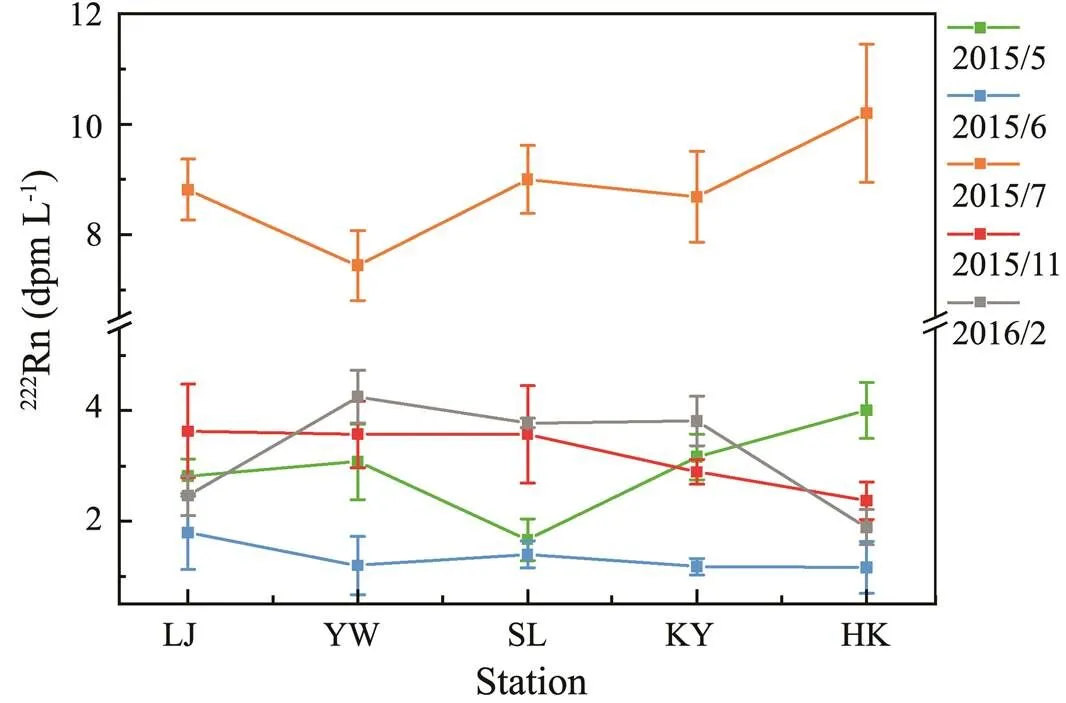
Fig.3 Distributions of 222Rn concentration along the lower reaches of the Yellow River.
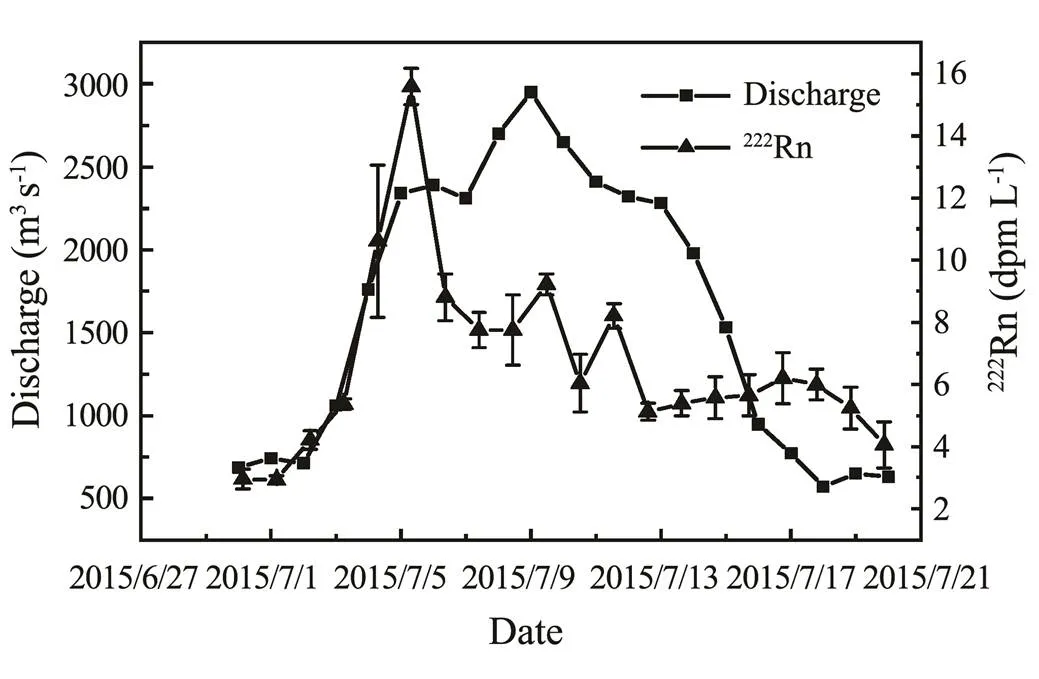
Fig.4 River discharge (m3s−1) and 222Rn concentrations (dpmL−1) at LJ Hydrological Station during the WSRS in 2015.
3.3 Results of the Lab Simulation Experiment
The results of the lab simulation experiment are shown in Table 1. Before adding SPM, the222Rn concentrations were 0.83±0.20, 0.94±0.23, and 1.5±0.40dpmL−1(=30) when the salinity levels were 0, 15, and 35, respectively. After adding SPM,222Rn concentrations changed to 0.69±0.28, 0.99±0.20, and 1.67±0.5dpmL−1(=30), respectively. The ratios of222Rn concentrations before and after adding SPM were calculated, and the values approxi- mately equaled 1. From these three SPM-adding experiments, it can be seen that SPM had no significant effect on222Rn concentration in water, indicating that SPM might not be the main source of222Rn in this study area.

Table 1 Ratios of 222Rn concentration before and after adding SPM
4 Discussion
4.1 High Concentrations of 222Rn During WSRS
First, the222Rn concentrations increased by 3–8 times in the lower reaches of the Yellow River compared with those in the non-WSRS period. This phenomenon may be due to the fact that the river discharge increased by several times than usual, and the extent of riverbed erosion was also intensified significantly, which released great amounts of222Rn from pore water into the river water. Second, why did the222Rn concentration peak appear earlier than the water discharge peak? One possible reason was that the222Rn concentration in the river water was very low when it left the last major reservoir, the Xiao- langdi Reservoir (Xia, 2015). With the increased water discharge transported downstream, more222Rn in the pore water was released into the river water. However, this process can be completed instantly, so222Rn concentrations in the river water reached a relatively high level (16±0.58dpmL−1,=3) at LJ Station. Along with the increasing water discharge, the concentrations of222Rn in river water were influenced by both high radon pore water addition and low radon reservoir water dilution. These two effects coexisted along with the atmospheric dispersion, which also led to the output of riverine222Rn. The input of pore water offsets the output caused by low radon reservoir water dilution and atmospheric dispersion. Further downstream, the situation was reversed: the pore water-releasing effect became weaker, and the dilution effect, along with the atmospheric dispersion, gradually dominated. Therefore, the peak of222Rn concentrations appeared earlier than the water discharge peak.
4.2 Sources of 222Rn in the Yellow River Estuary
Water ages at each station were calculated using a radium isotopic apparent age model (Xu, 2016), which can then be used in the budget assessment of222Rn in the Yellow River Estuary. Under the assumption that222Rn concentration was only affected by decay after entering the estuarine area from river water, its activity at the observation point should be consistent with Eq. (1), wherereflects the change rate of222Rn,andobsandirepresent the concentrations of222Rn at the observation and zero water age stations, respectively. Then the value ofshould be equal to the theoretical decay constant, which is 0.1825d−1. However, given that radon is a kind of noble gas, the atmospheric exchange would typically lead to a higher, meaning decreasing faster than decay only. Therefore, ifvalues are smaller than the decay constant, there have to be other sources contributing to the222Rn concentration in the estuary.

The theoretical decay constants of224Ra and222Rn were 0.1894 and 0.1825d−1, respectively. Before WSRS implementation, thevalues of222Rn and224Ra were 0.1499 and 0.1687d−1, respectively, in this study (Fig.5a). During the WSRS, thevalues of222Rn and224Ra were 0.1237 and 0.1533d−1, respectively (Fig.5b). It can be seen that regardless of the period, thevalues of224Ra and222Rn were smaller than the theoretical decay coefficient, especially for222Rn. Therefore, there should be other222Rn and224Ra sources, which became stronger during the WSRS. For sources of222Rn, the SPM-adding experiment results showed that SPM was not an important source of222Rn in this area, which was possibly SGD.
4.3 222Rn Flux from SGD
The222Rn flux from SGD can be calculated using the mass balance model (Martens, 1980) of222Rn, as expressed in Eq. (2). All parameters used in the equation are listed in Table 2.

At the left side of the equation are the input terms for the222Rn flux in the study area, including the Yellow Ri- ver input, SGD, SPM resolution, and integration from the226Ra decay. HereSPMis a minor source according to the SPM-adding experiment in this study. At the right side of the equation are the output terms, including decay of the222Rn, air–sea diffusion, and mixing with offshore seawa-ter.
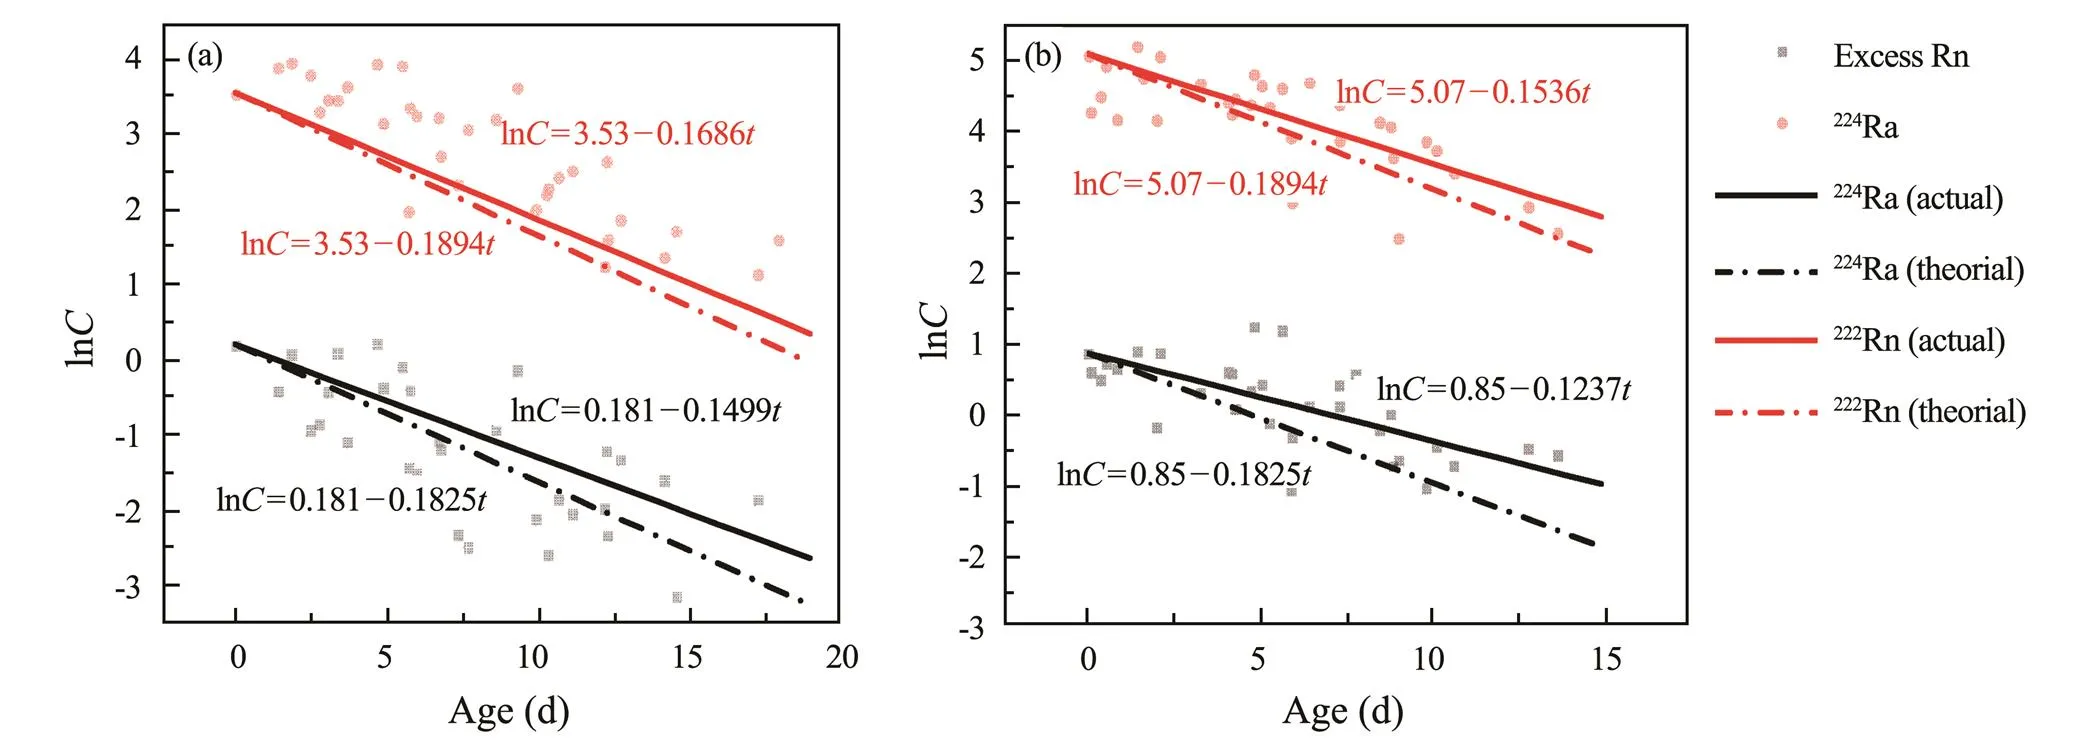
Fig.5 The comparison of K values of 222Rn and 224Ra between their theoretical decay values and actual values (a) before and (b) during the WSRS.
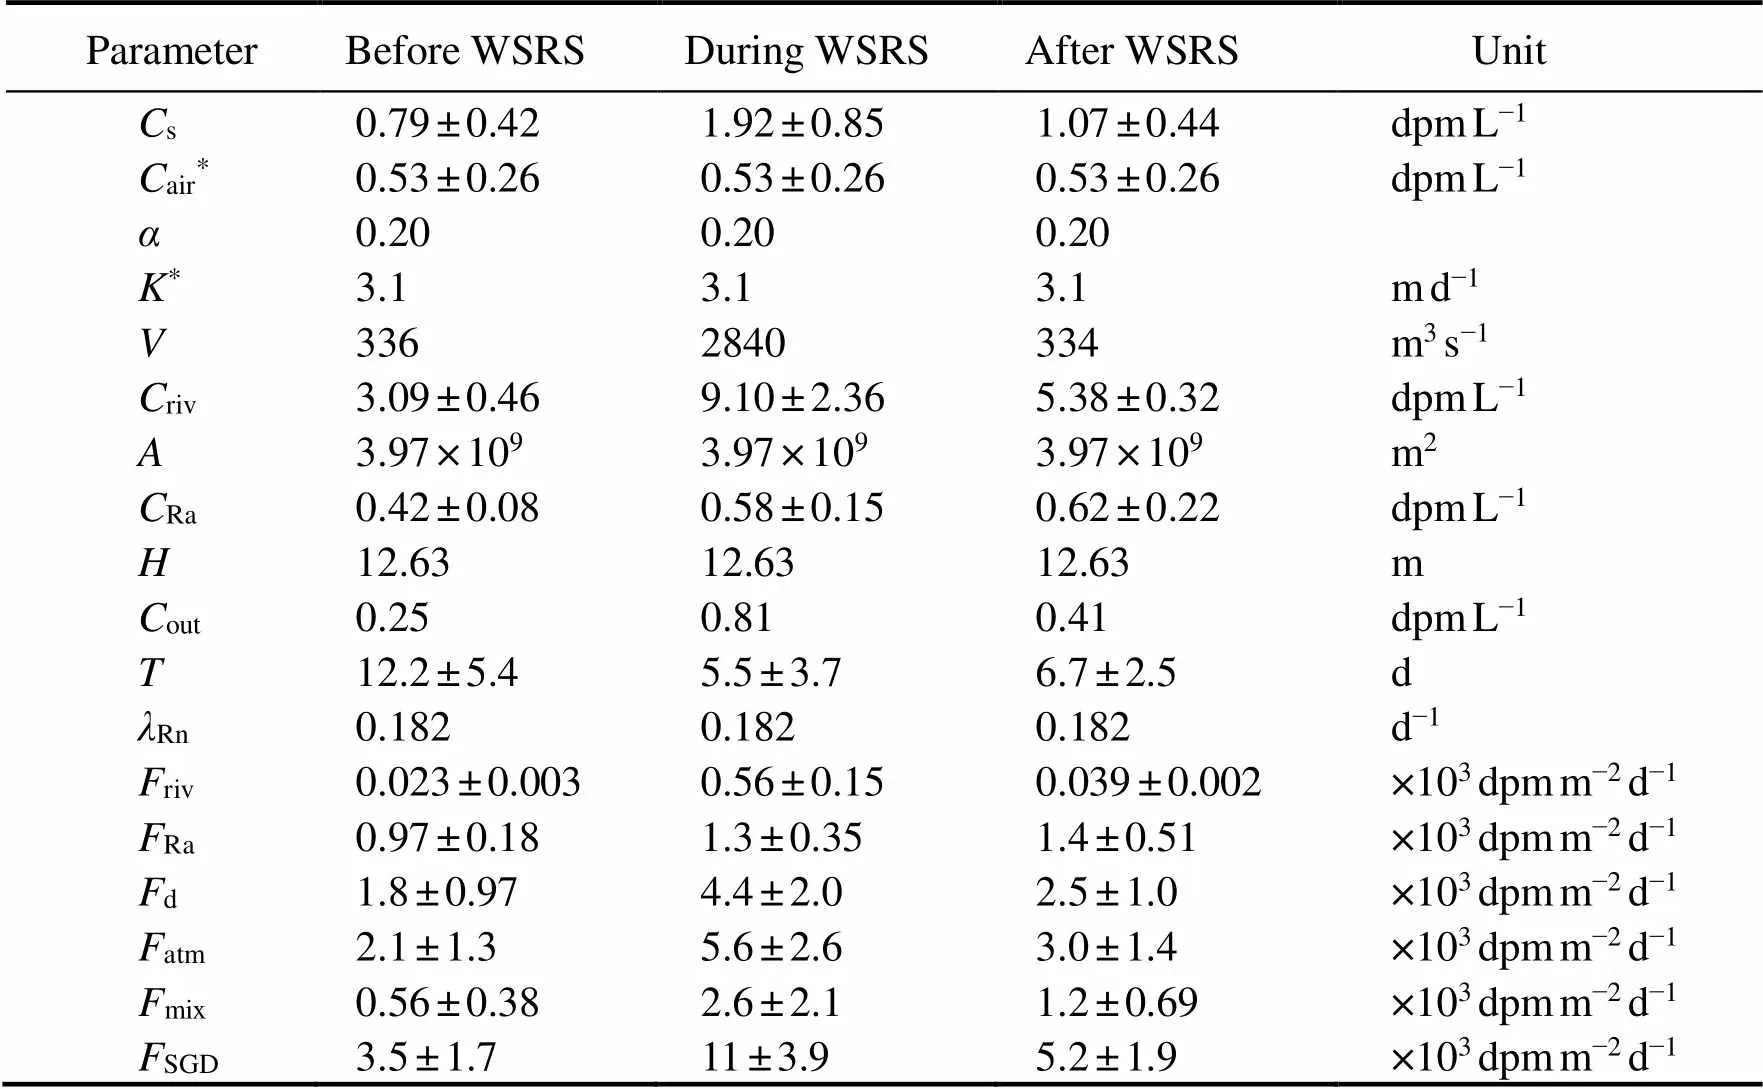
Table 2 Parameters in the 222Rn mass balance model in the periods before, during, and after WSRS in the Yellow River Estuary in 2014
Note:The values ofairandwere cited from Wang(2020a).
4.3.1 Air–sea diffusion
As inert gas with low solubility,222Rn will escape to the atmosphere through the sea-air boundary under the positive concentration gradient of222Rn between seawater and the atmosphere. The flux of air–sea diffusion can be calculated by Eq. (3) (Macintyre, 1995) as follows:

wheresis the average222Rn concentration in seawater,, 0.79, 1.9, and 1.1dpmL−1in the three voyages, respectively;airis the222Rn concentration in air;is the migration rate of gas, which is a quantity related to wind speed; andis the partition coefficient of222Rn in water and air (Wang, 2017) computed as follows:

In the equation above,is the Bunsen coefficient related to temperature and salinity (Schubert, 2012), andis the water temperature. Here,decreases with the increase in temperature if the salinity is certain. The temperature of the Yellow River Estuary in summer is the highest compared to other months of the year, which also facilitated the diffusion of222Rn from seawater into the atmosphere. During the three voyages, there was no significant difference in seawater temperature (23.5℃) and salinity (34) in the study area. Thus, the value ofwas 0.18 according to the function of Schubert(2012), and that ofwas 0.20 for all three voyages.
The decay flux and the air–sea diffusion flux both reduced with the decrease of222Rn concentration. The sea–air diffusion flux was calculated by Eq. (3), where the value ofwas 3.1 in the summer in the north Yellow Sea (Wang, 2020a). The sea–air diffusion fluxes of222Rn in the three voyages were estimated to be (2.1±1.3)×103, (5.6±2.6)×103, and (3.0±1.4)×103dpmm−2d−1, respectively.
4.3.2 Decay flux
The decay flux can be calculated by Eq. (5) as follows (Cook, 2008):

whereis the decay coefficient of222Rn, which is 0.1825, andis the average water depth in the study area, which is 12.63m. The decay fluxes of222Rn in the three voyages were estimated to be (1.8±0.97)×103, (4.4±2.0)×103, and (2.5±1.0)×103dpmm−2d−1, respectively.
4.3.3 Mixing flux with offshore water
mixwas caused by mixing with low222Rn offshore water based on Eq. (6):

wheresandoutare the222Rn concentrations of the study area and offshore seawater, respectively. We assumed that the lowest value measured in the study area is the222Rn concentration of offshore seawater, andis the water residence time (Moore, 2000). Aswas difficult to measure, the current study used the average apparent water age instead. Although both of them can be used to describe how long water remains in the river, the concepts are slightly different. ‘Water age’ refers to the amount of time a water mass experiences in an estuary after entering from a boundary, while ‘residence time’ refers to the time it takes for a water mass to leave the water body from a set starting point in the water body (Monsen, 2002). The estimated water age in the present study was the whole water age from the river mouth to the outer boundary of the whole study area, which can be approximately equivalent to residence time. The estimated water ages were calculated through the method of Xu(2016). In the current study, the values were 12.2±5.4, 5.5±3.7, and 6.7±2.5 days in the three voyages, respectively, while the corresponding mixing fluxes were estimated to be (0.56±0.38)×103, (2.6±2.1)×103, and (1.2±0.69)×103dpmm−2d−1, respectively.
4.3.4 Yellow River input
rivis the222Rn flux caused by the Yellow River input, which can be calculated using Eq. (7):
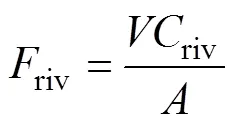
whereis the discharge of the Yellow River,rivis the222Rn concentration in river water, andis the area of the study area. Due to the high river discharge and222Rn concentration during the WSRS, the riverine222Rn flux was (0.56±0.15)×103dpmm−2d−1, which was an order of magnitude higher than that in the non-WSRS periods. However, it was still significantly lower than other input fluxes. In particular, the fluxes before and after WSRS were 22.5±3.3 and 39.1±2.3dpmm−2d−1, respectively, which were even smaller.
4.3.5 Decay flux from226Ra
Rais the input flux from the decay of226Ra, the parent of222Rn. The computing method is as follows:

whereRais the concentration of226Ra (Xu, 2016). The fluxes in the three voyages were estimated to be (0.97±0.18)×103, (1.3±0.35)×103, and (1.4±0.51)×103dpmm−2d−1, respectively.
4.3.6 Flux of SGD input
Based on Eq. (2), the fluxes of222Rn supported by SGD were calculated to be (3.5±1.7)×103, (11±3.9)×103, and (5.2±1.9)×103dpmm−2d−1in the three voyages, respectively. The results indicated that SGD was the major source of 222Rn in the Yellow River Estuary. Furthermore, comparing the three sampling periods, one can see that SGD was the most significant during the WSRS period.
4.4 Nutrient Input by SGD During WSRS
In the estuarine environment, both rivers and SGD are important pathways for nutrients being discharged into the sea. The changes in nutrient load and structure can lead to eutrophication and algal blooms. Chen(2007) pointed out that groundwater is an important source of nutrients in the Yellow River Delta. Later, Xu(2016) found that nutrient behavior changed during WSRS in this area. Nutrient flux by the SGD can be calculated by multiplying the nutrient concentration in groundwater end-member and SGD flux (Xu, 2013; Wang, 2017). Notably, this method does not take the nutrient transformation into account, so the result may be with bias (Wang, 2021). This method can be expressed as Eq. (9):
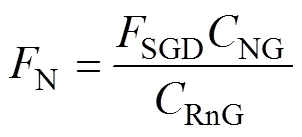
whereN(μmolm−2d−1) is the nutrient flux by SGD,SGD(dpmm−2d−1) is the flux of222Rn caused by SGD,NG(μmolL−1) is the nutrient concentration of the groundwater end-member, andRnG(dpmL−1) is the222Rn concentration of the groundwater end-member.
In this study, theRnGvalue was 184dpmL−1(Xia, 2015), and the concentration of nutrients was 193.3μmolL−1for dissolved inorganic silicate (DSi), 4.379μmolL−1for DIP, and 168.2μmolL−1for DIN. TheSGDwas (11±3.4)×103dpmm−2d−1. The calculated nutrient fluxes contributed by SGD were 9.8×10³μmolm−2d−1for DIN, 2.5×10²μmolm−2d−1for DIP, and 1.1×10⁴μmolm−2d−1for DSi. In comparison (Table 3), our result was about 2–40 times higher than that reported by Xu(2013) in the Yellow River Estuary, indicating that the WSRS can significantly affect nutrient flux associated with SGD to the sea. When comparing the nutrient fluxes associated with SGD in different regions of the Bohai Sea obtained by Zhang(2016), Liu(2017), Wang(2020a), and Wang(2020b), our result was also within the broad range.

Table 3 The comparison of the nutrient fluxes (μmolm−2d−1) caused by SGD in different regions of the Bohai Sea
5 Conclusions
In this study,222Rn was deployed as a tracer to study human-regulated river water-sediment input events in the Yellow River Estuary. Three voyage surveys were conducted in the Yellow River Estuary in 2014: before, during, and after WSRS. We also investigated the222Rn concentrations in the lower reaches of the Yellow River from 2015 to 2016, which ranged from 0.25 to 1.8, 0.81 to 4.2, and 0.41 to 2.1dpmL−1in the three voyages, respectively. During the WSRS, the222Rn concentration was about four times greater than that before WSRS. After WSRS, the222Rn concentration in the study area quickly recovered to the normal level, indicating that222Rn has a very short ‘memory effect’. Furthermore, the concentration of222Rn tended to be stable from the LJ to HK Stations in the lower reaches of the Yellow River. During WSRS, the222Rn concentrations increased sharply, which were 3–5 times greater than in the non-WSRS period. Thus, the SPM-adding experiment results indicated that SPM was not the main source of222Rn in the Yellow River Estuary.
Based on the222Rn mass balance model, we estimated the fluxes of222Rn associated with SGD to be (3.5±1.7)×103, (11±3.9)×103, and (5.2±1.9)×103dpmm−2d−1during the three voyages, respectively. Therefore, SGD was the major222Rn source in the Yellow River Estuary, which was significantly enhanced during the WSRS period. More- over, the SGD-associated nutrient fluxes were estimated to be 9.8×10³μmolm−2d−1for DIN, 2.5×10²μmolm−2d−1for DIP, and 1.1×10⁴μmolm−2d−1for DSi during the WSRS, which were about 2–40 times greater than in the non-WSRS period.
Acknowledgements
This study was funded by the National Natural Science Foundation of China (Nos. 42130410, 41876075, and 41576075). We would like to thank Dr. Dong Xia for his assistance in field sampling and measurements.
Burnett, W. C., and Dulaiova, H., 2003. Estimating the dynamics of groundwater input into the coastal zonecontinuous radon-222 measurements., 69 (1-2): 21-35.
Cable, J. E., Burnett, W. C., Chanton, J. P., and Weatherly, G. L., 1996. Estimating groundwater discharge into the northeastern Gulf of Mexico using radon-222., 144: 3-4.
Chai, C., Yu, Z. M., Shen, Z. L., Song, X. X., Cao, X. H., and Yao, Y., 2009. Nutrient characteristics in the Yangtze River Estuary and the adjacent East China Sea before and after impoundment of the Three Gorges Dam., 407 (16): 4687-4695.
Che, D., Akber, D., Bollhöfer, A., and Ping, L., 2020. Radon-222 diffusion length and exhalation characteristics of uraniferous waste rock and application to mine site remediation in the Australian wet-dry tropics., 216: 106186.
Chen, H. T., Yu, Z. G., Yao, Q. Z., Mi, T. Z., and Liu, P. X., 2010. Nutrient concentrations and fluxes in the Changjiang Estuary during summer., 29: 107-119.
Chen, J. Y., Taniguchi, M., Liu, G. Q., Miyaoka, K., Onodera, S., Tokunaga, T.,, 2007. Nitrate pollution of groundwater in the Yellow River Delta, China., 15: 1605-1614.
Cochran, J. K., Carey, A. E., Sholkovitz, E. R., and Surprenant, L. D., 1986. The geochemistry of uranium and thorium in coastal marine sediments and sediment pore waters., 50 (5): 663-680.
Cook, P. G., Wood, C., White, T., Simmons, C. T., Fass, T., and Brunner, P., 2008. Groundwater inflow to a shallow, poorly-mixed wetland estimated from a mass balance of radon., 354 (1-4): 213-226.
Dulaiova, H., Burnett, W. C., Wattayakorn, G., and Sojisuporn, P., 2006. Are groundwater inputs into river-dominated areas important? The Chao Phraya River: Gulf of Thailand., 51 (5): 2232-2247.
Dulaiova, H., Peterson, R. N., Burnett, W. C., and Lane-Smith, D., 2005. A multi-detector continuous monitor for assessment of222Rn in the coastal ocean., 263: 361-365.
Fan, H., and Huang, H. J., 2008. Response of coastal marine eco-environment to river fluxes into the sea: A case study of the Huanghe (Yellow) River mouth and adjacent waters., 65 (5): 378-387.
Fanos, A. M., 1995. The impact of human activities on the erosion and accretion of the Nile Delta coast., 11 (3): 821-833.
Jiang, C., 2020. Morphodynamic processs in the Yellow River Estuary and their responses to variation of riverine supply. PhD thesis. East China Normal University, Shanghai (in Chinese).
Kim, G., Burnett, W. C., Dulaiova, H., Swarzenski, P. W., and Moore, W. S., 2001. Measurement of224Ra and226Ra activities in natural waters using a radon-in-air monitor., 35: 4680-4683.
Lambert, M. J., and Burnett, W. C., 2003. Submarine groundwater discharge estimates at a Florida coastal site based on continuous radon measurements., 66 (1): 55-73.
Li, J. H., Zhao, J. B., Huang, W., Kong, F. L., Li, Y., Xi, M.,, 2016. Comparative bioavailability of ammonium, nitrate, nitrite and urea to typically harmful cyanobacterium., 110 (1): 93-98.
Li, Y. H., Mathieu, G., Biscaye, P., and Simpson, H. J., 1977. The flux of226Ra from estuarine and continental shelf sediments., 37 (2): 237-241.
Liu, J. N., Du, J. Z., and Yi, L. X., 2017. Ra tracer-based study of submarine groundwater discharge and associated nutrient fluxes into the Bohai Sea, China: A highly human-affected marginal Sea., 122 (11): 8646-8660.
Liu, S. M., Li, L. W., Zhang, G. L., Liu, Z., Yu, Z. G., and Ren, J. L., 2012. Impacts of human activities on nutrient transports in the Huanghe (Yellow River) Estuary., 430-431: 103-110.
Macintyre, S., Wanninkhof, R., and Chanton, J. P., 1995. Trace gas exchange across the airwater interface in freshwater and coastal marine environments. In:. Matson, P. A., and Harris, R. C., eds., Blackwell Science Ltd., Cambridge, MA, 52-97.
Martens, C. S., and Chan, J. P., 1989. Radon as a tracer of biogenic gas equilibration and transport from methane-staturated sediments., 94 (D3): 3451-3459.
Martens, C. S., Kipphut, G. W., and Klump, J. V., 1980. Sediment-water chemical exchange in the coastal zone traced byRadon-222 flux measurements., 208: 285-288.
Milliman, J. D., 1997. Blessed dams or damned dams?, 386: 325-327.
Monsen, N. E., Cloern, J. E., Lucas, L. V., and Monismith, S. G., 2002. A comment on the use of flushing time, residence time, and age as transport time scales., 47 (5): 1545-1553.
Moore, W. S., 2000. Ages of continental shelf waters determined from223Ra and224Ra., 105 (C9): 22117-22112.
Moore, W. S., and Arnold, R., 1996. Measurement of223Ra and224Ra in coastal waters using a delayed coincidence counter., 101: 1321-1329.
Peterson, R. N., Burnett, W. C., Taniguchi, M., Chen, J. Y., Santos, I. R., and Misra, S., 2008. Determination of transport rates in the Yellow River-Bohai Sea mixing zonenatural geochemical tracers., 28 (19): 2700-2707.
Schubert, M., Paschke, A., Lieberman, E., and Burnett, W. C., 2012. Air-water partitioning of Rn-222 and its dependence on water temperature and salinity.,46 (7): 3905-3911.
Statham, P. J., 2012. Nutrients in estuaries–An overview and the potential impacts of climate change., 434: 213-227.
Sun, S., Su, B., Li, F., You, L. P., Qi, Y. M., Chen, W. J.,, 2019. Effects of water and sediment discharge regulation on environment in the Yellow River Estuary and adjacent waters., 38 (3): 399-406 (in Chinese with English abstract).
Sun, Y., and Torgersen, T., 1998. The effects of water content and Mn-fiber surface conditions on224Ra measurement by220Rn emanation., 62: 299-306.
Wang, H. J., Yang, Z. S., Bi, N. S., and Li, H. D., 2005. Rapid shifts of the river plume pathway off the Huanghe (Yellow) River mouth in response to water-sediment regulation scheme in 2005., 50: 2878-2884.
Wang, H. J., Yang, Z., Saito, Y., Liu, J. P., Sun, X. X., and Wang, Y., 2007. Stepwise decreases of the Huanghe (Yellow River) sediment load (1950–2005): Impacts of climate change and human activities., 57 (3-4): 331-354.
Wang, Q. Q., Li, H. L., Zhang, Y., Wang, X. J., Xiao, K., Zhang, X. L.,, 2020a. Submarine groundwater discharge and its implication for nutrient budgets in the western Bohai Bay, China., 212: 106132.
Wang, X. J., Li, H. L., Yang, J. Z., Zheng, C. M., Zhang, Y., An, A.,, 2017. Nutrient inputs through submarine groundwater discharge in an embayment: A radon investigation in Daya Bay, China., 551: 784-792.
Wang, X. J., Li, H. L., Zhang, Y., Zheng, C. M., and Gao, M. S., 2020b. Investigation of submarine groundwater discharge and associated nutrient inputs into Laizhou Bay (China) using radium quartet., 157: 111359.
Wang, X. J., Zhang, Y., Luo, M. H., Xiao, K., Wang, Q. Q., Tian, Y.,, 2021. Radium and nitrogen isotopes tracing fluxes and sources of submarine groundwater discharge driven nitrate in an urbanized coastal area., 763: 144616.
Xia, D., Yu, Z. G., Xu, B. C., Gao, M. S., Mi, T. Z., Jiang, X. Y.,, 2015. Variations of hydrodynamics and submarine groundwater discharge in the Yellow River Estuary under the influence of the Water-Sediment Regulation Scheme., 39: 333-343.
Xu, B. C., Burnett, W. C., Dimova, N. T., Diao, S. B., Mi, T. Z., Jiang, X. Y.,, 2013. Hydrodynamics in the Yellow River Estuaryradium isotopes: Ecological perspectives., 66: 19-28.
Xu, B. C., Yang, D. S., Burnett, W. C., Ran, X. B., Yu, Z. G., Gao, M. S.,, 2016. Artificial water sediment regulation scheme influences morphology, hydrodynamics and nutrient behavior in the Yellow River estuary., 539: 101-112.
Yang, D. S., Xu, B. C., Burnett, W. C., Yu, Z. G., Gao, M. S., Jiang, X. Y.,, 2019. Radium isotopes-suspended sediment relationships in a muddy river., 214: 250-258.
Yao, Q. Z., Yu, Z. G., Wang, T., Chen, H. T., and Mi, T. Z., 2009. Effect of the first water-sediment regulation on the variations of dissolved inorganic nutrients’ concentrations and fluxes in the lower main channel of the Yellow River.,30: 3534-3540 (in Chinese with English abstract).
Zhang, Y., Li, H. L., Wang, X. J., Zheng, C. M., Wang, C. Y., Xiao, K.,, 2016. Estimation of submarine groundwater discharge and associated nutrient fluxes in eastern Laizhou Bay, China using222Rn., 533: 103-113.
(April 30, 2022;
July 16, 2022;
August 15, 2022)
© Ocean University of China, Science Press and Springer-Verlag GmbH Germany 2023
E-mail: lishawang@ouc.edu.cn
E-mail: ouczxj@163.com
(Edited by Xie Jun)
杂志排行
Journal of Ocean University of China的其它文章
- Effects of 5-Azacytidine (AZA) on the Growth, Antioxidant Activities and Germination of Pellicle Cystsof Scrippsiella acuminata (Diophyceae)
- Parameterization Method of Wind Drift Factor Based on Deep Learning in the Oil Spill Model
- YOLOv5-Based Seabed Sediment Recognition Method for Side-Scan Sonar Imagery
- A Metadata Reconstruction Algorithm Based on Heterogeneous Sensor Data for Marine Observations
- Large Active Faults and the Wharton Basin Intraplate Earthquakes in the Eastern Indian Ocean
- Carbon Nitride Quantum Dots: A Novel Fluorescent Probe for Non-Enzymatic Hydrogen Peroxide and Mercury Detection
