Analysis of Seasonal Differences of Chlorophyll, Dimethylsulfide, and Ice Between the Greenland Sea and the Barents Sea
2023-12-21ZHONGGuangshengandQUBo
ZHONG Guangsheng, and QU Bo
Analysis of Seasonal Differences of Chlorophyll, Dimethylsulfide, and Ice Between the Greenland Sea and the Barents Sea
ZHONG Guangsheng, and QU Bo*
Arctic Ocean (AO) climate is closely related to sea ice concentration (ICE) and chlorophyll_(CHL) concentrations. From 2003– 2014, the spatial average concentrations of CHL, ICE, sea surface temperature (SST), wind speed (WIND) in the Greenland Sea region (GS) (20˚W–10˚E, 70˚–80˚N) and the Barents Sea region (BS) (30˚–50˚E, 70˚–80˚N) are analysed and compared. Higher CHL was observed in BS, about 60% higher than that in GS. Compared with the northern regions of BS and GS (BSN and GSN), CHL in the southern region of BS and GS (BSS and GSS) increased by 77% and 42% respectively. More ice melting in BSN is the main reason for phytoplankton proliferation. In 2010, there was an unusual peak of CHL concentration in GSN. The seasonal peaks of CHL appeared two weeks earlier in BS than in GS. The earlier and more extensive ice melting and the persistent negative North Atlantic Oscillation (NAO) index may be the reasons for higher CHL blooms in 2010. The spatial average ICE concentration of BS in BSN and BSS is 27% and 1.2% respectively. Negative NAO in the previous winter may lead to an increase in ICE in spring. NAO has a great influence on CHL and ICE in GS. Ice melting is positively correlated with CHL, especially in GS in recent decades, CHL has a significant positive correlation with surface mass concentration of dimethylsulfide (DMS), especially in GS. As an indicator of Arctic warming, BS needs more attention from Arcticresearchers.
dimethylsulfide; chlorophyll; ice; North Atlantic Oscillation; Arctic
1 Introduction
The warming of Arctic Ocean(AO) has a significant impact on global warming. IPCC report shows that in the past 100 years, the temperature in the AO has risen almost twice as fast as the global average. With the increase of atmospheric greenhouse gas loading, the extent of the Arctic sea ice will be declined significantly (Holland, 2006; Zhang and Walsh, 2006; Stroeve., 2007; Arrigo., 2008; Budikova, 2009; Struthers., 2011; Ardyna., 2014). Due to the melting of a large amount of ice and snow, the surface albedo of the Arctic Ocean will be significantly reduced. The surface area used to reflect sunlight will instead absorbing sunlight, thus retaining more heat on the Earth’s surface. In AO, local climate change will cause changes in environmental factors such as SST and sea ice concentration. The biomass of phytoplankton will be also changed accordingly.
1.1 The Arctic Dimethylsulfide and the Relations to its Climate
Phytoplankton is the key element that produces oceanic fluxes of DMS to the atmosphere. The increase of at-mospheric greenhouse gas concentration from anthropogenic and natural sources will have potential changes to the climate system (Kloster., 2007b). The ocean response to global warming includes the increase of SST, the melting of ice and the increase of ocean stratification (Sarmiento., 2004). Charlson. (1987) proposed that the marine biogeochemical sulfur cycle can slow down the process of climate warming by exerting negative feedback on the climate. The proposed mechanism involves the sea-to-air flux of DMS, in which DMS is partly produced by phytoplankton in the ocean. Sulfate aerosols alter the amount of solar radiation reaching to the earth’s surface both by directly scattering solar energy and indirectly acting as cloud condensation nuclei (CCN). The increasing of CCN can make the clouds brighter and reflect more sunlight back to space, thus reducing the global temperature.
There are some arguments about the importance of DMS flux in climate change (Bates., 1992; Malin, 1997; Vallina., 2007), but most people agree that DMS flux has an important contribution to the global marine CCN concentrations, especially in polar region (Gabric., 2001, 2004, 2005, 2013; Levasseur, 2013; Qu., 2016b, 2017; Qu, 2021). Globally, the annual average contribution of biogenic CCN to total CCN is estimated to be 30% (Gabric., 2018). It is believed that Arctic aerosols in early spring are strongly affected by Arctic haze (Gabric., 2014; Qu., 2014, 2018). Vallina and Simo (2007) have also reported similar trends in the southern hemisphere. The contribution of Arctic biogenesis to CCN is 35% in winter and 80% in summer. It is agreed that DMS oxidation can only be an important contributor to CCNs in less polluted areas (such as AO) (Vallina., 2007).
The change of DMS sea-to-air flux under global warming scenario is simulated by climate model, and the study of the impact of DMS sea-to-air flux on climate has attracted more and more attention of many researches (Hu and Tang, 1995; Bopp., 2003; Gabric., 2003, 2004; Kloster., 2007a; Qu and Gabric, 2010; Qu., 2016b, 2020a). Gabric. (2013) studied DMS flux perturbations in the northern hemisphere and southern hemisphere (Gabric., 2013). DMS sea-to-air flux perturbation will cause the average surface temperature in the southern and northern hemisphere to decrease by 0.8K and 0.4K, respectively. The variations of direct and total radiative forcing at the top of the atmosphere are about −0.05 Wm–2and −0.48 Wm–2, respectively.
1.2 Greenland Sea and Barents Sea
The Greenland Sea (GS) is located to the west of AO, and the Barents Sea is located to the east side of AO. GS is one of the few areas in the world’s oceans where deep convective mixing occurs. In between is Norwegian Sea. The ocean current has a complex physical process, where warmer and high salinity North Atlantic waters flowing from the south are mixed with the colder, low salinity Arctic waters flowing from the north (Fig.1). During deep convection, more carbon dioxide can be transported deeper (Rey., 2000).
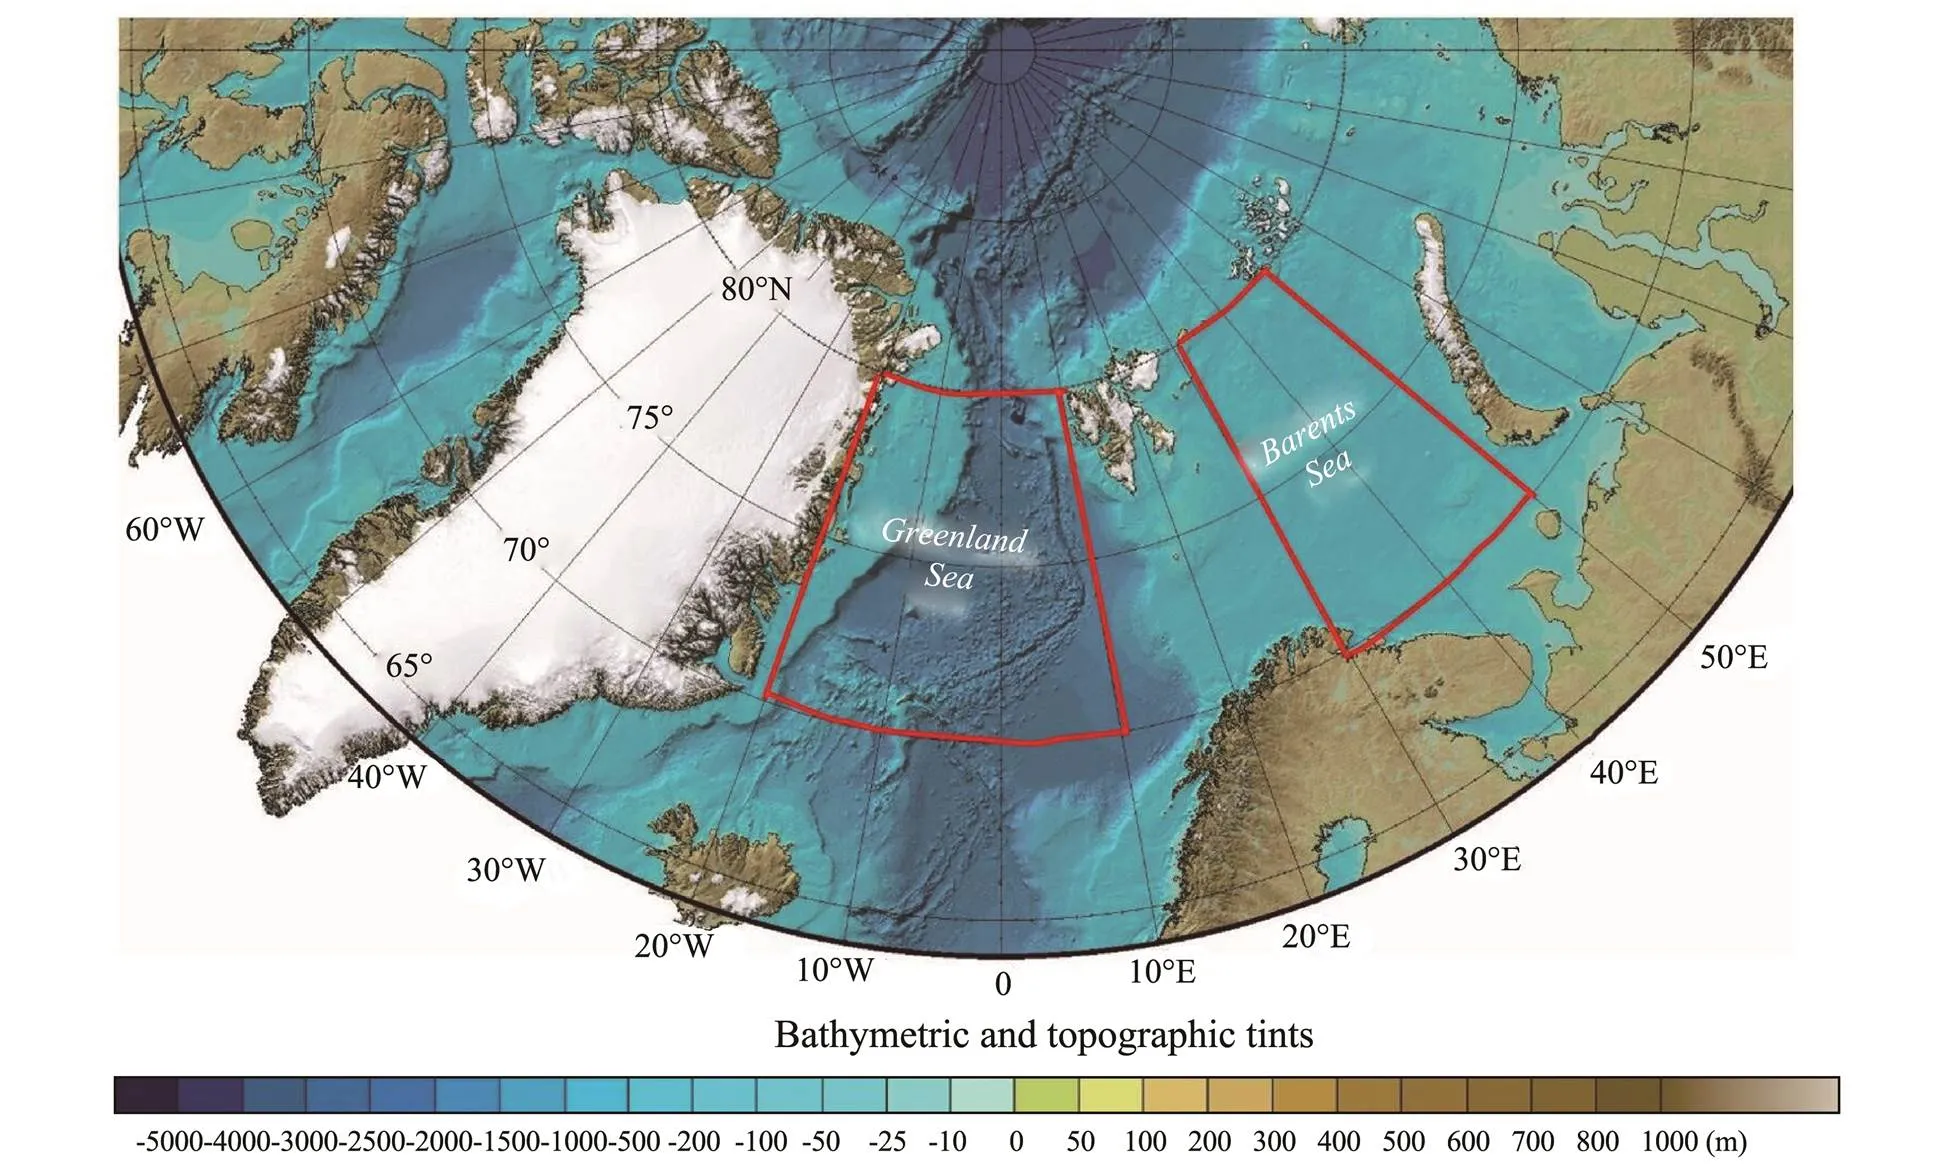
Fig.1 Map of the study region. Greenland Sea (GS) and Barents Sea (BS) are enclosed in red frames within AO.
The Barents Sea (BS) is a shallow marginal sea of AO. BS is located north of the Arctic Circle. The sun is always below the horizon in winter, but above the horizon in summer (Slagstad and Stole-Hansen, 1991). The Norwegian coastal current enters the Barents Sea from its west and may be stabilized by fresh water runoff. Melting ice releases fresh water in the northern region, forming a stable water column (Slagstad and Stole-Hansen, 1991). BS is an Arctic shelf sea with highly productivity, and its marine ecosystem is subject to rapid and substantial climate-driven impacts (Neukermans., 2018). It is also an important fishery region (Dalpadado., 2014), and the AO has the highest regional primary and secondary production (Slagstad., 2011).
BS is a high-yielding continental shelf sea, and its primary production accounts for almost 40% of total production of the Arctic continental shelf (Arrigo and van Dijken, 2015). The phytoplankton community in spring is mainly composed of diatoms and Phaeocystis pouchetii in both GS and BS (Rey and Loeng, 1985; Oziel., 2017). These algae may accumulate in the upper water body at the peak of the bloom period (Balchen, 1980). The upper water column is affected by land runoff and sea ice melting water. Below 150m, the impact of the North Atlantic current and increase in warm and salty water can be recognized (Lara, 1994).
1.3 North Atlantic Oscillation (NAO)
The NAO is an important mode of variability in the northern hemisphere, which is described as an indicator of the seesawing intensity of the mid high latitudinal air flow in the North Atlantic, especially with the atmospheric mass displacement between Iceland and the Azores (Hurrell and Deser, 2009). Positive NAO conditions in the AO cause ice to be lower than average value, and the temperatures rise related to the enhancement of atmospheric and oceanic heat transfer (Wang and Ikeda, 2000; Liu., 2004; Yamamoto, 2006). NAO changes will affect the regional phytoplankton dynamics. Strong and Magnusdottir (2011) concluded that in the Northeast Atlantic, positive NAO index often produces negative sea ice anomaly in the Barents Sea, which in turn leads to negative NAO.
The correlations among CHL, ICE, SST and NAO have been studied for the Barents Sea (Qu., 2020b) and Greenland Sea (Qu., 2018). However, there is a lack of comparison between GS and BS. Here, we compare the ten-year variation of CHL, ICE and SST distributions in GS and BS. The correlation between CHL, ICE with NAO is studied. In addition, the regional DMS surface mass concentration is compared with CHL.
2 Study Area and Data Methods
The study region is divided into two sub-regions: GS (20˚W–10˚E, 70˚–80˚N)and BS (30˚–50˚E, 70˚ –80˚N)(Fig.1). Time range is within 2003–2014. The 8-day time series of CHL is retrieved from the MODISA (Aqua), Level-3, mapped archive (https://oceancolor.gsfc.nasa. gov/). SST and WIND are retrieved from the Remote Sensing Systems (RSS) archive at http://www.remss.com/ as weekly data. ICE is obtained from http://iridl.ldeo.co- lumbia.edu/SOURCES/.NOAA/.NCEP/.EMC/.CMB/.GLOBAL/.Reyn_Sm ithOIv2/ (Reynolds, 2002). Ice melt is calculated by subtracting from the current week to previous week’s ICE. The NAO 8-day time series is calculated by averaging the daily NAO data from the National Weather Service Climate Prediction Center: https://www. cpc.ncep.noaa.gov/products/precip/CWlink/pna/nao.shtml (van den Dool., 2000). Monthly mean map of DMS surface mass concentrations is from MERRA-2 Model M2TMNXAER v5.12.4. Map images of DMS were produced based on Giovanni online retrieval system (https:// giovanni.gsfc.nasa.gov/giovanni) (Acker and Leptoukh,2007).
3 Results
3.1 Regional CHL Distributions
The annual regional spatial average of CHL in GS and BS during 2003–2014 are calculated and the average CHL in BS is generally higher than that in GS. Compared with GS, CHL in BS increased by 70% and 50% respectively, in 2013 and2014.
Fig.2a plots the 8-day spatial average of CHL for GS and BS. The CHL peaks of BS and GS appeared on day 136 and 144, respectively. The peak of CHL peak in BS is nearly 60% higher.
The annual average CHL time series of the southern and northern regions of BS and GS from 2003 to 2014 were compared (Fig.2b). BSS and BSN represent southern and northern of BS respectively. GSS and GSN represent the southern and northern of GS respectively. CHL in BSS increased significantly. The lowest CHL occurs in the GSS. In BSS, The CHL in 2010, 2011 and 2013 was much higher than that in other years. Compared with other years, 2011 is the year with the highest CHL in BSS. Table 1 shows the annual growth rate of the whole region from BSN to BSS, GSS to BSS, GSS to GSN and GS to BS. The average growth rate from BSN to BSS is around 79%, and the average growth rate from GSS to BSS is about 100%. The average growth rate from GSN to GSS is only 11.4%, and the mean increase rate from GS to BS is around 50%. The highest growth rates are indicated in red in the Table 1. In 2011, the growth rate from GSS to BSS was the highest (about 187%). This resulted in an increase of about 109% over GS in the entire BS area. In 2010, the growth rate from GSS to GSN was the highest, at 36%, and the growth rate from GSS to BSS was 185.7%. In 2003 the growth rate from BSN to BSS was 179.71%. It decreased until year 2013, the rate increased to 143.51%. Contrary to the meridional gradient of most northern hemisphere (such as BS), the CHL concentration in the southern region is higher than that in the northern region. Except for 2006 and 2007, the CHL concentration in the northern region (GSN) of GS is higher in most of years. The cause of the spike CHL in GSN are studied in Qu. (2016a), although the growth rate from GSS to GSN is much lower than from BSN to BSS.
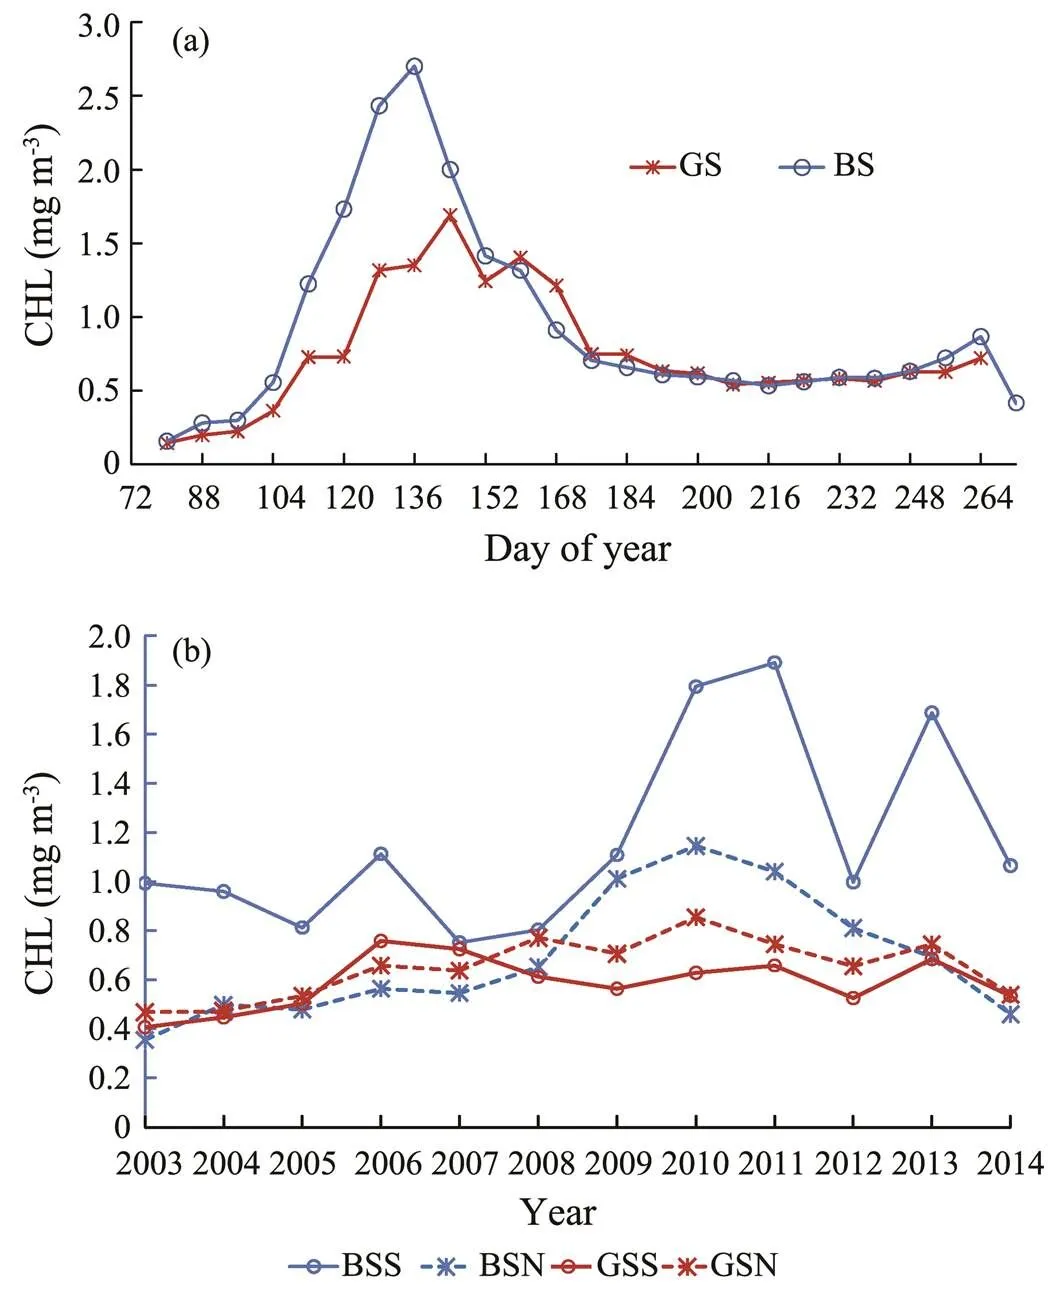
Fig.2 (a), Regional mean CHL comparison for GS (20˚W– 10˚E) and BS (30˚–50˚E); (b), Yearly mean CHL compari- sons between the southern and northern regions of GS and BS.
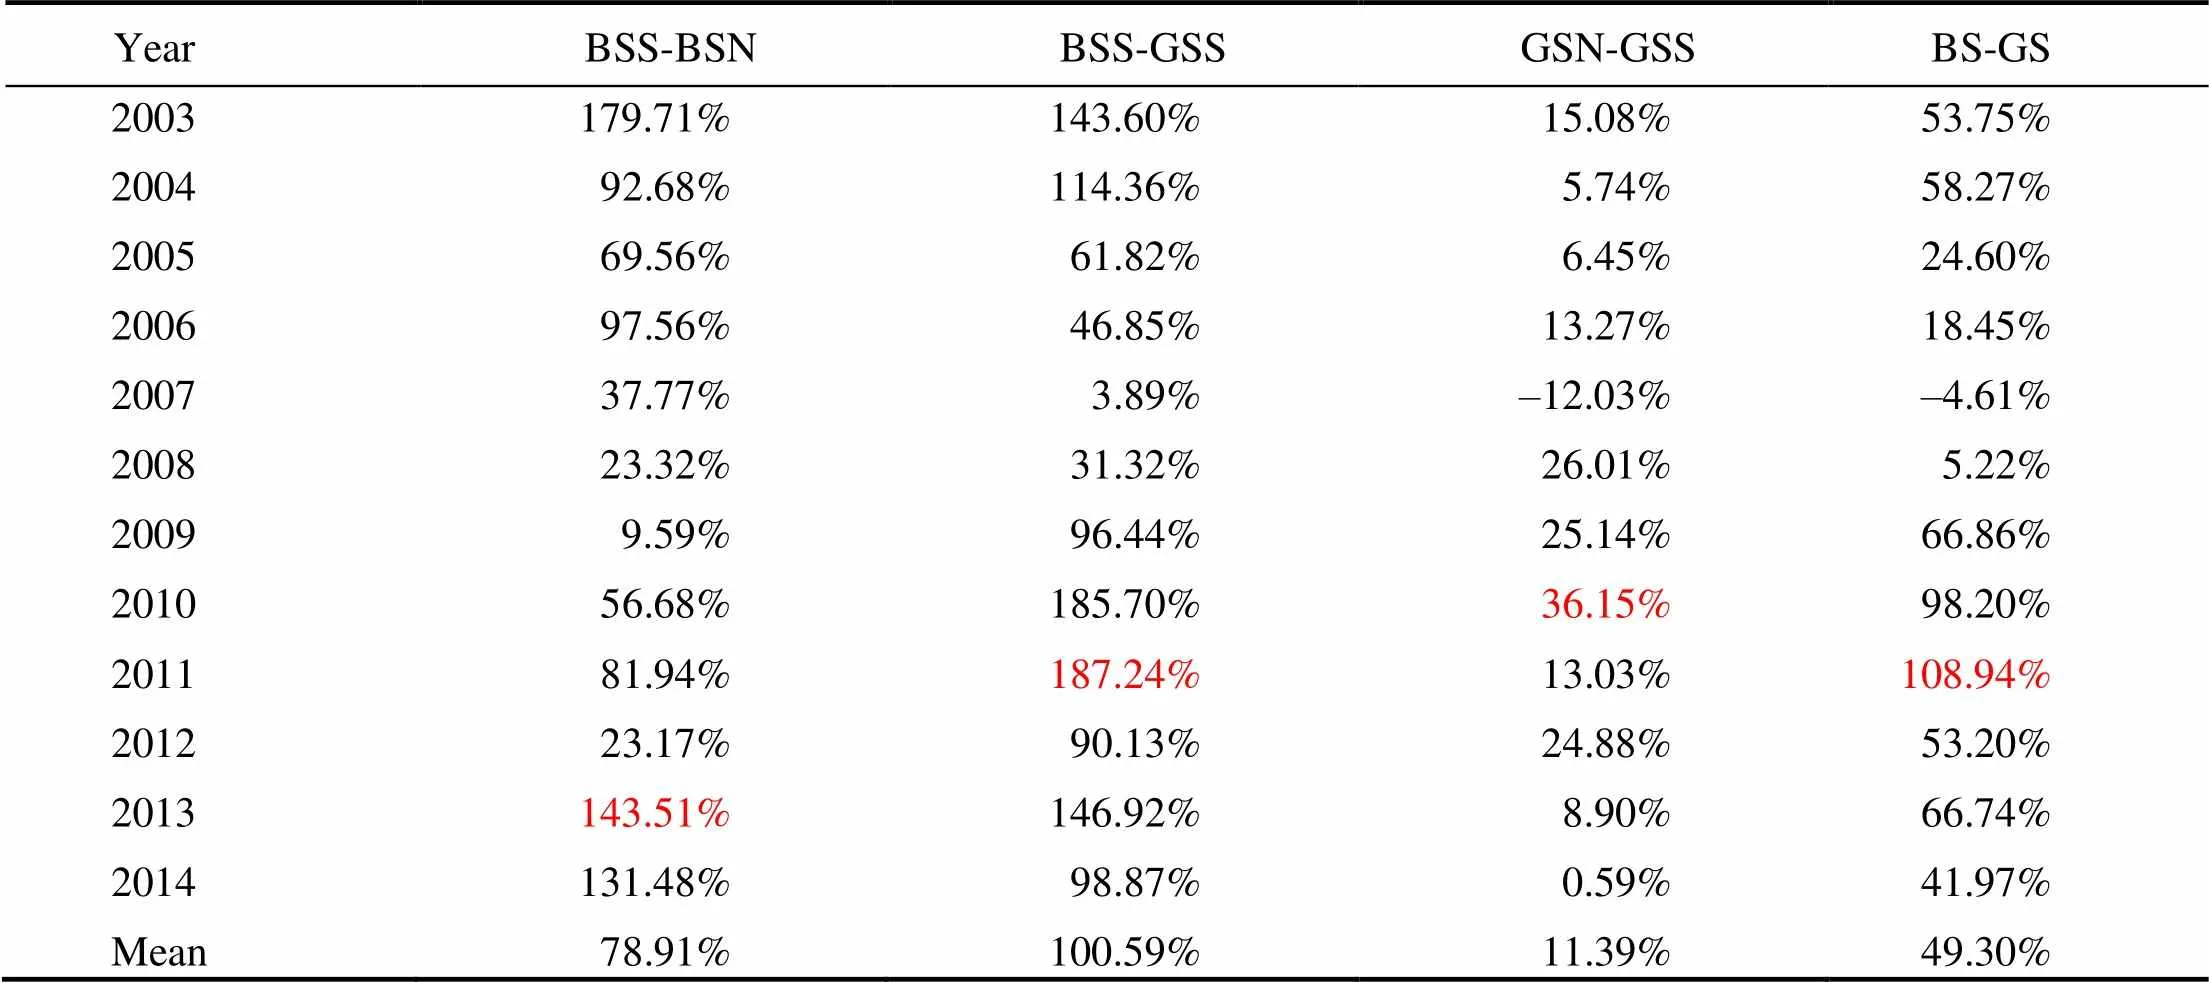
Table 1 Increase rates of annual mean CHL from GS to BS
CHL peak occurred earlier in BSS than BSN. The CHL peaks of BSS and BSN occurred on day 128 and day 144, respectively. The CHL peaks of GSN and GSS appeared on day 152 and 168, respectively.
It is found that the position of CHL blooms started from the eastern and southern regions of BS and gradually shifts to the western and south-western regions. However, in GS, the CHL bloom started from the northern region and the western coast and then spread further to the northwest of GS (not show in figures). CHL blooming in BS was much stronger than that in GS. The earlier increase of CHL in GSN is due to the consistent of nutrient in coastalregion caused by glacial melting waters and river runoff (Moline., 2008).
Fig.3 shows the average CHL time series for the southern and northern regions of BS from 2003 to 2014. The error bar represents the standard deviation in BSS and BSN, the peak values of CHL were 3.37mgm−3(day 136) and 2.32mgm−3(day 144). The annual average CHL of BSS and BSN (from day 72 to 272, from March to September) were 1.12 and 0.68mgm−3respectively.
Special years (such as 2009, 2010, 2011, 2012 and 2013) are selected to conduct a detailed study in BS (Fig.4). The peak values of BSS in 2010 were higher than those in other years. The CHL peak of BSN in 2010 is even higher than that of BSS (more than 9mgm−3). In BSS (Fig.4a), the earliest small peak appeared on day 112 in 2011, and then a fairly early related peak appeared on day 122. There were triple peaks in 2011. In 2013, there was an earlier and longer high peak on days 120–128. Peak in 2009 was on day 152. The peak in 2012 was low. In BSN (Fig.4b),there were also earlier and higher double peaks in addition to the highest peak of CHL in 2010, there were also earlier and higher double peaks in 2011. The peak in 2009 is still relative late. The peak in 2012 occurred on day 136. The peak in 2012 was not as low as the peak in BSS. The peak value of BSS was low in 2013.
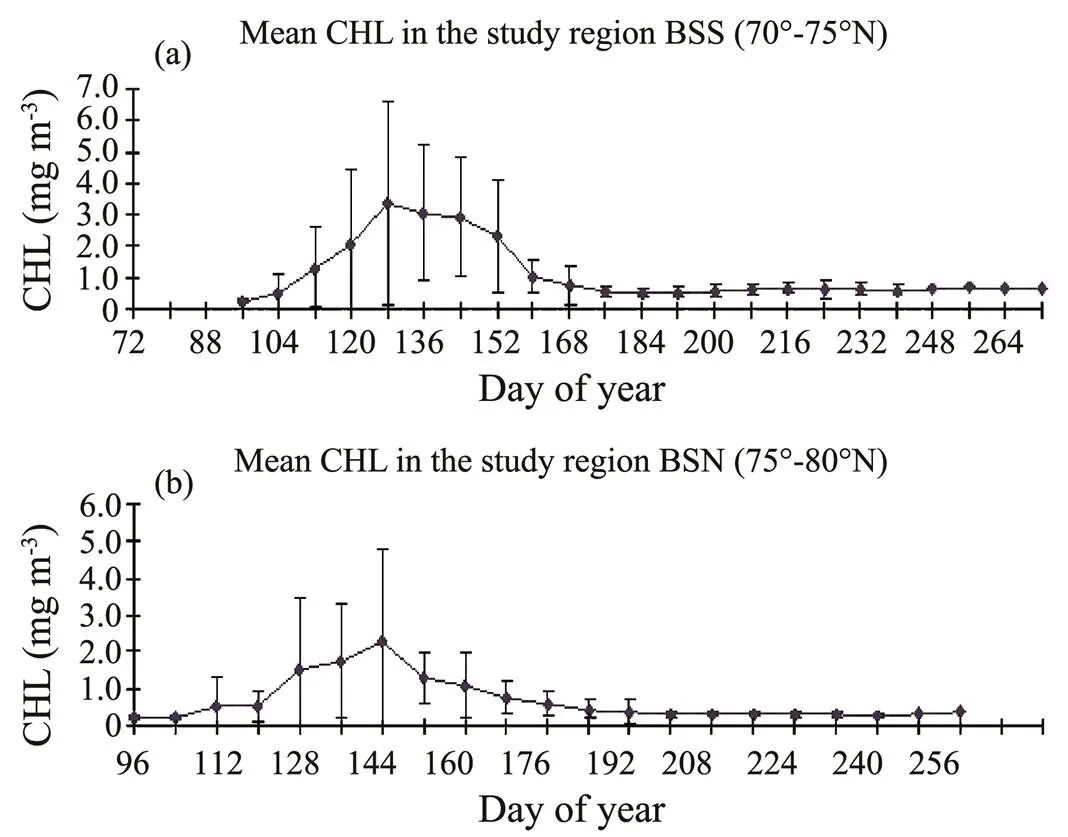
Fig.3 Spatial mean CHL time series for the (a) southern and (b) northern regions of Barents Sea.
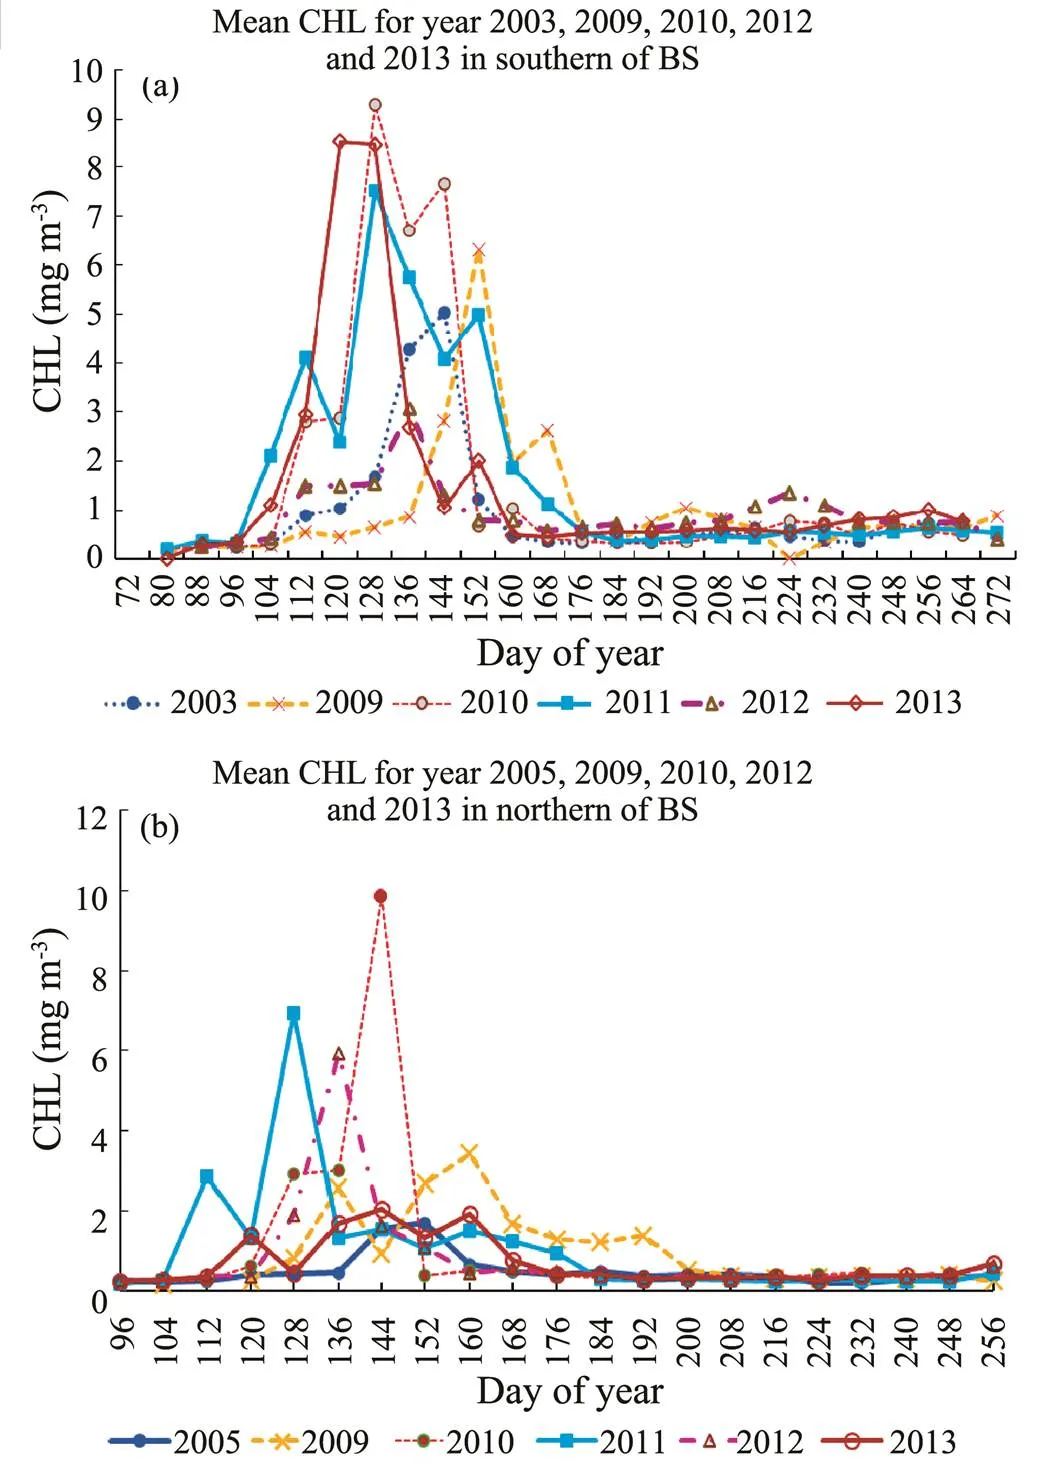
Fig.4 Mean CHL for (a) southern region (b) northern region of 2009, 2010, 2011, 2012 and 2013.
We compared the decadal spatial mean CHL time series between GS and BS in the south and north of the study region from 2003 to 2014 (Fig.5). BS peaked at day 136 and GS peaked at day 144. Compared with the northern region, the average CHL of BSS and GSS increased by 77% and 42%, respectively.
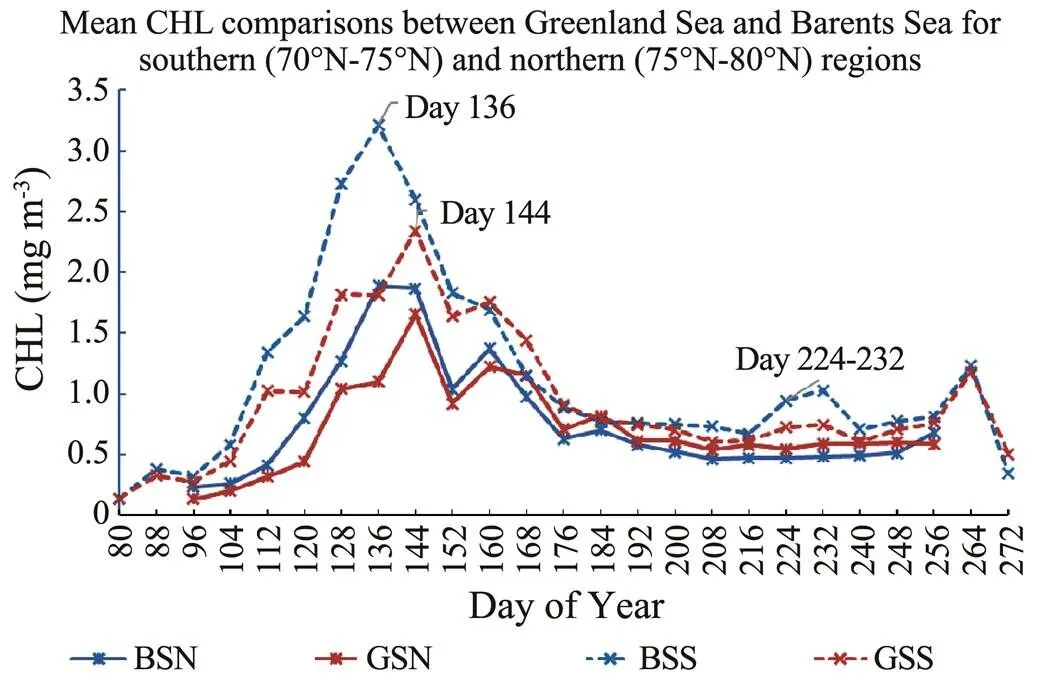
Fig.5 Mean CHL comparisons between southern and nor- thern regions of Barents Sea and Greenland Sea.
The sea ice concentration, SST and NAO were studied, and the reasons for the increase of CHL in 2010, 2011 and 2013 were clarified.
3.2 Sea Ice Concentration Distributions (ICE)
Fig.6a shows the average ice cover (ICE) in the southern and northern regions of GS and BS from 2003 to 2014. The bar graph (Fig.6a) clearly shows that there was more ICE occurred in the northern regions of GS and BS. Before the 144th day, ICE of BSN was even higher than that of GSN. However, from day 152, the ICE in GSN was much higher. Compared with BSN, the ICE peak value of GSN was later. In the GSS, the ICE in this area was much lower (lower than 20%). Less than 4% of the ice was left in the BSS. After the 136th day of BSS, ICE almost disappeared.
The highest average ICE of BSN can reach 93%. Fig. 6b shows the ICE time series in the BSN from 2003 to 2014.There was less ice melting in 2003 than in other years.The figure shows significant ice melting in the spring of 2010 and 2013. The ICE began to be low in 2006, and fell immediately after the 80th day.
Average ice melt is calculated by subtracting the ICE of previous week from the current week. Fig.6c compared ice melting between the 2010 and 2003–2014 average. From the 104th day, ice melting was almost positive. Compared with the average amount of ice melting in 2003–2014, the amount of ice melting in 2010 was much higher. On the 152nd and 160th days, the ice melting in 2010 was 76.5% and 60% higher than the average ice melting respectively.
In 2003 and 2004,the amount of ICE was relative high, but since 2005, the amount of ICE has decreased in most years (not show in the figure). The amount of ICE in BS was slightly higher in 2010 and 2011. The difference was significant. The average ICE of BSN and BSS were 27% and 1.2%, respectively. In spring of 2010, BSS had almost no more ICE (11.22%) which was unusual.
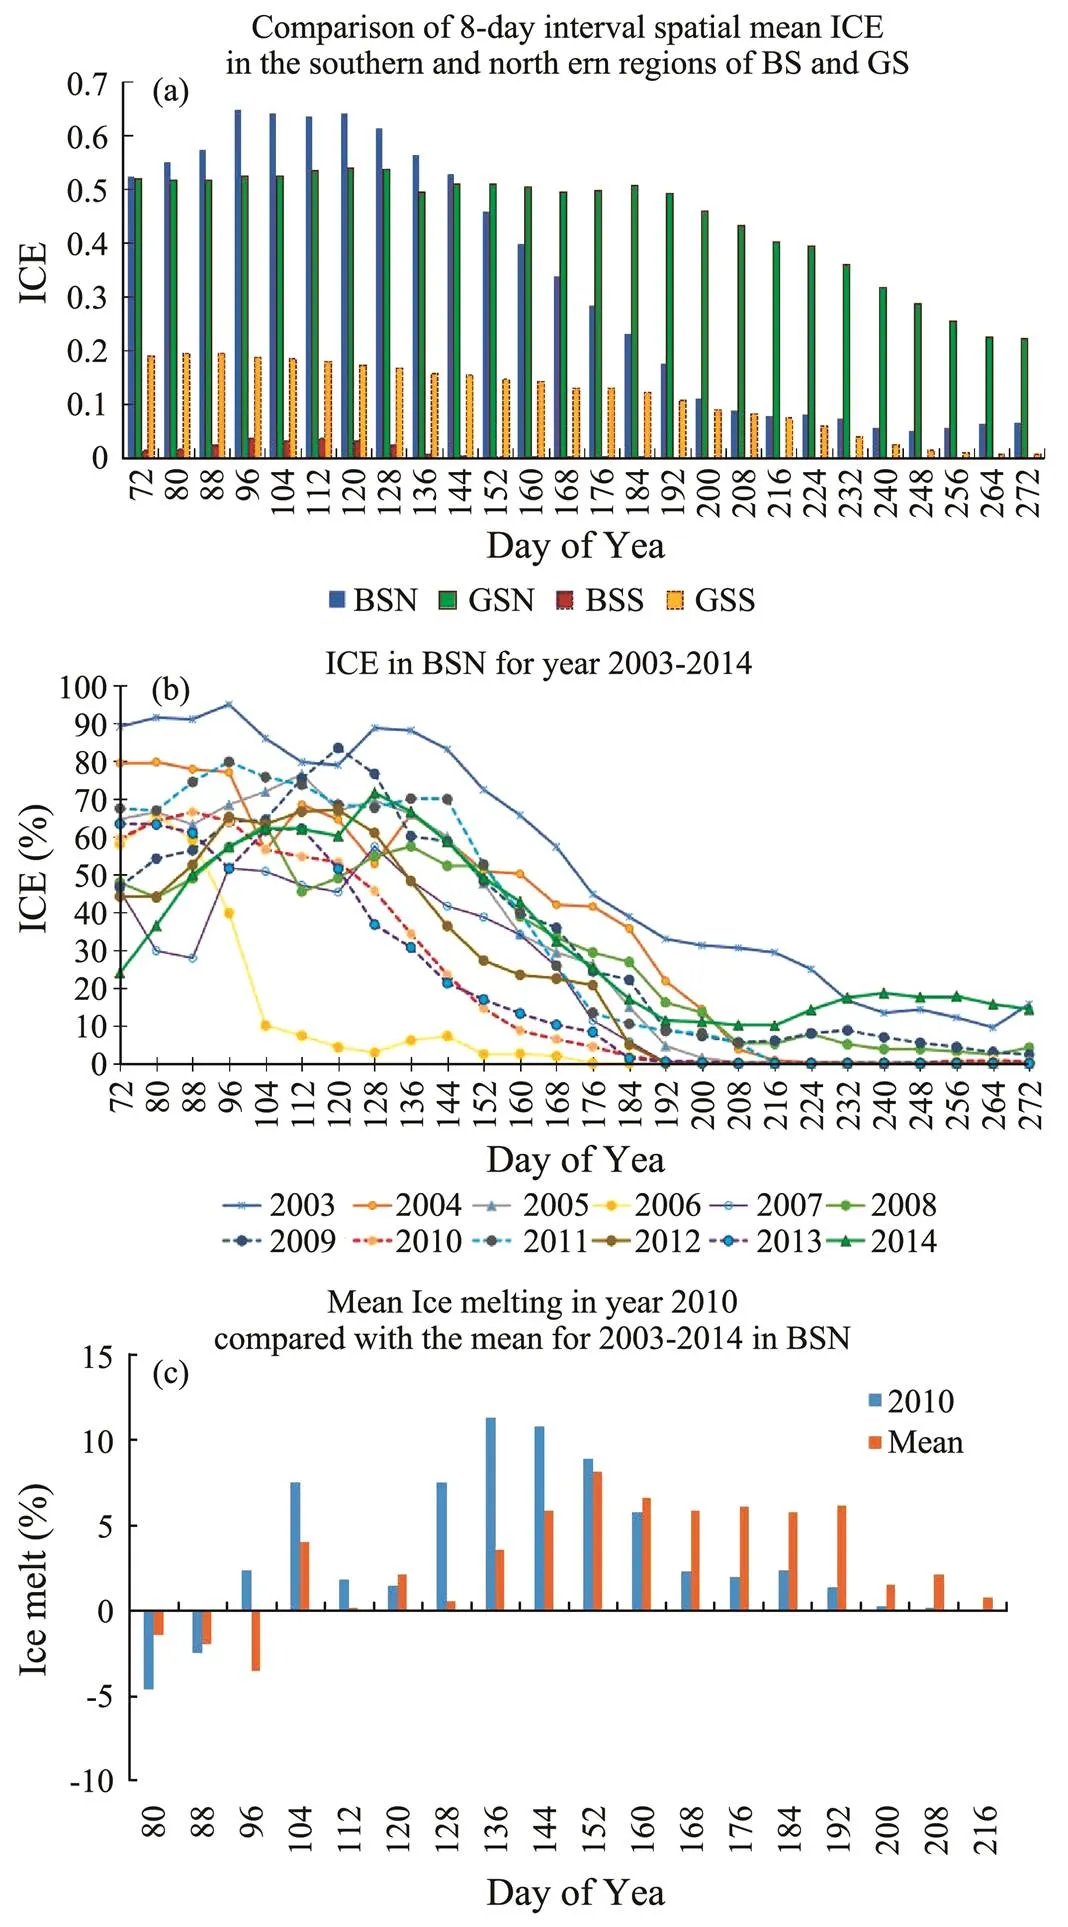
Fig.6 (a) Mean ICE comparisons among GS and BS, (b) mean ICE time series for 2003 to 2014 in BSN, (c) Ice melting in year 2010 compared with the mean ice melting from 2003 to 2014 in the study region.
3.3 Sea Surface Temperature (SST) and Wind Speed (WIND) Distributions
Peaks SST in 2003–2014 were in August and exhibited normal distributions. SST in 2013 was higher than other years. SST was the lowest in 2003. From 2003 to 2014, the SST growth rate in our study region was 140%. Fig.7 shows the inter-decadal comparison of GS and BS mean SST in the southern and northern regions. The SST peak occurred in day 224. In general, the highest area of SST is in BSS and the lowest area is in BSN. The difference between GSS and GSN is smaller than that of BS, The difference between GS and BS in the south and north is 0.52℃ and 2.66℃ respectively.
There was no significant difference in WIND between GS and BS. The WIND is strong in winter, especially from January to February. There was a low WIND in summer. From 2003 to 2014, the average WIND of GS and BS was 7.4ms−1and 7.5ms−1respectively. WIND could reach to 12ms−1in winter and 5ms−1in summer. WIND in the northern region of BS was relatively higher than that in other regions (not show in the figure).
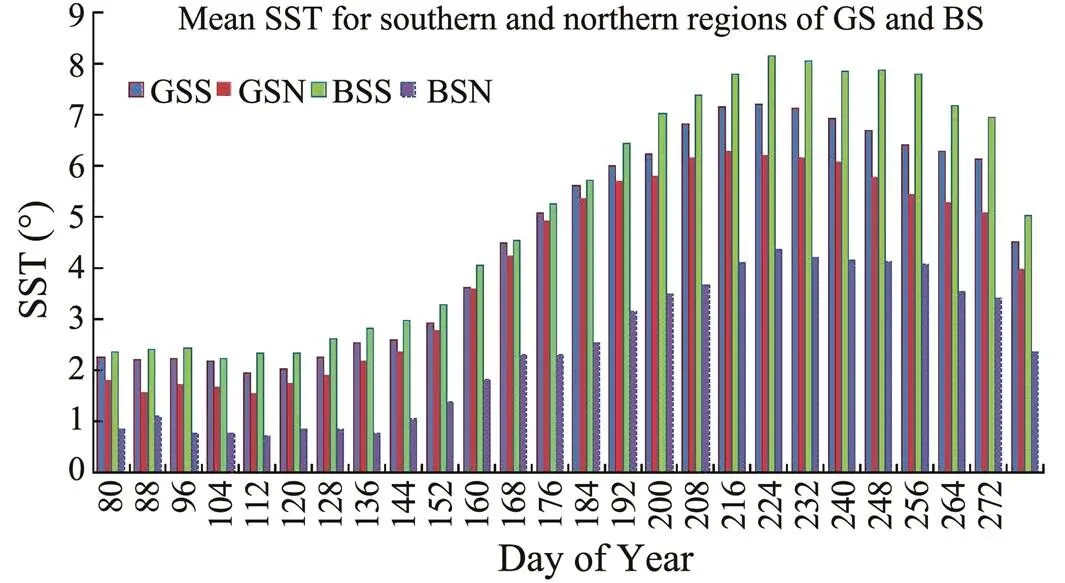
Fig.7 Mean SST for southern and northern regions of GS and BS.
3.4 Extended Time Series of DMS and CHL
The extended average time series from 2003 to 2020 were calculated for CHL and DMS of GS and BS (Fig.8). We calculated the times series from March to September. In general, CHL concentration in BS is higher than that in GS. There is a positive correlation between CHL and DMS in GS (Table 2). From 2003 to 2020, the average correlation coefficient of GS is 0.53 and that of BS is 0.27. The GS correlation coefficients in 2005, 2008, 2013 and 2017 exceeded 0.7. The BS correlation coefficients in 2005, 2009, 2015 and 2018 exceeded 0.5. In 2013, there was not much correlation between CHL and DMS in BS, but there was a rather high coefficient (0.7) in GS. Table 2 indicates the CHL and DMS correlations of GS and BS are inconsistent. The correlation between CHL and DMS in BS is not significant. It may be that the time lag between CHL and DMS in BS is larger than that in GS. The peak value of DMS is usually only one month later than CHL in GS (Fig.8a), but the peak value of DMS may be two months later than CHL in BS (Fig.8b). If the peak time of DMS was advanced by one to two months, the correlations between CHL and DMS might be as high as 0.9 or more in BS and GS (not show in table). Our findings are consistent with previous studies (Park., 2013), that is, when they studied in the Atlantic and Arctic Oceans, the correlation between CHL and DMS during blooming season was 0.89.
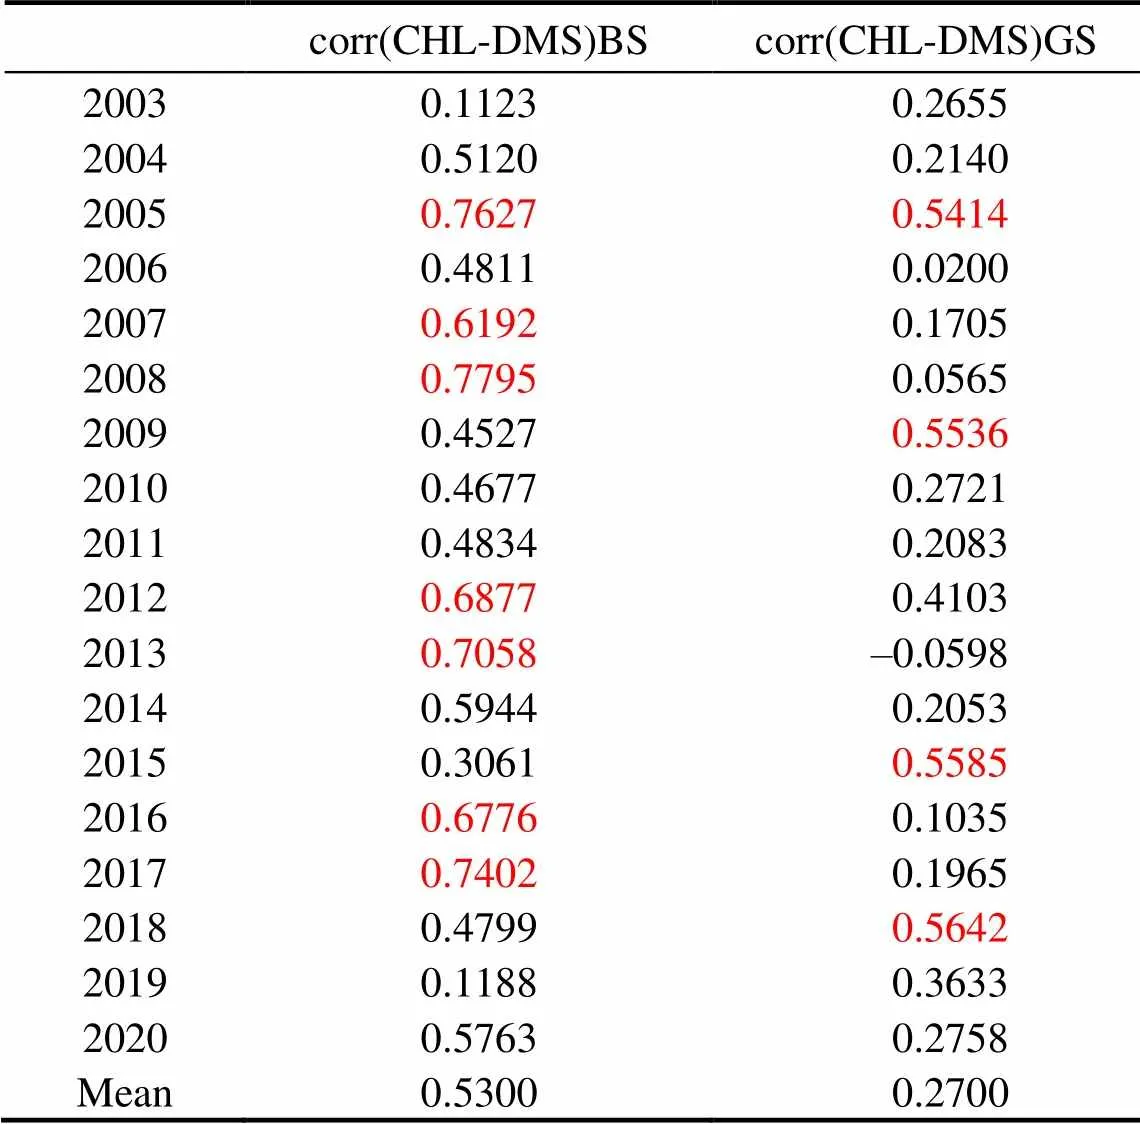
Table 2 Correlations of CHL and DMS in BS and GS
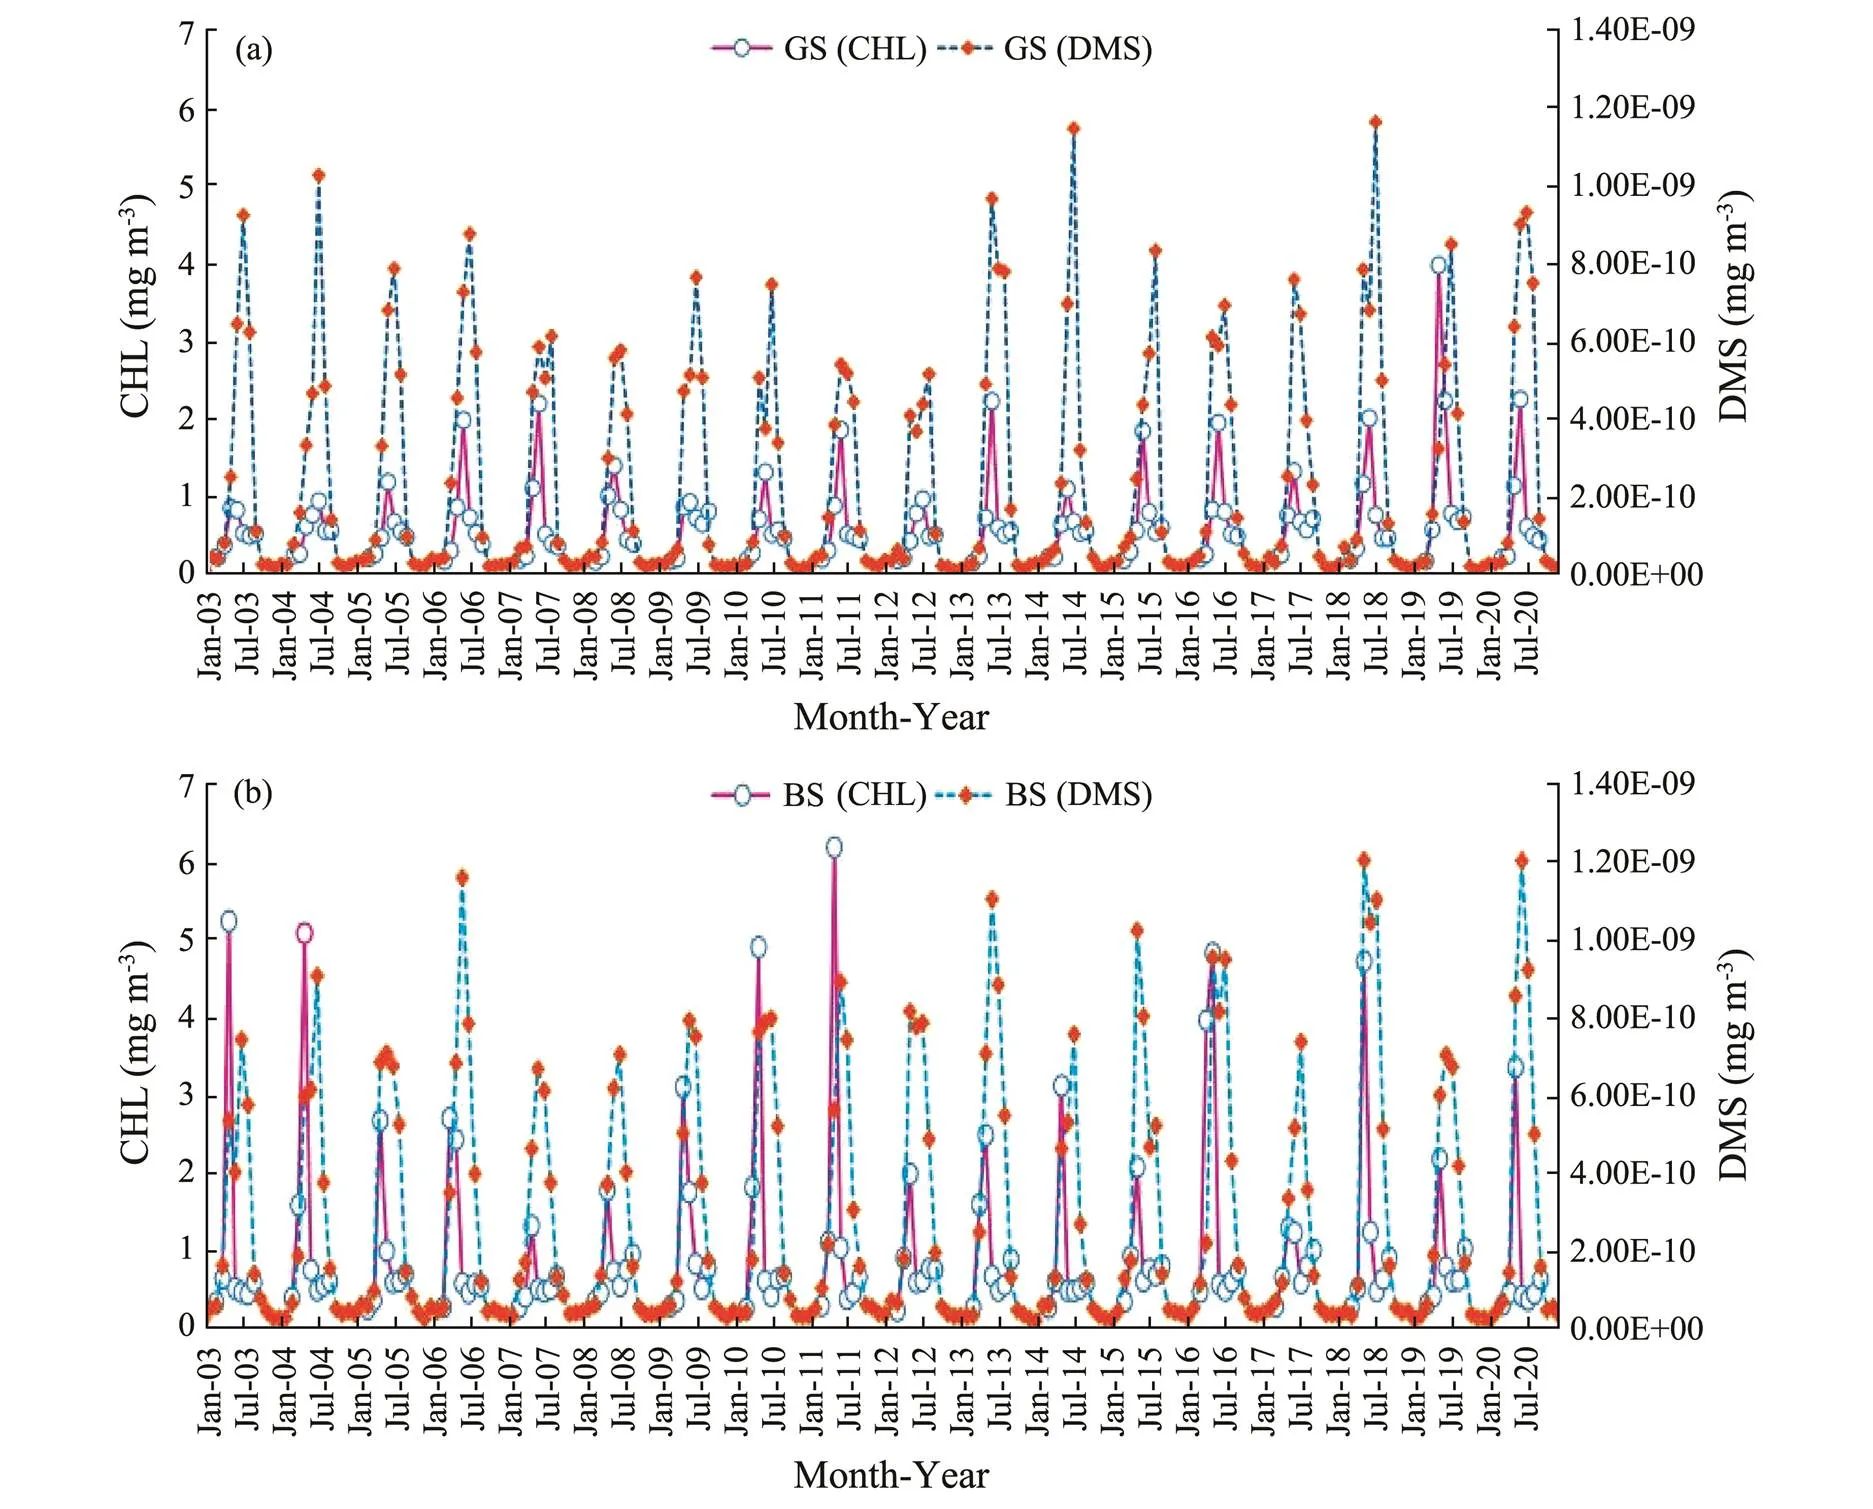
Fig.8 Mean time series of surface CHL and DMS in (a) GS and (b) BS from 2003 to 2020.
The high correlations between CHL and DMS indicates that the CHL concentration obtained by satellite during spring and early summer can be used as an indicator of DMS concentration in the AO. However, in some years (such as 2013 in BS), CHL cannot be used as an indicator of DMS. The reasons may be that other environment factors have greater influence on DMS concentration, such as SST, WIND and ICE (Gabric., 2014; Qu., 2018, 2020c, 2021).
The average DMS surface mass concentration images from April to July 2013 (June), 2015 (May), 2019 (July) and 2020 (June) are shown in Fig.9. DMS in May has been very high in BS (Fig.9a) in 2013, GS also distributed in the south, although the peak value of DMS was lower than that in the middle of BS. In July, the DMS of GS was higher than that of BS, because the DMS peak usually occurred in the later period of GS. As of July, DMS in BS was rather lower (Fig.9b for 2015). DMS peaked in BS in May. The development of DMS in GS was still too early. In 2019, DMS reached its peak in July of GS. However, DMS in BS was quite low (Fig.9c). The possible reason is that the peak value of DMS in BS has past. Another reason is that in 2019, the DMS peak of GS was higher and that of BS is lower. DMS peak has shifted from the east of BS to the west of BS (Fig.9d). DMS peak was located in the southwest of GS. Fig.9 shows that the surface mass concentration of DMS in GS and BS varies seasonally. DMS bloom could be transferred from BS to GS, or from GS to BS. It is more likely that DMS has higher flowering in BS in May. By July, DMS flowering is more likely to occur inGS.
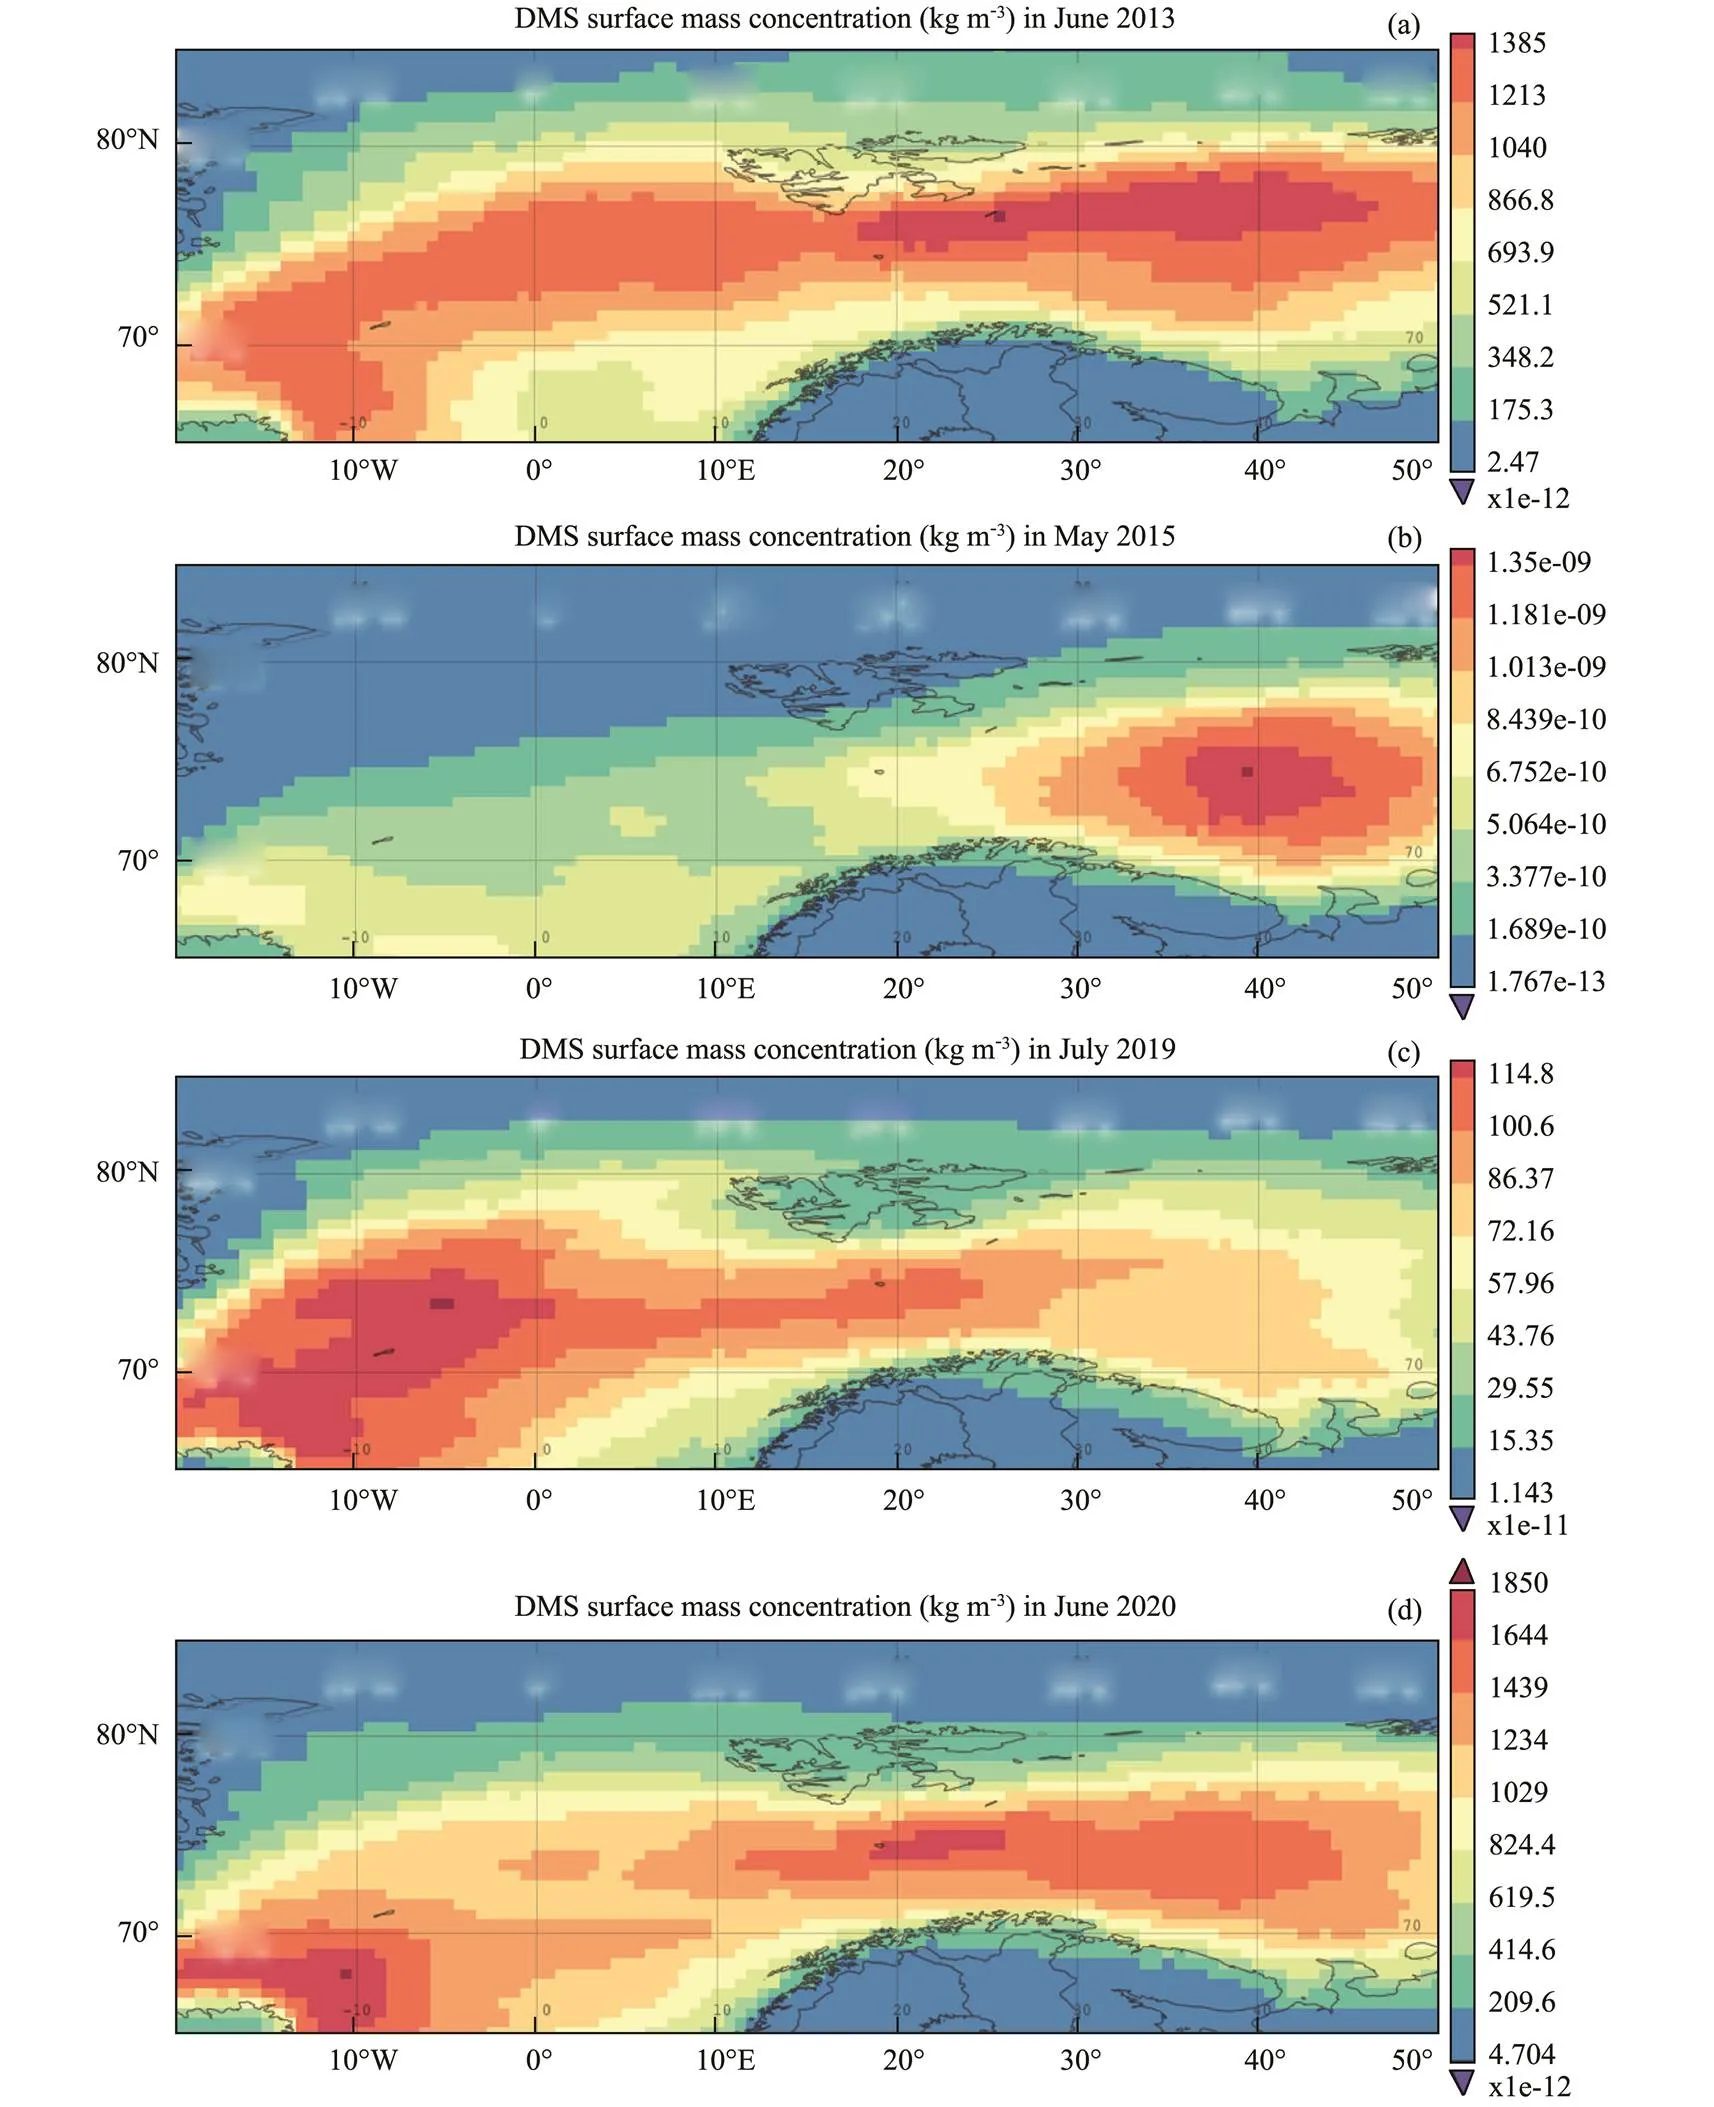
Fig.9 DMS surface mass concentration for (a) June 2013, (b) May 2015, (c) July 2019, (d) June 2020.
4 Discussion
4.1 NAO Effect
What causes seasonal variations of GS and BS climate factors such as CHL, ICE, SST and DMS? The conventional view of climate variations in AO is that they are mainly driven by NAO. The NAO index indicates the pressure difference between two fixed locations near Iceland and the Azores (Hurrell, 2001). Positive NAO indicates that the surface sea-level pressure moves northward with an enhancement of zonal circulation (Glowienka- Hense, 1985). In the positive NAO phase, BS is higher than normal temperature (Dickson, 2000). Fig.10 shows two typical phases of NAO temperature mode. During positive NAO phase (Fig.10, right), warm Atlantic air and horizontal flow will flow into the Norwegian Sea. This may lead to an increase in the upward ocean heat flux, thus making the Icelandic low pressure moves further eastward (Bengtsson., 2004). When the Icelandic low pressure moves eastward far enough, it will streng- then the polar horizontal current and sea ice transport through the Fram Strait in the center of GS. Therefore, this will cool the water off the west coast of Greenland (Hilmer and Jung, 2000). The sharp contrast between the cold west and warm east will be strengthening Iceland’s influence. As a result, a positive feedback loop is created and that leads to an increased temperature rise in the BS. As the Icelandic low pressure moves eastward, the cold Arctic air advection in western Greenland also reduces, and the NAO index decreases. During the negative phase of NAO, the opposite occurs (Fig.10, left). The two NAO phases determine the opposite change of the North Atlantic westerlies. However, the NAO index is highly constant. The most likely cause of NAO changes is the human impact on the climate system. The increase of greenhouse gas concentration seems to enhance the meridional temperature gradient in the lower stratosphere, resulting in a stronger polar vortex, this will lead to a higher NAO index stage (Bojariu and Giorgi,2005).
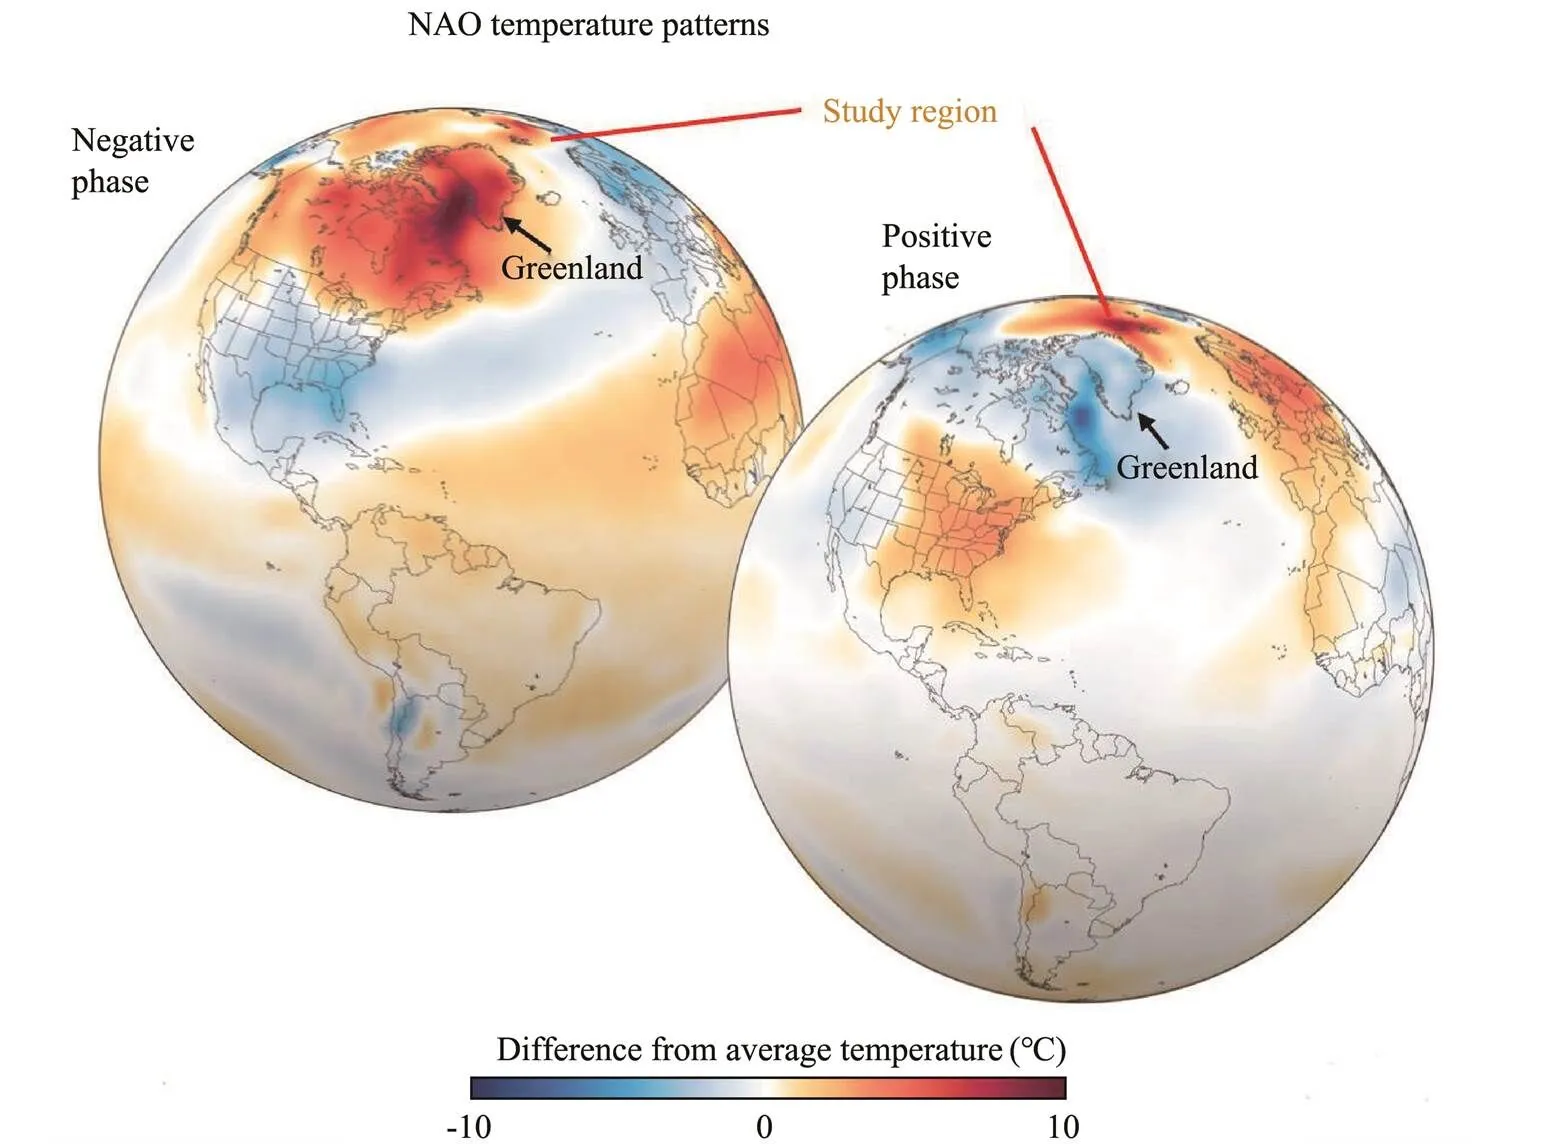
Fig.10 Positive and negative NAO related temperature patterns. Study region is indicated in the eastern of Greenland. The figure is adopted from NCEP/NCAR in NOAA Climate.gov. The typical patterns are for the time periods: Jan-Mar 2010 (left) and Jan-Mar 1999(right).
Fig.11a shows the annual average NAO in spring (April, May) and winter (November, December and Ja- nuary). There were more negative NAO stages in 2010 and 2012. There were positive stages in 2003, 2004, 2007 and 2013. The annual average NAO (blue bar) started from positive to negative and then to positive. In 2010, the NAO was all negative, which means that there was more ice melting in the year. This also explains the surge in CHL in 2010. This result is consistent with that found by Bengtsson. (2004), where Bengtsson. (2004) found the reduced sea ice coverage is the main reason for the increasing of BS temperature. The decrease of ICE in 2010 was more significant than that in other year, which led to the significant melting of ice in that year. The spring NAO stage was quite negative not only in 2010, but also in 2005, 2008, 2012 and 2014. Strong and Magnusdottir (2011) also found that the NAO is depends on the averaged ice cover area around the BS area. The coupling relationship presents negative feedback. In other words, for a positive NAO, it will often produce negative anomalies of ICE, which in turn will lead to a negative NAO. This explains the interannual variations of NAO.
The detailed NAO time series of 8-day intervals in 2009, 2010 and 2011 are shown in Fig.11b. In 2010, the negative value of NAO was the most in the whole year, and the negative value was strong in spring and autumn. The extremely negative NAO in 2010 resulted in a general circulation model conductive to ice loss (Bengtsson., 2004; Strong and Magnusdottir, 2011). In the spring of 2009, NAO was more positive NAO. In 2009, positive NAO resulted in local CHL peak appearing later in the year (Fig.4). Strong negative NAO in January 2011 led to CHL bloom at the beginning of the year. In 2011, there were more positive NAO in spring and winter, and more negative NAO during days 160–224. In spring and summer of 2011, NAO oscillated from negative to positive and then negative, resulting in three peaks of CHL in the year (Fig.4a). The negative NAO in spring and previous winter (not show in figure for 2012) is also one of the reasons for the BSS CHL peak in spring 2013 (Fig.4a). Another main reason is that the higher SST in 2013 had a significant impact on the CHL peak in 2013, and duration was longer than that in other years. However, the CHL of BSN was low in 2013. The reason for the low CHL in BSN in 2013 is not clear. Strong and Magnusdottir (2011) believed that the positive NAO in the previous winter will lead to the reduction of ice cover in the following year (Strong and Magnusdottir, 2011). Fig.11b shows that the rather positive winter NAO in year 2011 (from day 336 to 365) would lead to the reduction of ice cover in spring 2012. Therefore, the lower CHL did occur in 2012 (Fig.4a).
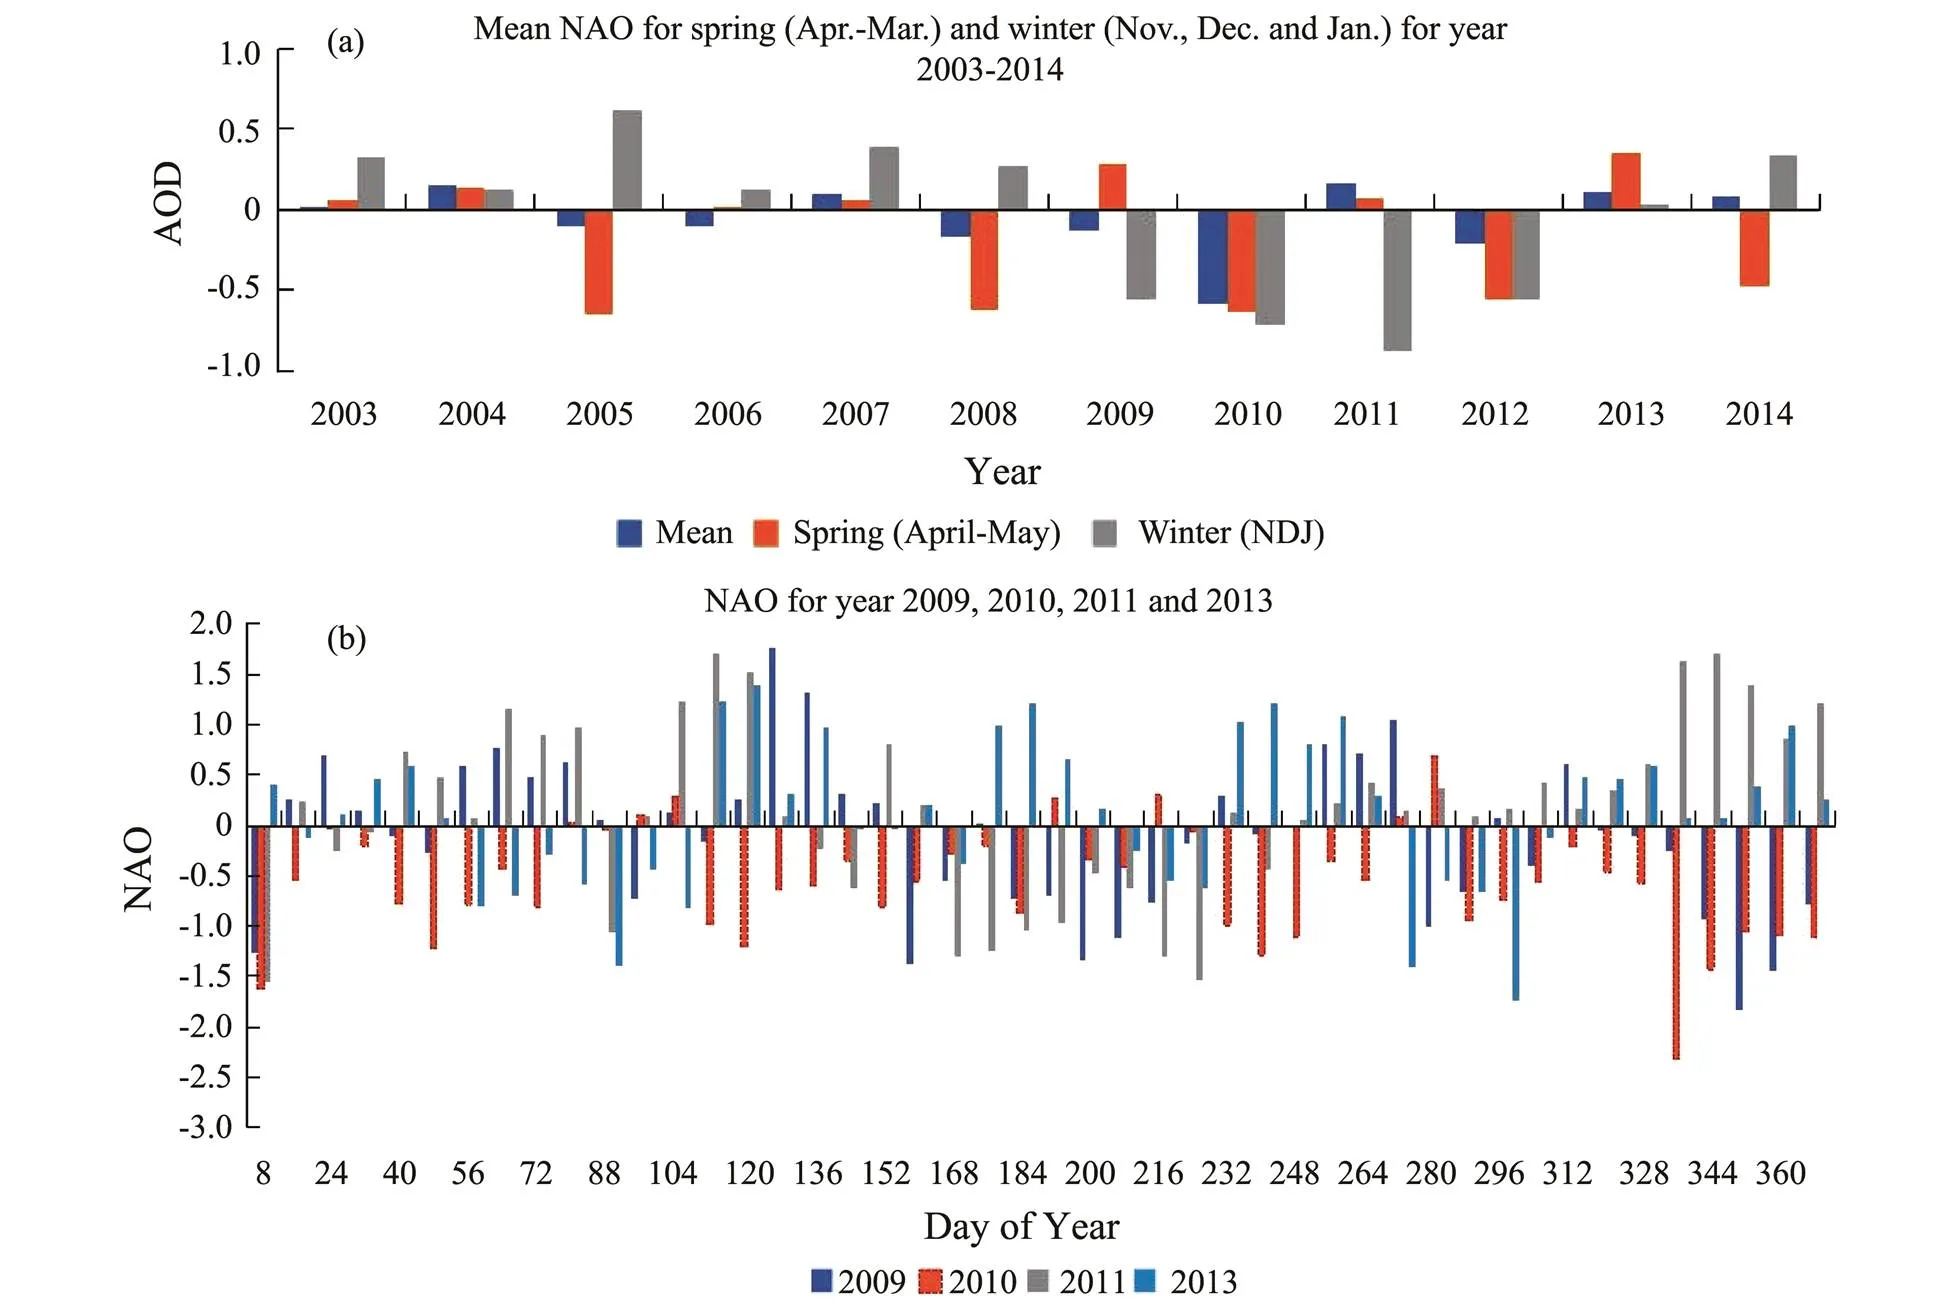
Fig.11 (a) Yearly mean AOD for spring (April, May) and winter (November, December and January) for 2003–2014; (b) NAO time series for 2009, 2010 , 2011 and 2013.
4.2 The Correlations Among CHL, ICE and NAO
The correlation between NAO and ICE in previous winter (November, December and January.) and this spring (April, May) in BSN and GSN was studied (Fig. 12a). It is found that the correlation is mostly negative. This means that in addition to GS in 2009 and BS in 2011, negative NAO in the previous winter will indicate an increase in ICE in the following spring. The positive correlation between BS in 2011 and GS in 2009 may be due to the mismatch of melting ice period. The melting time of the ICE is much earlier in 2011 and much later in 2009. Except in 2006, there was more negative correlation between NAO and CHL in GS (Fig.12b). The correlation between NAO and CHL in spring (March, April and May) was also calculated for GSS and GSN. In BS, there is a mixed correlation between NAO and CHL (not shown in figures).
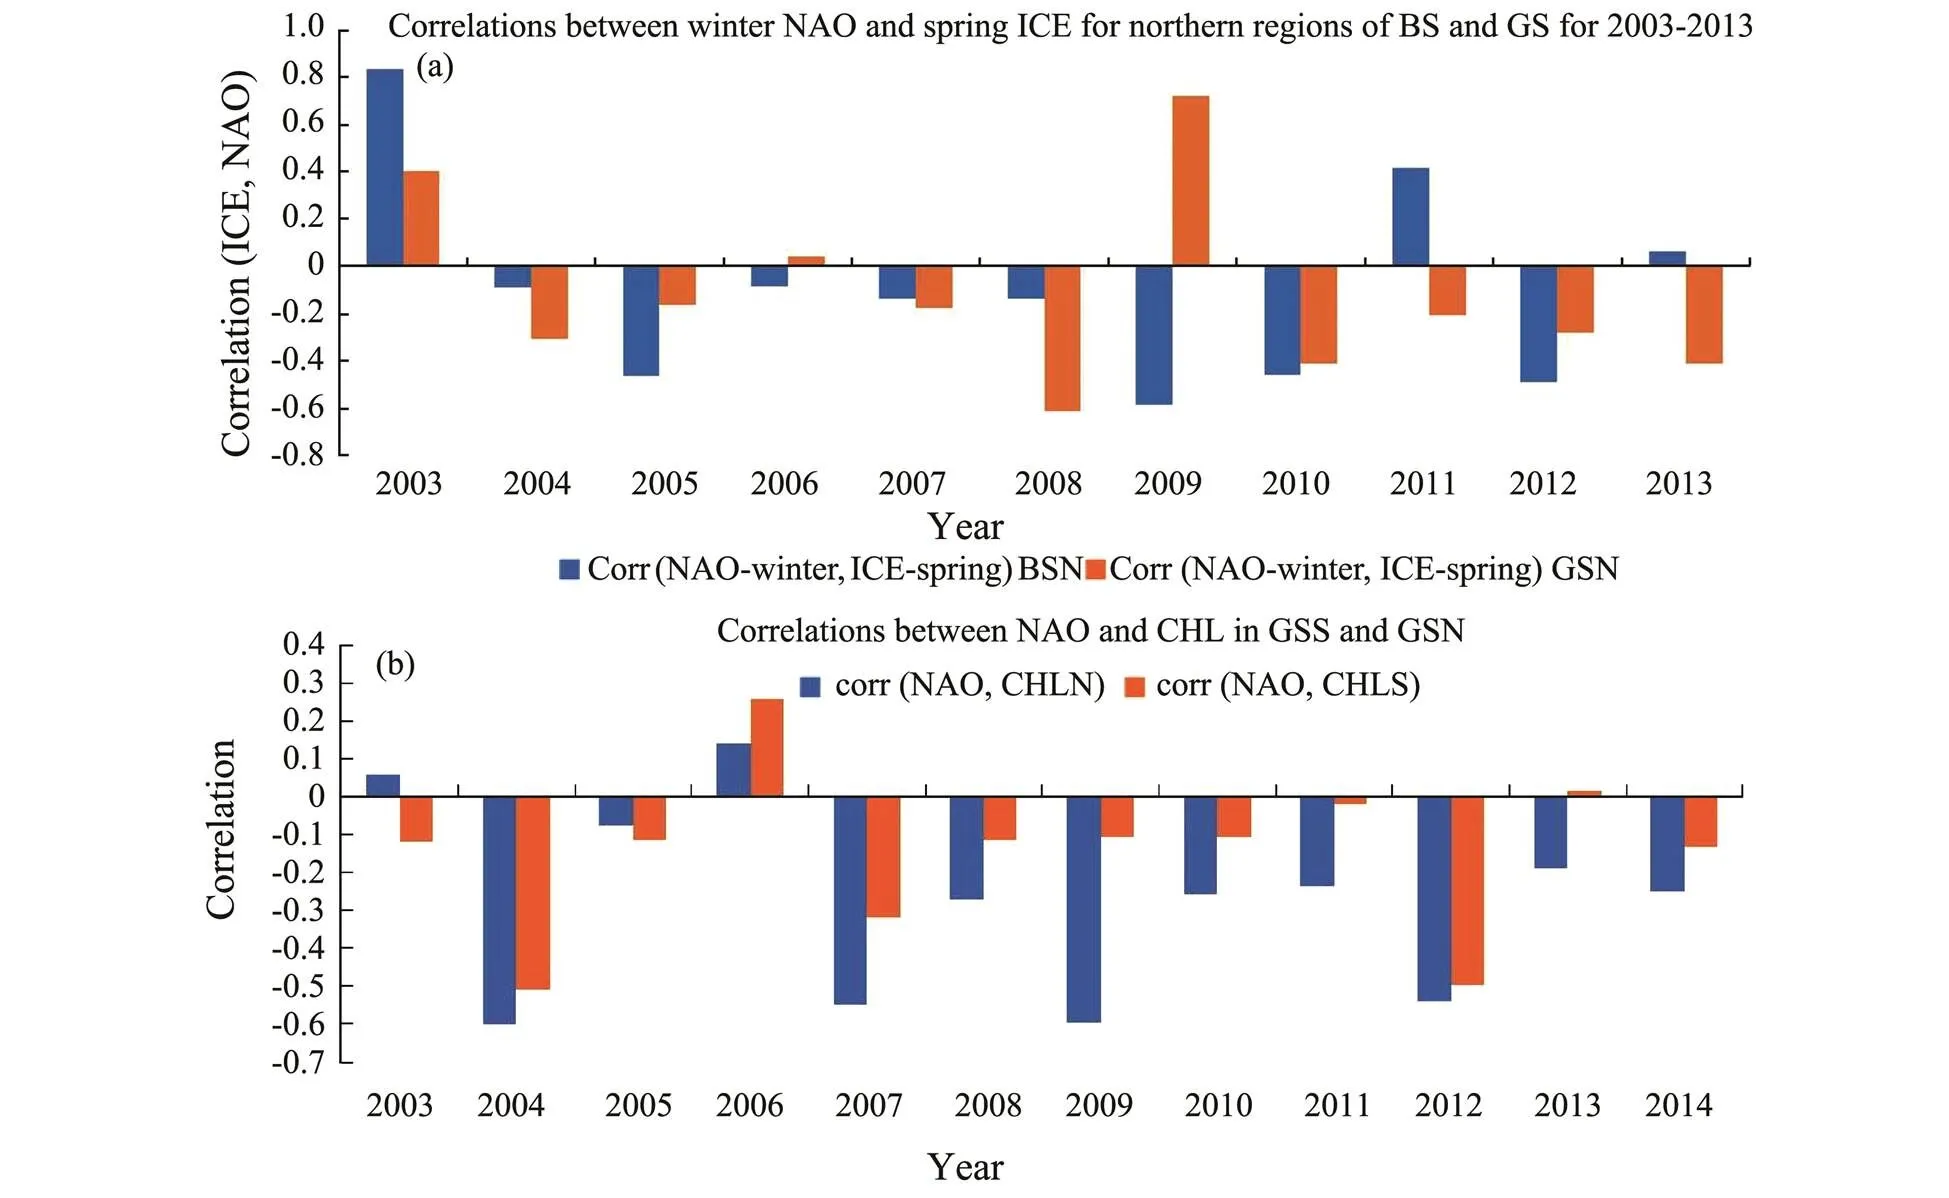
Fig.12 (a) Correlations between previous winter NAO (NDJ) and this spring ICE (April, May) in BSN and GSN; (b) Correlations between NAO and CHL and spring time (MAM) in GSS andGSN.
In general, CHL and ICE were negatively correlated in most years. ICE reached its peak in GS about 2 months earlier than CHL, and reached its peak in BS about 1 month earlier, due to its physical position. It seems that NAO had more influence on the GS rather than BS. In spring (day 120 to day 168), the correlation between melting ice and CHL are shown in Fig.13a. In GSN, most years are positively correlated, except 2006, 2011 and 2014. However, there is more chaos in BSN. This indicates that there is more positive correlation between melting ice and CHL in GSN. In 2007, 2010, 2012 and 2013, melting ice was positive correlated with CHL in GS andBS.
The time series of melting ice, CHL and NAO in GSN were compared in 2010 (Fig.13b). Ice melting was positively correlated with CHL and negatively correlated with NAO. The correlation coefficient between melting ice and CHL in 2010 was 0.54 in GS. From 2003 to 2014, the positive correlation coefficient between CHL and melting ice was 0.4.
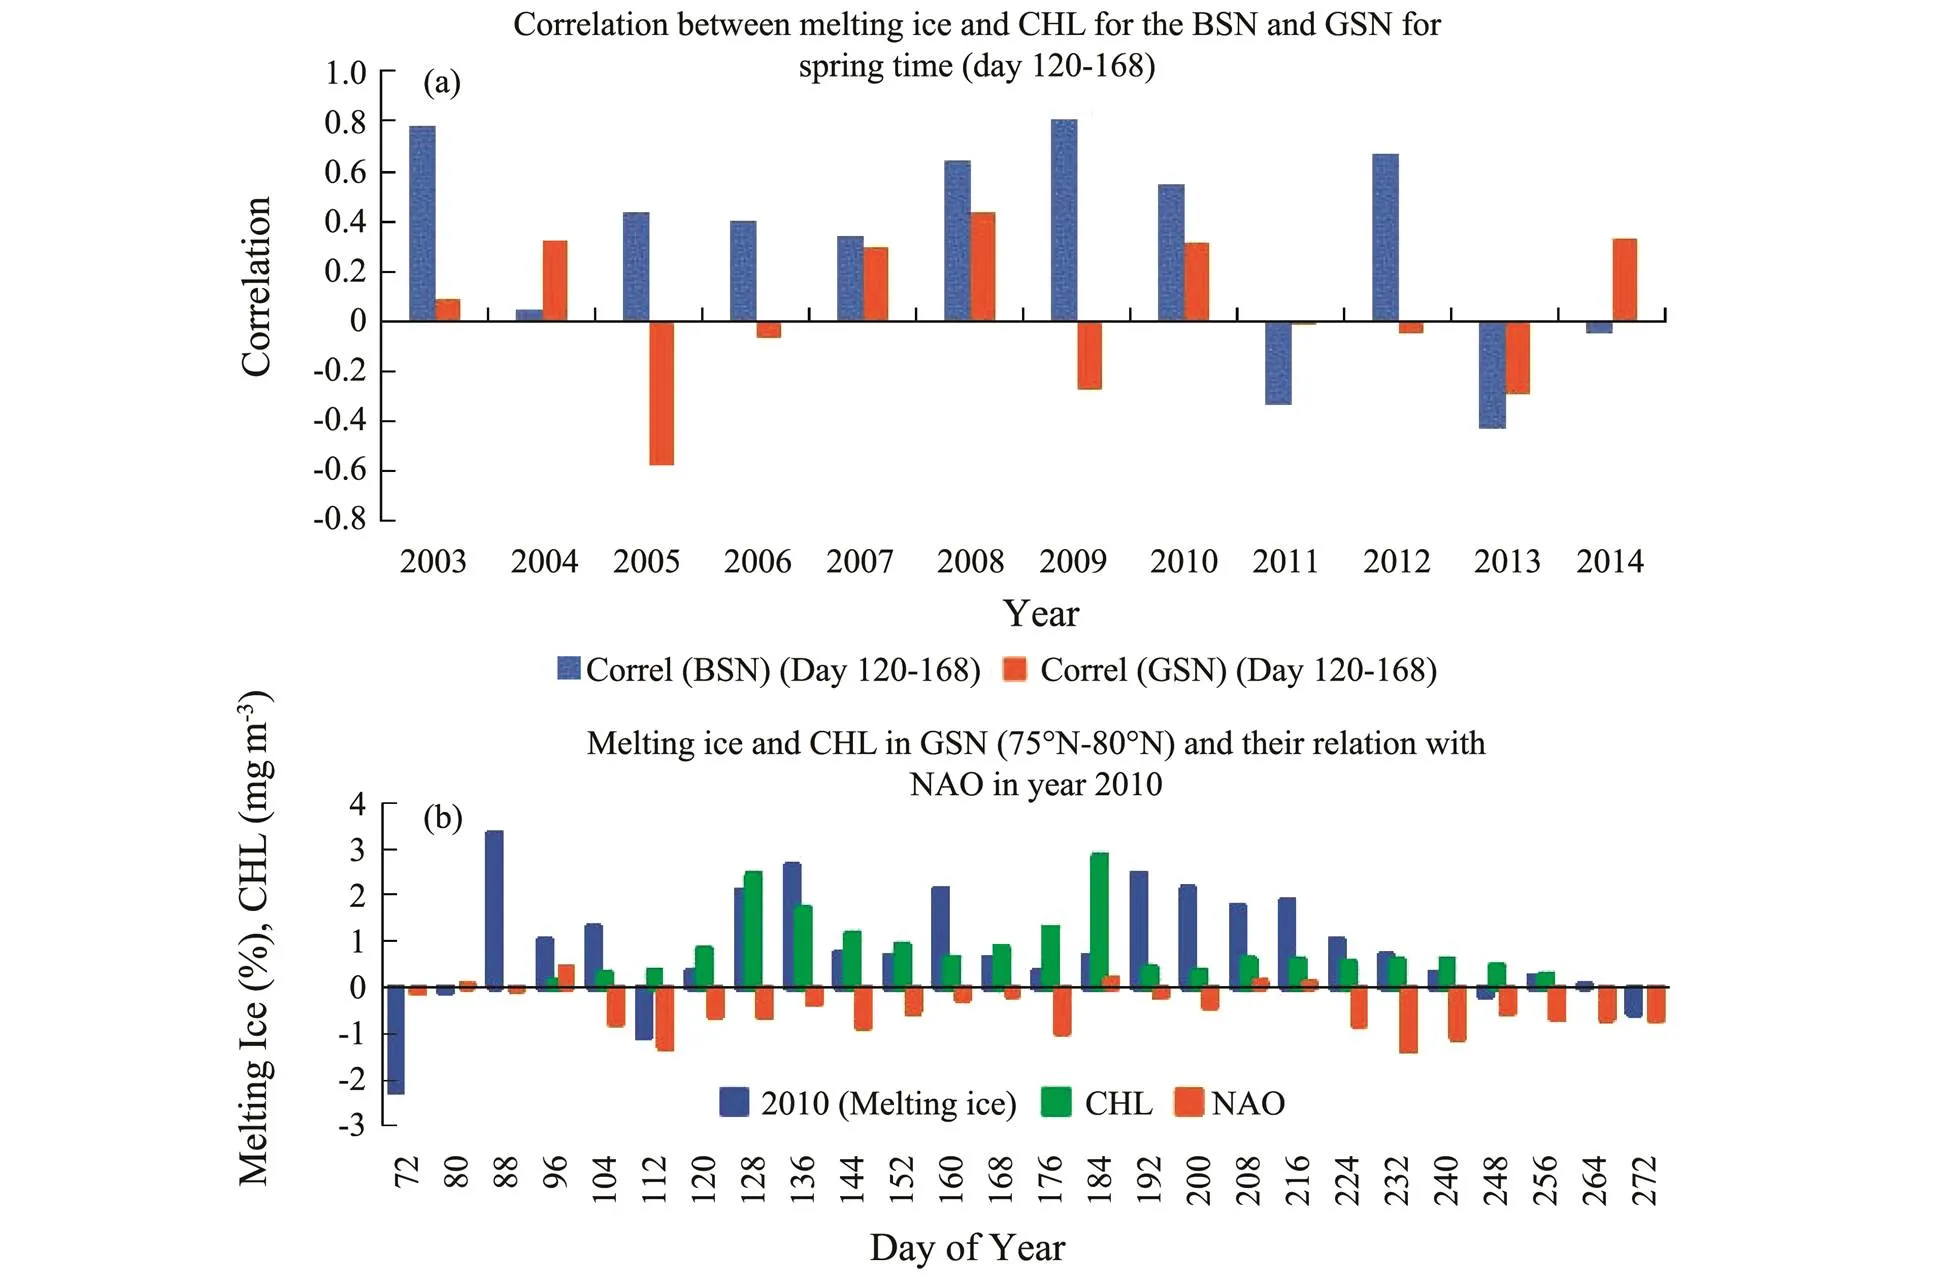
Fig.13 (a) Correlations of melting ice and CHL in BSN and GSN for spring time (day 120–168); (b) Melting ice, CHL and NAO time series inGSN.
5 Conclusions
The spatial mean CHL, ICE, SST and NAO in BS and GS from 2003 to 2014 were compared. In general, the concentration of CHL is higher than that of BS in most years. Compared with other years, the CHL peaks in 2010 and 2011 were higher and earlier. The significant ice loss in spring was the main reason for the peak of CHL, especially in BSN. The rise of SST was the main reason for the peak of CHL, especially in BSS. The earlier and more extensive ice melting combined with the continuous negative NAO phases might be the possible drives of higher CHL blooms in year 2010.
The correlation of NAO and ICE in the northern regions is mostly negative. A negative NAO in the previous winter would lead to an increase in ICE in the coming spring. In GS, NAO and CHL were mostly negatively correlated. Due to its physical location, it seems that NAO had more influence on GS rather than that of BS. In GSN, melting ice is positive correlated with CHL and negative correlated with NAO. In BS, the relationship between NAO and ICE, NAO and CHL is inconsistent, while in GS, especially in 2010, the relationship between NAO and CHL is negative correlated.
The extended time series of DMS and CHL are studied. From 2003 to 2020, the mean correlation coefficients of CHL and DMS of GS and BS were 0.53 and 0.27 respectively. The relatively high correlations of CHL and DMS in GS indicating that CHL concentration obtained by satellite in spring and early summer could be used as an indicator of DMS concentration in the study region, especially in GS.
Climate warming caused by the increase of carbon dioxide (CO2) has a great impact on the AO, especially in BS. Average SST increased in the study region. The anthropogenic effect is one of the causes of climate warming. The increase of melting ice in the AO is another major reason for the rise of Arctic temperature. The region with the largest Arctic warming is located in the region with the largest winter ice change in BS and GS. Warming is also associated with westerly to south-westerly winds from the North Atlantic Current into BS. Melting ice can be used as an indicator of CHL concentration; CHL can be used as an indicator of DMS concentration in most years in AO. NAO is negative correlated with ice melting and CHL. Therefore, NAO can be used as an indicator of amount of ice loss next spring. An important factor in establishing a long-time warming system is a more comprehensive modelling system with more observation data to support. At present, observation data (such as DMS concentrations) in the Arctic are sparse and lack- ing. There is an urgent need to establish the dynamical feedback mechanism related to the generation of atmospheric heat sources, and the related AO cyclonic circulation system, especially in the specific sensitive area in BS.
Acknowledgements
This work has been supported by numerous supporters. Firstly, special thanks should go to Drs. Hehe Li, Xiao Liu and Ailun Fan for their CHL and WIND satellite data retrieving and calculations during year 2003–2014 in Greenland Sea and Barents Sea. Thanks to NASA Ocean Biology Processing Group and Goddard Space Flight Centre of SeaWiFS Project group for providing MODIS CHL 8-day data. Thanks to NOAA NCEP EMC CMB GLOBAL Reyn-SmithOIv2 for providing ICE weekly data. Thanks to the Naval Research Laboratory Remote Sensing Division, the Naval Center for Space Technology, and the National Polar-Orbiting Operational Environmen- tal Satellite System (NPOESS) for providing WIND, SST data. Thanks NASA Global precipitation Measurement Mission for providing Giovanni Web-based application developed by the Goddard Earth Sciences Data and Information Ser- vices Center (GES DISC), for better image visualizations for CHL, ICE, SST and DMS surface mass concentrations. Finally, we gratefully acknowledge the National Natural Science Foundation of China (No. 41276097) for providing research funding for thisproject.
Acker, J. G., and Leptoukh, G., 2007. Online analysis enhances use of NASA Earth Science Data., 88 (2): 14-17.
Ardyna, M., Babin, M., Gosselin, M., Devred, E., Rainville, L., and Tremblay, J. E., 2014. Recent Arctic Ocean sea ice loss triggers novel fall phytoplankton blooms., 41 (17): 6207-6212, DOI: 10.1002/2014gl061 047.
Arrigo, K. R., and van Dijken, G. L., 2015. Continued increases in Arctic Ocean primary production., 136: 60-70, DOI: 10.1016/j.pocean.2015.05.002.
Arrigo, K. R., van Dijken, G., and Pabi, S., 2008. Impact of a shrinking Arctic ice cover on marine primary production., 35 (19): L19603, DOI: 10.102 9/2008gl035028.
Balchen, J. G., 1980. Modeling and Identification of Marine Ecological Systems with Applications in Management of Fish Resources and Planning of Fisheries Operations.
Bates, T. S., Lamb, B. K., Guenther, A., Dignon, J., and Stoiber, R. E., 1992. Sulfur emissions to the atmosphere from natural sources., 14: 315-337. Retrieved from https://link.springer.com/article/10.1007/BF001 15242.
Bengtsson, L., Semenov, V. A., and Johannessen, O. M., 2004. The early twentieth-century warming in the arctic–A possible mechanism., 17 (20): 4045-4057, DOI: 10. 1175/1520-0442(2004)017<4045:Tetwit>2.0.Co;2.
Bojariu, R., and Giorgi, F., 2005. The North Atlantic Oscillation signal in a regional climate simulation for the European region.:, 57 (4): 641-653, DOI: 10.3402/tellusa.v57i4.14709.
Bopp, L., Aumont, O., Sauveur, B., and Patrick, M., 2003. Potential impact of climate change on marine dimethylsulfide emissions., 55B: 11-22.
Budikova, D., 2009. Role of Arctic sea ice in global atmospheric circulation: A review., 68: 149- 163, DOI: 10.1016/j.gloplacha.2009.04.001.
Charlson, R. J., Lovelock, J. E., Andreae, M. O., and Warren, S. G., 1987. Oceanic phytoplankton, atmospheric sulphur, cloud albedo and climate., 326 (6114): 655-661, DOI: 10. 1038/326655a0.
Dalpadado, P., Arrigo, K. R., Hjøllo, S. S., Rey, F., Ingvaldsen, R. B., Sperfeld, E.,., 2014. Productivity in the Barents Sea–Response to recent climate variability., 9 (5): e95273, DOI: 10.1371/journal.pone.0095273.
Dickson, R. R., Osborn, T. J., and Hurrell, J. W., 2000. The Arctic Ocean response to the North Atlantic Oscillation., 13: 2671-2696.
Gabric, A. J., Cropp, R., Hirst, T., and and Marchant, H. 2003. The sensitivity of dimethyl sulfide producion to simulated climate change in the eastern Antarctic Southern Ocean., 55B: 966-981.
Gabric, A. J., Gregg, W., Najjar, R., Erickson, D., and Matrai, P., 2001. Modelling the biogeochemical cycle of simethylsulfide in the upper ocean: A review., 126: 1-16, DOI: 10.1016/S1465-9972(01)00018-6.
Gabric, A. J., Matrai, P., Jones, G., and Middleton, J., 2018. The nexus between sea ice and polar emissions of marine biogenic aerosols., 99 (1): 61-81, DOI: 10.1175/bams-d-16-0254.1.
Gabric, A. J., Qu, B., Matrai, P. A., and Hirst, A. C., 2005. The simulated response of dimethylsulfide production in the Arctic Ocean to global warming., 57 (5): 391-403, DOI: 10.1111/j.1600-0889.2005.00163.x.
Gabric, A. J., Qu, B., Matrai, P. A., Murphy, C., Lu, H., Lin, D. R.,., 2014. Investigating the coupling between phytoplankton biomass, aerosol optical depth and sea-ice cover in the Greenland Sea., 66: 94-109, DOI: 10.1016/j.dynatmoce.2014.03.001.
Gabric, A. J., Qu, B., Rotstayn, L., and Shephard, J. M., 2013. Global simulations of the impact on contemporary climate of a perturbation to the sea-to-air flux of dimethylsulphide., 63: 365- 376.
Gabric, A. J., Simó, R., Cropp, R. A., Hirst, A. C., and Dachs, J., 2004. Modeling estimates of the global emission of dimethyl- sulfide under enhanced greenhouse conditions., 18(2): 1-14, DOI: 10.1029/2003gb0021 83.
Glowienka-Hense, R., 1985. Studies on the variability of Icelandic low and Azores high between 1881 and 1983., 58: 160-170.
Hilmer, M., and Jung, T., 2000. Evidence for a recent change in the link between the North Atlantic Oscillation and Arctic Sea ice export., 27 (7): 989-992, DOI: 10.1029/1999GL010944.
Holland, M. M., Bitz, C. M., and Tremblay, B., 2006. Future abrupt reductions in the summer Arctic sea ice., 33: L23503, DOI: 10.1029/2006GL028024.
Hu, M., and Tang, X., 1995. The roles of dimethyl sulfide (DMS) from the oceans in the atmosphere., 7 (02): 152.
Hurrell, J. W., and Deser, C., 2009. North Atlantic climate variability: The role of the North Atlantic Oscillation., 78 (1): 28-41, DOI: 10.1016/j.jmarsys.2008. 11.026.
Hurrell, J. W., Kushnir, Y., and Visbeck, M., 2001. The North Atlantic Oscillation., 291: 603-605.
Kloster, S., Six, K. D., and Feichter, J., 2007a. Response of dimethylsulfide (DMS) in the ocean and atmosphere to global warming., 112: G03005, DOI: 10.1029/2006JG000224.
Kloster, S., Six, K. D., Feichter, J., Maier-Reimer, E., Roeckner, E., Wetzel, P.,., 2007b. Response of dimethylsulfide (DMS) in the ocean and atmosphere to global warming., 112: G3, DOI: 10.1029/2006JG000224.
Lara, R. J., Kattner, G., Tillmann, U., and Hirche, H. J., 1994. The north east water polynya (Greenland Sea) II. Mechani- sms of nutrient supply and influence on phytoplankton distribution., 14: 483-490.
Levasseur, M., 2013. Impact of Arctic meltdown on microbial cycling of sulphur., 6: 691-700, DOI: 10. 1038/ngeo1910.
Liu, J., Curry, J. A., and Hu, Y., 2004. Recent Arctic sea ice variability: Connections to the Arctic Oscillation and the ENSO., 31 (9):L09211, DOI: 10.1029/2004GL019858.
Malin, G., 1997. Sulphur, climate and the microbial maze., 387: 857-859.
Moline, M. A., Karnovsky, N. J., Brown, Z., Divoky, G. J., Frazer, T. K., Jacoby, C. A.,., 2008. High latitude changes in ice dynamics and their impact on polar marine ecosystems., 1134 (1): 267- 319, DOI: 10.1196/annals.1439.010.
Neukermans, G., Oziel, L., and Babin, M., 2018. Increased intrusion of warming Atlantic water leads to rapid expansion of temperate phytoplankton in the Arctic., 24: 12-21, DOI: 10.1111/gcb.14075.
Oziel, L., Neukermans, G., Ardyna, M., Lancelot, C., Tison, J. L., Wassmann, P.,., 2017. Role for Atlantic inflows and sea ice loss on shifting phytoplankton blooms in the Barents Sea., 122 (6): 5121-5139, DOI: 10.1002/2016jc012582.
Park, K. T., Lee, K., Yoon, Y. J., Lee, H. W., Kim, H. C., Lee, B. Y.,., 2013. Linking atmospheric dimethyl sulfide and the Arctic Ocean spring bloom., 40 (1): 155-160, DOI: 10.1029/2012GL054560.
Qu, B., and Gabric, A. J., 2010. Using genetic algorithm to calibrate a dimethylsulfide production model in the Arctic Ocean., 28 (1): 1-10, DOI: 10.1007/s00343-010-9062-x.
Qu, B., Gabric, A. J., and Jackson, R., 2021. Contemporary variability in dimethylsulfide flux in the Barents Sea and simulated change under 4×CO2climate conditions., 220: 103573, DOI: 10.1016/j.jmarsys.2021. 103573.
Qu, B., Gabric, A. J., Jiang, L., and Li, C. 2020a. Comparison between early and late 21st C phytoplankton biomass and dimethylsulfide flux in the Subantarctic Southern Ocean., 19 (1): 151-160, DOI: 10. 1007/s11802-020-4235.
Qu, B., Gabric, A. J., Lu, H., and Lin, D., 2014. Spike in phytoplankton biomass in Greenland Sea during 2009 and the correlations among chlorophyll-, aerosol optical depth and ice cover., 32 (2): 241-254, DOI: 10.1007/s00343-014-3141-3.
Qu, B., Gabric, A. J., Lu, Z., Li, H., and Zhao, L., 2016a. Unusual phytoplankton bloom phenology in the northern Green- land Sea during 2010., 2164: 144- 150, DOI: 10.1016/j.jmarsys.2016.07.011.
Qu, B., Gabric, A. J., Zeng, M., and Liu, X., 2020b. Correlations among phytoplankton biomass, sea ice and wind speed in Barents Sea and the future climate trends., 24: 100525.
Qu, B., Gabric, A. J., Zeng, M., and Lu, Z., 2016b. Dimethylsulfide model calibration in the Barents Sea using a genetic algorithm and neural network., 13: 413-424, DOI: 10.1071/EN14264.
Qu, B., Gabric, A. J., Zeng, M., Xi, J., Jiang, L., and Zhao, L., 2017. Dimethylsulfide model calibration and parametric sensitivity analysis for the Greenland Sea., 13: 13-22, DOI: 10.1016/j.polar.2017.07.001.
Qu, B., Gabric, A. J., Zhao, L., Sun, W., Li, H., Gu, P.,., 2018. The relationships among aerosol optical depth, ice, phytoplankton and dimethylsulfide and the implication for future climate in the Greenland Sea., 37 (5): 13-21, DOI: 10.1007/s13131-018-1210-8.
Qu, B., Yang, G. P., Guo, L. Y., and Zhao, L., 2020c. The satellite derived environmental factors and their relationships with dimethylsulfide in the East Marginal Seas of China., 204: 103305, DOI: 10.1016/j.jmarsys. 2020.103305.
Qu, B. G., and Jackson, R., 2021. Simulated perturbation in the sea-to-air flux of dimethylsulfide and the impact on polar climate., 39 (1): 110- 121.
Rey, F., and Loeng, H., 1985. The influence of ice and hydrographic conditions on the development of phytoplankton in the Barents Sea. In:. Gray, J. S., and Christiansen, M. E., eds., John Wiley & Sons Ltd, Christiansen, 1-22.
Rey, F., Noji, T. T., and Mille, L. A., 2000. Seasonal phytoplankton development and new production in the central Greenland Sea., 85: 329-344.
Reynolds, R. W., Rayner, N. A., Smith, T. M., Stokes, D. C., and Wang, W., 2002. An improvedand satellite SST analysis for climate., 15: 1609-1625.
Sarmiento, J. L., Slater, R., Barber, R., Bopp, L., Doney, S. C., Hirst, A. C.,., 2004. Response of ocean ecosystems to climate warming., 18(3):gb3 003, DOI: 10.1029/2003GB002134.
Slagstad, D., and Stole-Hansen, K., 1991. Dynamics of plankton growth in the Barents Sea: Model studies., 10: 173-186.
Slagstad, D., Ellingsen, I. H., and Wassmann, P., 2011. Evaluat- ing primary and secondary production in an Arctic Ocean void of summer sea ice: An experimental simulation approach., 90 (1-4): 117-131, DOI: 10.1016/ j.pocean.2011.02.009.
Stroeve, J., Holland, M. M., Meier, W., Scambos, T., and Ser- reze, M., 2007. Arctic sea ice decline: Faster than forecast., 34 (9): L09501, DOI: 10.1029/ 2007gl029703.
Strong, C., and Magnusdottir, G., 2011. Dependence of NAO variability on coupling with sea ice., 36 (9): 1681-1689, DOI: 10.1007/s00382-010-0752-z.
Struthers, H., Ekman, A. M. L., Glantz, P., Iversen, T., Kirkevåg, A., Mårtensson, E. M.,., 2011. The effect of sea ice loss on sea salt aerosol concentrations and the radiative balance in the Arctic., 11 (7): 3459- 3477, DOI: 10.5194/acp-11-3459-2011.
Vallina, S. M., and Simó, R., 2007. Strong relationship between DMS and the solar radiation dose over the global surface ocean., 1133680 (5811): 506-508.
Vallina, S., Simó, R., Gassó, S., de Boyer Montégut, C., Del Río, E., Jurado, E.,., 2007. Analysis of a potential ‘solar radiation dose-dimethylsulfide-cloud condensation nuclei’ link from globally mapped seasonal correlations., 21: 1-16, DOI: 10.1029/2006GB002787.
van den Dool, H. M., Saha, S., and Johansson, Å., 2000. Empirical orthogonal teleconnections., 13 (8): 1421-1435, DOI: 10.1175/1520-0442(2000)013<1421:Eot> 2.0.Co;2.
Wang, J., and Ikeda, M., 2000. Arctic oscillation and Arctic sea- ice oscillation., 27 (9): 1287- 1290, DOI: 10.1029/1999GL002389.
Yamamoto, K., Tachibana, Y., Honda, M., and Ukita, J., 2006. Intra-seasonal relationship between the Northern Hemisphere sea ice variability and the North Atlantic Oscillation., 33: L14711, DOI: 10.1029/2006 GL026286.
Zhang, X., and Walsh, J. E., 2006. Toward a seasonally ice-co- vered Arctic Ocean: Scenarios from the IPCC AR4 model simulations., 19: 1730-1747.
(September 9, 2022;
March 6, 2023;
April 19, 2023)
© Ocean University of China, Science Press and Springer-Verlag GmbH Germany 2023
. E-mail: qubo@ntu.edu.cn
(Edited by Ji Dechun)
杂志排行
Journal of Ocean University of China的其它文章
- Effects of 5-Azacytidine (AZA) on the Growth, Antioxidant Activities and Germination of Pellicle Cystsof Scrippsiella acuminata (Diophyceae)
- Using Rn-222 to Study Human-Regulated River Water-Sediment Input Event in the Estuary
- Parameterization Method of Wind Drift Factor Based on Deep Learning in the Oil Spill Model
- YOLOv5-Based Seabed Sediment Recognition Method for Side-Scan Sonar Imagery
- A Metadata Reconstruction Algorithm Based on Heterogeneous Sensor Data for Marine Observations
- Large Active Faults and the Wharton Basin Intraplate Earthquakes in the Eastern Indian Ocean
