Research on cognitive load evaluation with subjective method in manual assembly①
2023-12-15RENBinZHOUQinyuLIQibingLUOWenfa
REN Bin (任 彬), ZHOU Qinyu, LI Qibing, LUO Wenfa
(∗Shanghai Key Laboratory of Intelligent Manufacturing and Robotics, School of Mechatronic Engineering and Automation,Shanghai University, Shanghai 200444, P.R.China)
(∗∗Zhejiang Key Laboratory of Robotics and Intelligent Manufacturing Equipment Technology, Ningbo Institute of Materials Technology & Engineering, Chinese Academy of Sciences, Ningbo 315201, P.R.China)
(∗∗∗SAIC Motor R&D Innovation Headquarters, SAIC Motor Corporation Limited, Shanghai 201804, P.R.China)
Abstract
Key words: assembly worker, electroencephalogram (EEG), analytic hierarchy process(AHP), National Aeronautics and Space Administration Task Load Index (NASA-TLX) scale,subjective evaluation, scale applicability
0 Introduction
Complex product assembly in our country belongs to discrete assembly.The manual assembly work involves multidisciplinary, complex assembly procedures and inevitable rework and repair[1].Products in these assembly tasks are generally low volume complex products (LVCP), such as gas turbines, trains, industrial machinery and medical machinery[2].The complexity of LVCP mainly comes from a super-multi-item bill of materials and a high proportion of custom parts.In these customized production and assembly operations,manual assembly is required to be more flexible.The assembly workers have the ability to constantly adjust their assembly strategies and skills in time to complete the ever-changing requirements of assembly operations[3-5].Therefore, with the development of automation technology in assembly, the importance of manual operations is constantly highlighted.However, the operators need to face multi-mode and multi-type technical interaction[6].That means manual assembly is facing great cognitive challenges.The cognitive level of human beings is limited in a period.Cognitive fatigue occur easily after a long time of work, leading to assembly error and rework.
Therefore, the quantitative evaluation method of cognitive load in manufacturing industry is the hotspot in current research.There are three widely accepted cognitive load evaluation methods: subjective evaluation, performance evaluation and physiological evaluation[7].In a long period of time when cognitive load theory is proposed, subjective evaluation method is widely adopted.The subjective evaluation method evaluates the cognitive load according to the subjective feelings and experience.The theoretical basis is that the occupation of the mental resources is related to task difficulty and subjects’ effort, and the degree of effort and task difficulty can be accurately expressed by the subjects.The advantages of the subjective evaluation method lie in its convenience of implementation and high validity.And it also has no influence on the operation process[8-9].
In recent years, the measurement based on physiological signals have made significant progress.While the subjective evaluation method is still regarded as an effective method.Ref.[10] summarized that subjective evaluation method was not only direct, simple,economical, practical, sensitive, non-invasive and highly acceptable, but also met the reliability and validity indexes tested in the process of scale formation.Therefore, in the assessment experiment of cognitive load, subjective evaluation method still needs to be introduced and sometimes it can be used as a cross-verification method[11].
However, the subjective evaluation method cannot report the consistent feedback of the subjects in real time.It also needs optimization in the uncertainty and implementation mode[12].In terms of the uncertainty optimization, the results will be biased by reason of the unknown changes and unknown factors within the users.Ref.[13] proposed a technique for order preference by similarity to an ideal solution (TOPSIS) model to analyze National Aeronautics and Space Administration Task Load Index (NASA-TLX) scale instead of adopting the classical weighting method.Ref.[14] utilized fuzzy scoring method for subjective evaluation based on anchored semantic differential method (ASDM) and interval grey number theory.In terms of the implementation process of the subjective evaluation method, Ref.[15] found that informing the participants of relevant scene information in advance could provide useful situational awareness.In terms of the presentation of subjective evaluation methods, Ref.[16] proposed a simple web application, which provided participants with a concise interface to complete their subjective evaluation.
Ref.[17] found that 11 subjective tools could not be applied to the specific scenario of their research.So a new subjective method on single measurement was proposed based on the psychological dimension of NASA-TLX scale.Therefore, there is no scale universal in all fields.The applicability should be determined first before the introduction of subjective evaluation method.
The subjective evaluation method can quantize the grading of cognitive load from the lowest level to the highest level.Therefore, the experimental difficulty levels should also initially satisfy the stratification of cognitive load.In this study, the typical stages are extracted firstly from manual assembly task, and the cognitive load levels of these typical stages are tested to identify the experimental difficulty level.Then NASATLX scale, PAAS scale and WP scale are utilized to evaluate cognitive load.Through the test of sensitivity,validity, diagnosticity, acceptability indicators combined with Analytic hierarchy process (AHP) model,the weight distribution of related indicators is carried out and the applicability of the three scales in the manual assembly is determined.
1 Applicability assessing model of cognitive load assessment tools
Analytic hierarchy process (AHP) is a semiquantitative decision-making method.When AHP is applied, it is necessary to construct a hierarchical structure model.In this model, complex problems are decomposed into components of elements.The elements at the upper layer act as criteria to dominate the relevant elements at the lower layer.These layers can be divided into three types: goal layer, criterion layer and indicator layer.According to the applicability assessing method of mental workload assessment tool proposed by Ref.[18], there are altogether 7 key indicators (Fig.1), including diagnosticity (A11), validity(A12), sensitivity (A13), reliability (A14), intrusiveness (A21), implementation requirements (A22) and subject acceptability (A23).According to these seven key indicators, a hierarchical model of scale applicability assessing is established (Fig.1).This study sets two equally important factor groups.One factor group includes four indicators related to the characteristics of the evaluation tools: sensitivity, validity, diagnosticity and reliability.The other factor group includes three indicators related to the implementation process: subject acceptability, intrusiveness, and implementation requirements.In the first factor group, sensitivity, validity and diagnosability are set as the first important factors, and reliability is set as the second important factor.In the second factor group, the subject acceptability is set as the first important factor, and the intrusiveness and implementation requirements are set as the second important factors.
After the establishment of the hierarchy, construct comparison matrixM1of criterion layer and indicator comparison matrixM11,M12(Tables 1 -3).M11is related to the first factor group.M12is related to the second factor group.

Fig.1 AHP model for scale suitability test

Table 1 Comparison matrix of criterion layer
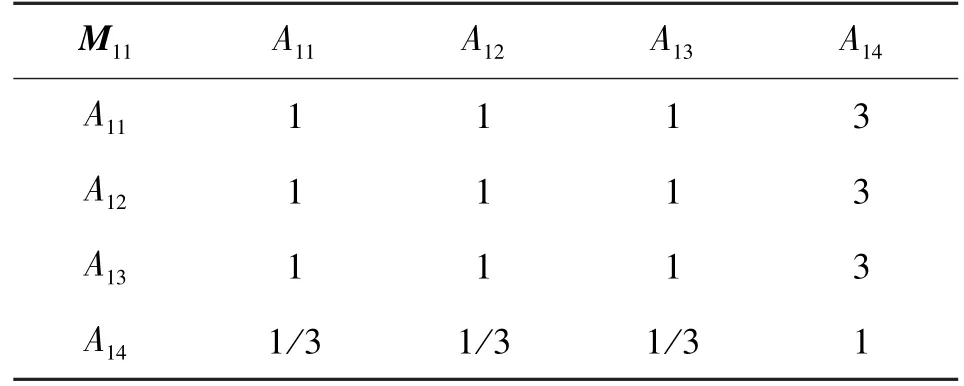
Table 2 Indicator comparison matrix of M11

Table 3 Indicator comparison matrix of M12
Then calculate the weight of each layer and carry out consistency check.Calculate the maximum eigenvalue and corresponding eigenvector of the comparison matrix.
where,Mis the applicability evaluation index, namelyM1,M11,M12;λmaxis the maximum eigenvalue of the comparison matrix;Pis the eigenvector corresponding toλmax.
Calculate theqth root of the product of each element from each row of the comparison matrixM:
Normalize the vector
Calculate the maximum eigenvalueλmax:
Then perform the consistency check.
where,CRrepresents random consistency ratio of the comparison matrix.If the value ofCRis less than or equal to 0.1, it indicates that the comparison matrix is reasonable.CIrepresents the consistency index of the comparison matrix.IfMhas complete consistency,CI=0.RIrepresents the average random consistency index of the comparison matrix, as shown in Table 4.

Table 4 Average random consistency index
Calculate the subjective weight of the evaluation index after the consistency check.
where,ωrepresents the weight of each evaluation index;Piis theith component of the eigenvector corresponding to the maximum eigenvalue of the comparison matrixM.
Therefore, the single-level weight vector ofM1,M11,M12can be calculated as [0.5, 0.5], [0.3,0.3, 0.3, 0.1] and [0.4286, 0.1429, 0.4286].Finally, the weight ofA11,A12,A13,A14,A21,A22,A23can be calculated as [0.15, 0.15, 0.15, 0.05,0.2143,0.0714,0.2143].
2 Design of assembly experiment inducing cognitive load
In order to assess the applicability of NASA-TLX scale, PAAS scale and WP scale in manual assembly,a lightweight assembly experiment is designed and carried out in the laboratory.The electroencephalogram(EEG) signals of the subjects are monitored during the experiment.Fig.2 illustrates the applicability assessment paradigm of the three scales.
First, the number of scales and experiments in different levels should be determined form×nmultifactor mixed experimental design.Then identify the difficult level of the three tasks by monitoring the EEG signals during the experiment to ensure that the designed experiment could induce different levels of cognitive load.Different frequency bands of EEG are related to different functions of brain.
Different brain functions represent different levels of cognition.Delta waves (1 -3 Hz) are associated with unconsciousness, deep sleep, and paralysis.Theta waves (4 -7 Hz) are associated with creativity,distraction, inattention, daydreaming, depression and anxiety; Alpha waves (8 -12 Hz) are related to physical and mental relaxation; Beta waves (13 -30 Hz)are associated with focus, analysis, conscious alertness, tension, and fear; Gamma waves (31 -50 Hz)are related to problem solving, learning, and facing cognitive challenges[11].

Fig.2 Research paradigm of scale selection for subjective assessment of cognitive load
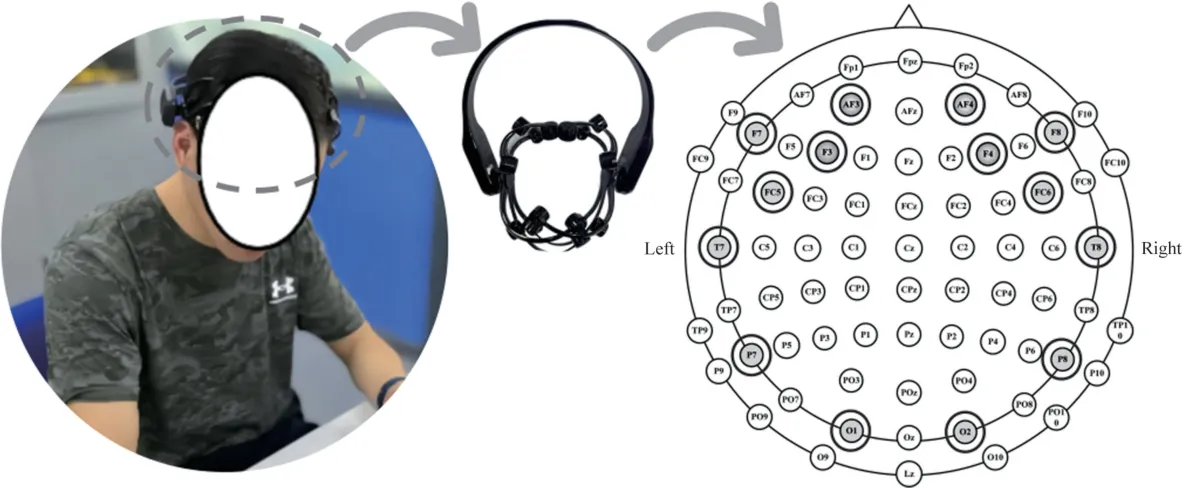
Fig.3 Channels of Emotiv Epoc+
This study utilizes Emotiv Epoc+ for EEG signals collection.The sampling frequency is 256 Hz.Before the experiment, the device electrodes need to be completely wet with saline so that the device can maintain good contact with the scalp.As shown in Fig.3, the 14 channels marked are the signal acquisition channels of Emotiv Epoc+.
In order to collect subjective data, paper versions of NASA-TLX scale, PAAS scale and WP scale are selected in this study.The NASA-TLX scale assesses workload with six dimensions: mental demand, physical demand, temporal demand, performance, effort and frustration level.The twenty-level bipolar scale is utilized to obtain ratings for these dimensions.Six separate scale ratings will be combined into one overall score based on a weighting procedure.The PAAS scale includes psychological effort and task difficulty, adopting a 9-level scoring system with 1 being least effort and very easy,5 being medium effort and medium difficulty, and 9 being very effort and very difficult.The total score is the mean value of scores from the two dimensions.WP scale is a subjective scale based on multi-resource theory.The scale includes eight dimensions: perceptual, response, spatial, verbal, visual,auditory, manual and speech.The score for each dimension ranges from 0 to 10, with 0 indicating that the resource is not occupied at all and 10 indicating that the resource is fully occupied.The total load value is the average of the value of all dimensions.
The three experimental tasks developed in this study are recorded as experiment 1, experiment 2 and experiment 3.As shown in Fig.4, experiment 1 is a preliminary cognition of the overall assembly process.Experiment 2 requires subjects to select parts,standard parts and tools.Experiment 3 requires subjects to finish the products assembly.The independent variables are scale type and task difficulty.The dependent variables are completion time, rework rate, error rate and subjective scores of cognitive load.The subjects recruited in this experiment are all students majoring in machinery.The subjects are assigned to NASA-TLX group, PAAS group,and WP group,with 8 subjects in each group.Every subject is required to finish three experimental tasks.After each task, they are required to fill in the corresponding scale.The experiment is conducted in a closed laboratory.The experiment recorder will record the time, error rate and rework rate of the subjects in the experiment, as well as the time spent by the subjects to complete their scales.
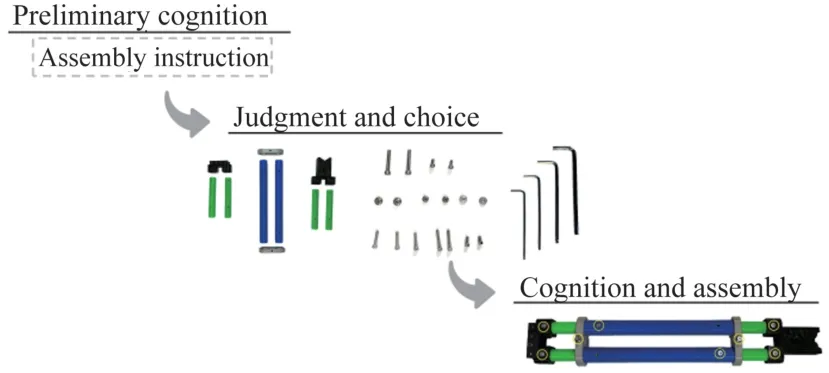
Fig.4 Procedure of the assembly task
3 Task difficulty differentiation based on PSD characteristics of EEG
Figs 5 -7 depict the EEG power spectrum density(PSD) characteristics of all subjects in experiment 1,2, 3.The bolded curve tracks the PSD curve of the channel which is closely related to the peak.In the process of each task, the distribution of energy across the spectrum is unique.By extracting the frequency corresponding to the peak position, the subjects’ cognitive load in different experiment stages can be compared.From Figs 5 -7, μV2/HZ repvesents the unit of power spectrul density(PSD), 10 ∗log 10(μV2/HZ) represents that the PSD is converted to decibel(dB).
As shown in Fig.5, in experiment 1, the frequency corresponding to the PSD peak is 15 Hz, belonging to low Beta wave (13-18 Hz), which is related to concentration, analysis, conscious vigilance, tension and fear.In experiment 1, subjects perform light cognitive activities by reading instruction.They are also accompanied by slight nervousness at the beginning of experiment.In experiment 3, the frequency corresponding to the PSD peak is 32 Hz, belonging to the low Gamma wave (31-40 Hz), which is associated with problem solving, learning and facing cognitive challenges.In experiment 3, continuous understanding of the assembly steps presents a cognitive challenge,which is exacerbated by continuous manual assembly operations.In experiment 2,the frequency corresponding to the PSD peak is 24 Hz, which belongs to the high Beta wave (18-30 Hz).In experiment 2, the subjects select the parts according to the assembly demand.The transition from light cognition to cognitive challenge is reflected in terms of cognitive demand.The transition from low Beta wave to low Gamma wave is also reflected in terms of signal frequency.
Finally, it can be seen that the three experimental tasks designed in this study result in three different levels of cognitive load.Therefore, the experiments designed in this study meet the requirements of difficulty stratification and the design of multi-factor mixed experiment.
4 Applicability evaluation of the three subjective scales
In this study,task completion time,error rate and rework rate are set as performance indicators.All performance indicators are shown in Table 5.As can be seen from Table 5,there is too much randomness in error rate and rework rate.The error rate and rework rate in some data sets are 0,which cannot accurately reflect subjects’ performance status.Therefore, the completion time is finally taken as the performance indicator,and the error rate and rework rate are set as reference.
Set the scale type as independent variable.Set the completion time as dependent variable.Conduct an one-way analysis of variance (ANOVA), as shown in Table 6.The results show that in experiment 1,F=0.147,P= 0.864 > 0.05.In experiment 2,F=2.220,P= 0.133 > 0.05.In experiment 3,F=3.023,P=0.070 >0.05.That means there is no significant difference in the time spent from the three groups to complete the tasks.In other words, the subjects from the three groups have the same ability to finish the tasks.Different scale types will not cause interference.

Fig.5 PSD plot of 14 EEG channels in experiment 1
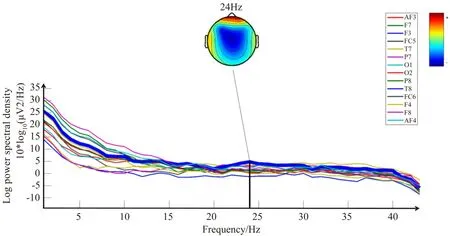
Fig.6 PSD plot of 14 EEG channels in experiment 2
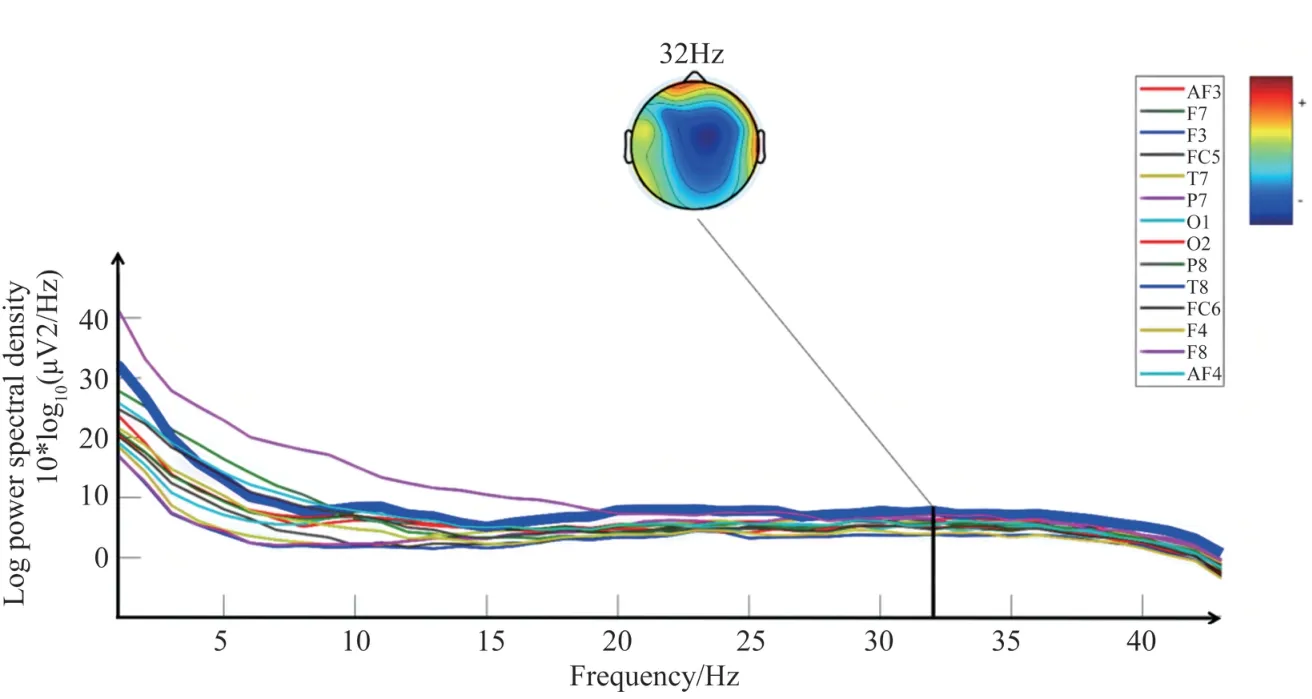
Fig.7 PSD plot of 14 EEG channels in experiment 3
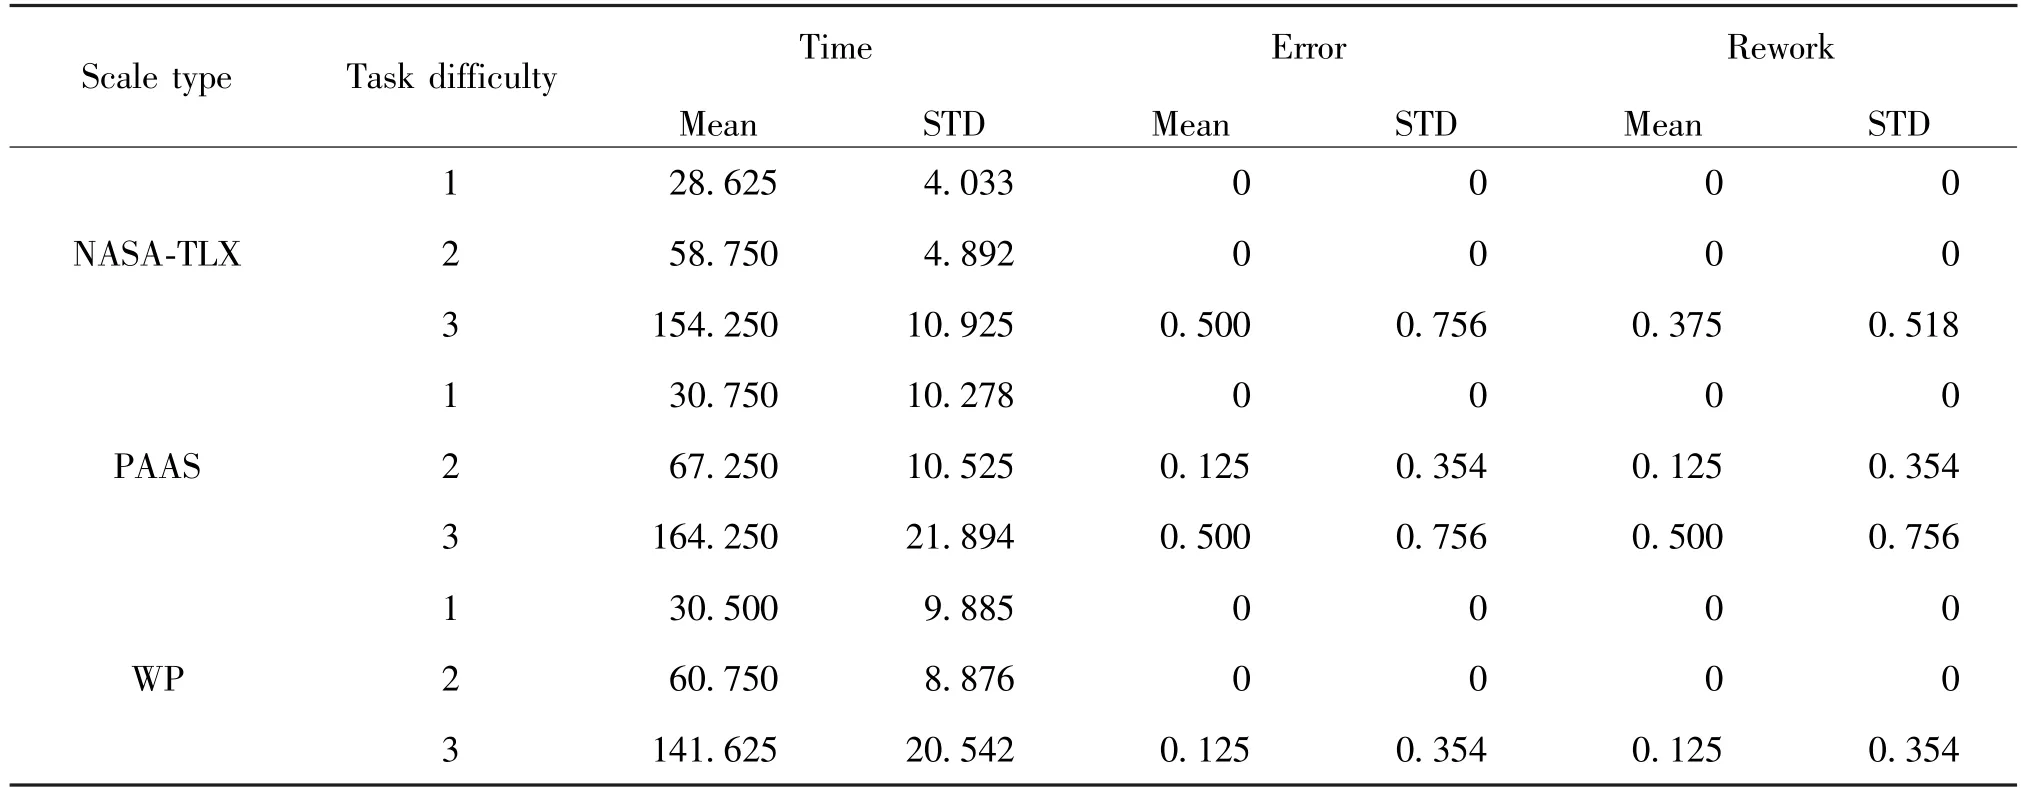
Table 5 Performance statistics of three groups of subjects under different task difficulties
Set task difficulty as independent variable and completion time as the dependent variable to conduct repeated measurement ANOVA, as shown in Table 7.The results show that in NASA-TLX scale,F=900.655,P= 0 < 0.05.In PAAS scale,F=270.013,P=0 <0.05.In WP scale,F=129.423,P=0 <0.05.That means there are significant differences in task completion time.In other words, if the subjects from the three groups complete the task in different difficulty levels, the completion time will change with the task difficulty.Therefore, the completion time can be used to reflect the difficulty of the task.That is, the completion time can reflect the degree of cognitive load.
The cognitive load score measured by the three scales is shown in Table 8.NASA-TLX scale, which originally has a score of –10 to 10, is now adjusted to a score of 0 to 10.The adjusted score is shown in Table 8.
Set task difficulty as independent variable and cognitive load scores as dependent variable.Conduct repeated measurement ANOVA, as shown in Table 9.The results show that in NASA-TLX scale,F=999.137,P= 0 < 0.05.In PAAS scale,F=419.323,P=0 <0.05.In WP scale,F=401.397,P=0 <0.05.That indicates the cognitive load values of the three scales have significant differences in task difficulty.In other words, when the subjects complete the tasks of different difficulty levels, the cognitive load values will change with the task difficulty.Therefore, the values of the three scales can reflect the cognitive load.In this study, the NASA-TLX scale reaches the highest sensitivity (F=999.137 >419.323 >401.397).

Table 7 Repeated measurement ANOVA of task completion time under different task difficulties

Table 8 Scores of cognitive load from the three scales

Table 9 Repeated measurement ANOVA of mental load values on three scales
Pearson correlation coefficients of the load values from the three scales are calculated, as shown in Table 10 and Table 11.The results show that between NASA-TLX scale and PAAS scale:P= 0.0999 >0.05.Between NASA-TLX scale and WP scale:P=0.1580 >0.05.Between PAAS scale and WP scale:P=0.0581 >0.05.That means the convergent validity of the three scales is at the same level.

Table 10 Convergent validity test

Table 11 P-values in test of convergent validity
The Pearson correlation coefficient between the load value of each scale and the completion time is calculated, as shown in Table 12.The results show that in NASA-TLX scale,P=0.0255 <0.05.In PAAS scale,P=0.0516 >0.05.In WP Scale,P=0.1105 >0.05.That means the value of NASA-TLX scale is positively correlated with the completion time.Therefore, NASATLX scale has the highest concurrent validity.

Table 12 Concurrent validity test
Figs 8 -10 report the load values of each dimension in different tasks, legends Ⅰ, Ⅱ, Ⅲrepresent experiment 1, experiment 2, experiment 3 vespectivdy.Scores of the six dimensions in NASA-TLX scale all increase with the task difficulty.So NASA-TLX scale has a good diagnostic performance.The diagnostic performance of PAAS scale is also good, but the scale has fewer evaluation dimensions than NASA-TLX scale.So it is inferior to NASA-TLX scale in overall diagnostic performance.WP scale can not distinguish task difficulty in dimensions of verbal, auditory and speech.That is to say, some of the WP scale indicators are insensitive to changes in cognitive load.Therefore, NASA-TLX scale performs best in diagnosticity.

Fig.8 Diagnostic test of the NASA-TLX scale

Fig.9 Diagnostic test of the PAAS scale
The scale completion time from each group of subjects is reported in Fig.11.The time spent by the subjects to complete the NASA-TLX scale after three experimental tasks is similar, indicating that the subjects’ acceptance of the NASA-TLX scale remains unchanged during the process of completing the NASATLX scale for three times.The PAAS scale also shows no difficulty in acceptance.However, it can be seen from the completion time of WP scale that subjects spend too much time in filling in WP scale for the first time.Combined with the questionnaire survey after the experiment, it is found that the subjects have a poor understanding of the description of dimensions in WP scale, which takes time to further understand the meaning of these dimension indicators.Therefore,subjects have poor subjective acceptance on WP scale and relatively good subjective acceptance on NASA-TLX scale and PAAS scale.
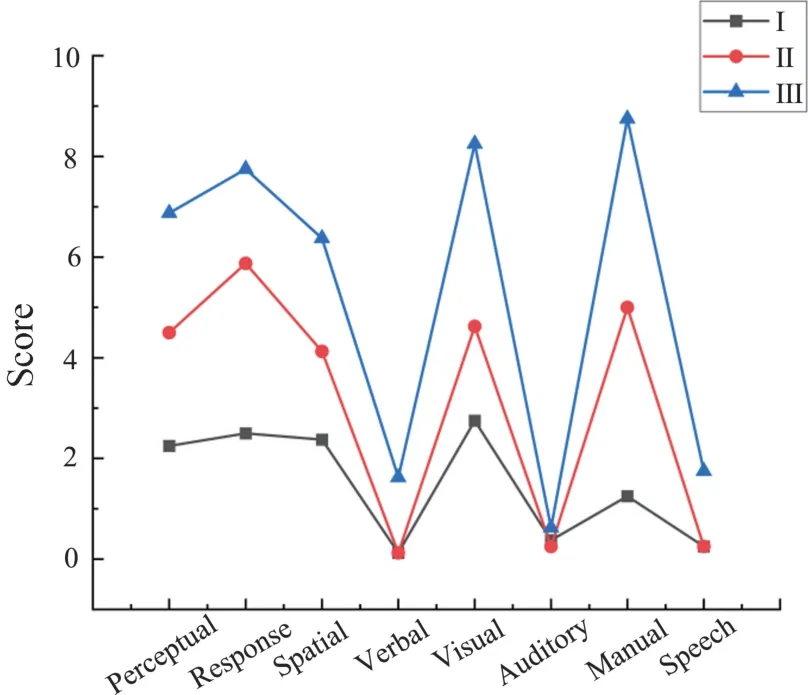
Fig.10 Diagnostic test of the WP scale
The three scales have the same performance in reliability and convenience of implementation.They also have same performance on intrusiveness because the evaluation is conducted after the experiment and will not make an influence.The final applicability evaluation results of the three scales are shown in Table 13.It can be seen from the table that NASA-TLX scale,which gets a score of 3, has the best comprehensive applicability.
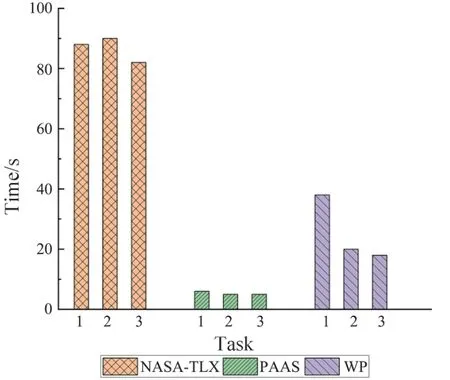
Fig.11 Scale completion time of the subjects
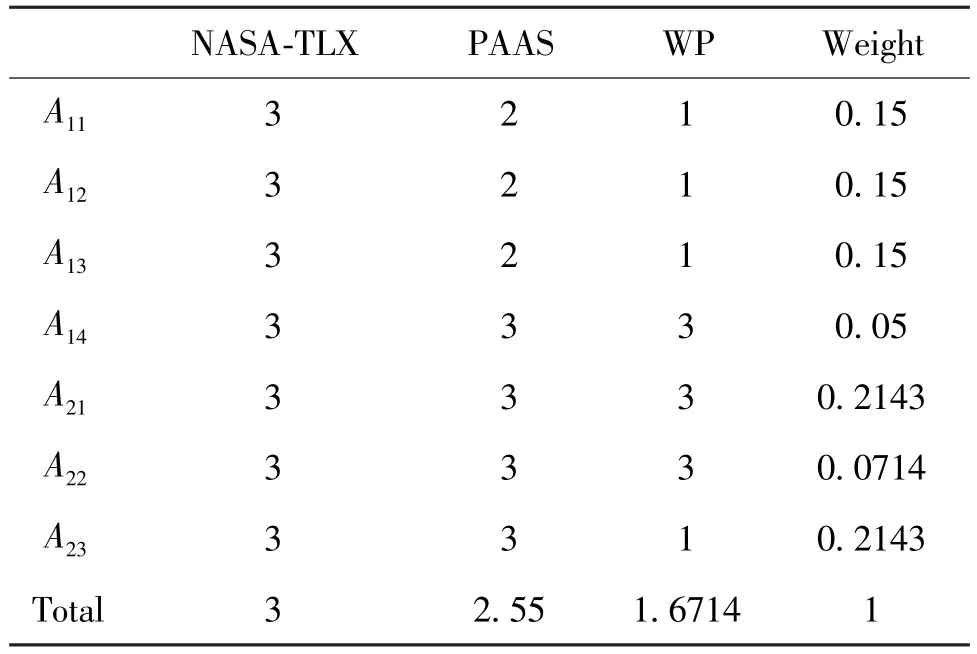
Table 13 The applicability evaluation results of NASATLX, PAAS and WP scales
5 Discussion
In this study, an assembly experiment is developed to evaluate the applicability of the NASA-TLX scale, PAAS scale, and WP scale.In terms of sensitivity, the NASA-TLX scale has the highest sensitivity because the six dimensions of the NASA-TLX scale have the highest correlation with the assembly task.So NASA-TLX scale has certain advantages in the cognitive load assessment of assembly operators.It is also able to predict the task performance of the operators.WP scale involves many mismatched indicators.So it is slightly inferior in fitness.In terms of the validity test of the scales, the convergent validity of the three scales is at the same level, but NASA-TLX scale has the highest concurrent validity.Diagnosticality refers to the ability of cognitive load assessment methods to reflect specific resource usage.All 6 dimensions of NASA-TLX scale and 2 dimensions of PAAS scale can distinguish the cognitive load changes of different task difficulties, indicating that these two scales have good diagnostic ability.WP scale diagnoses the use of different mental resources in the process of information processing.WP scale is unable to distinguish task difficulty in the three dimensions of verbal, auditory and speech.Some scholars exclude irrelevant indicators from WP scale before the experiment, but this is not applicable in assembly operation because assembly operation involves communication, even just simple selftalk, so as to deepen their understanding on assembly steps.Therefore, NASA-TLX scale performs best in diagnosticity.In terms of scale acceptance, this study compares the changes in completion time of subjects in each group.There is no significant difference on scale completion time in NASA-TLX group and PAAS group.But the completion time of WP scale is too long in experiment 1 especially.Based on the post-questionnaire survey, it is found that the names of dimensions displayed in WP scale are abstract.So the subject spend much time understanding the meaning of the names.Therefore, WP scale has poor acceptability, while NASA-TLX scale and PAAS scale have higher acceptability.
By combining various indexes and AHP model, it can be concluded that NASA-TLX scale has better applicability performance and can well reflect the changes of mental and physical loads of operators in the actual workshop assembly operation.Therefore, NASA-TLX scale is more suitable for cognitive load assessment in assembly work.
However, NASA-TLX scale is originally designed by the National Aeronautics and Space Administration(NASA) for the evaluation of cognitive load of heavy tasks in the space industry.It is different from the assembly industry to some extent.In the follow-up research, NASA-TLX scale can be determined as the standard, together with the self-designed cognitive load scale for assembly industry as the survey tool.Through the large sample experimental investigation, the iteration of the self-designed scale from the initial scale to the revised scale and then to the formal scale can be completed.After the reliability, validity and diagnostic test, the preparation and testing of the formal cognitive load scale can be completed and applied to the actual assembly industry.
6 Conclusion
In this study, a quantitative method for assessing the applicability of subjective scales is proposed.Firstly,a multi-scale research paradigm based on subjective evaluation method is developed.Typical tasks are extracted from the assembly operations.NASA-TLX scale, PAAS scale and WP scale are selected for multifactor mixed experimental design.PSD characteristics of EEG are utilized to identify the task difficulty levels.Then, the applicability related indexes of the three scales are evaluated.The applicability scores of NASATLX scale, PAAS scale and WP scale are respectively 3,2.55 and 1.6714 by combining AHP model.Therefore, NASA-TLX scale is selected as the most suitable subjective evaluation scale for assembly operations.This provides an effective quantitative evaluation method for cognitive load assessment of assembly workers.
杂志排行
High Technology Letters的其它文章
- Neural network hyperparameter optimization based on improved particle swarm optimization①
- RotatS:temporal knowledge graph completion based on rotation and scaling in 3D space①
- Design space exploration of neural network accelerator based on transfer learning①
- A fault recognition method based on clustering linear regression①
- Two stream skeleton behavior recognition algorithm based on Motif-GCN①
- Research on dual-command operation path optimization based on Flying-V warehouse layout①
