Application of the monitoring and early warning system for internal solitary waves:Take the second natural gas hydrates production test in the South China Sea as an example
2023-12-15DnyiSuBinbinGuoQinyongLingChujinLingFeilongLinSumengJingYifeiDongXueminWu
Dn-yi Su, Bin-bin Guo,*, Qin-yong Ling, Chu-jin Ling, Fei-long Lin, Su-meng Jing,Yi-fei Dong, Xue-min Wu
a Southern Marine Science and Engineering Guangdong Laboratory (Guangzhou), Guangzhou 511458, China
b National Engineering Research Center of Gas Hydrate Exploration and Development, Guangzhou 510075, China
c Guangzhou Marine Geological Survey, China Geological Survey, Ministry of Natural Resources, Guangzhou 510075, China
d Second Institute of Oceanography, Ministry of Natural Resources, Hangzhou 310012, China
e Nanjing University of Information Science and Technology, Nanjing 210044, China
Keywords:Internal solitary wave Early warning Offshore engineering Drilling platform Natural gas hydrates production test Shenhu Area South China Sea
ABSTRACT Internal solitary waves (ISWs) contain great energy and have the characteristics of emergency and concealment.To avoid their damage to offshore engineering, a new generation of monitoring and early warning system for ISWs was developed using technologies of double buoys monitoring, intelligent realtime data transmission, and automatic software identification.The system was applied to the second natural gas hydrates (NGHs) production test in the Shenhu Area, South China Sea (SCS) and successfully provided the early warning of ISWs for 173 days (from October 2019 to April 2020).The abrupt changes in the thrust force of the drilling platform under the attack of ISWs were consistent with the early warning information, proving the reliability of this system.A total of 93 ISWs were detected around the drilling platform.Most of them occurred during the spring tides in October-December 2019 and April 2020, while few of them occurred in winter.As suggested by the theoretical model, the full-depth structure of ISWs was a typical current profile of mode-1, and the velocities of wave-induced currents can reach 80 cm/s and 30 cm/s, respectively, in the upper ocean and near the seabed.The ISWs may be primarily generated from the interactions between the topography and semidiurnal tides in the Luzon Strait, and then propagate westward to the drilling platform.This study could serve as an important reference for the early warning of ISWs for offshore engineering construction in the future.©2023 China Geology Editorial Office.
1.Introduction
Oceanic internal waves occur in the ocean with stable stratification and their maximum amplitudes are up to tens to hundreds of meters.Low-frequency internal waves have wavelengths of tens or even hundreds of kilometers and propagation speeds of up to several meters per second, while high-frequency internal waves have wavelengths of hundreds to tens of hundreds of meters, propagation speeds of tens of centimeters per second, and periods ranging from 5-10 mins to 2-5 hours (Lee CY and Beardsley RC, 1974; Maxworthy T, 1979).The generation of internal waves is closely related to topography, the density stratification of water masses, and the disturbance of tidal and ocean currents (Holloway PE et al., 1997; Gerkema T, 2001; Du T et al., 2008; VanGastel P et al., 2009).
The South China Sea (SCS), which is the largest semiclosed marginal sea in China, boasts abundant oil and natural gas hydrates resources (Xiong LL et al., 2020; He JX et al.,2020).Internal waves are active in the SCS due to the complex geomorphic units, dramatic topographic changes,and pronounced seasonal thermoclines (Hsu MK et al., 2000;Fang XH and Du T, 2005).As a special type of internal waves, internal solitary waves (ISWs) have concentrated energy and large scales.Moreover, ISWs can result in the convergence of seawater and cause abrupt strong currents on the sea surface during their propagation.As a result, sea surface flow fields and density pycnoclines will significantly change.Without early warning of ISWs, abrupt strong waveinduced currents could cause vessels and platform on the sea to be out of control.Furthermore, the vessels may suddenly change course and even collide with offshore platforms.Offshore platforms, which are equipped with a dynamic positioning system nonetheless, respond to strong current attacks with a certain delay.Therefore, abrupt wave-induced currents will make offshore platforms lose balance, thus affecting their ongoing operations and threatening the safety of offshore engineering (You YX et al., 2010; Zhao JR et al.,2018).
The offshore engineering construction and drilling operations in the SCS have been repeatedly affected by ISWs since the 1980s.For instance, the semi-submersible drilling platform deployed near the Dongsha Islands by the China National Offshore Oil Corporation (CNOOC) once swayed by 110° in less than five minutes due to strong ISWs.During the drilling of Well LW13-1-1, the West Aquarius platform experienced an ISW at a speed of 3.8 knots, which moved the platform 37 m, broke the transmission pipelines, and made them wind around the tug propellers.Besides, the Nanhai VIII semi-submersible drilling platform moved hundreds of meters due to multiple attacks by ISWs when it drilled Well LH29-4-1.This resulted in damage to the platform facilities and the collision between the platform and a standby vessel(Ebbesmeyer CC et al., 1991).Therefore, it is of great practical significance and application value to build a monitoring and early warning system to achieve accurate detection and tracking of ISWs and reduce their potential threat to offshore engineering.
Many studies have been conducted on the observation(Ramp SR et al., 2004; Yang YJ et al., 2009; Huang XD et al.,2016) and numerical simulation (Cai SQ et al., 2000, 2012;Zhang Z et al., 2011) of ISWs in the SCS.Owing to the randomness of ISWs, it is difficult to employ existing numerical simulation technologies to achieve the accurate early warning of a single ISW withoutin-situobservation.Therefore, the monitoring and early warning of ISWs for offshore engineering are mainly implemented using the following three methods: (1) long-distance visual inspection and radar detection from standby vessels; (2) monitoring the temperature, salinity, and ocean currents using standby vessels; and (3) using buoys to monitor ISWs (Goff M et al.,2010; Wang HP et al., 2021; Chun MH et al., 2021).The first method has risks of artificial omissions or errors in identification.Moreover, this method tends to yield large errors in the arrival time of ISWs since it cannot obtain the characteristic parameters such as the propagation speed of ISWs.The second method suffers the disadvantages such as errors induced by the drifting of standby vessels, high shipping fees, and high labor costs.The third method can effectively improve the early warning accuracy of ISWs.However, the performance of this method was often degraded in the presence of data transmission delay and low robustness of buoy systems in the face of severe sea conditions (Hu WJ et al., 2015).Therefore, there is an urgent need to develop a new generation of early warning system using monitoring buoys for ISWs.
This study upgraded the data transmission mode and built a highly robust monitoring and early warning system for ISWs (also referred to as the ISW System), which used the real-time monitoring of double buoys and the technology of automatic software identification.This system was applied in the second natural gas hydrates (NGHs) production test in the Shenhu Area, SCS in 2020 (Ye JL et al., 2020).In addition, to deepen the understanding of ISWs and provide an important basis for future engineering construction in the SCS, this study analyzed the characteristics and generation mechanisms of ISWs in the study area using observation data.
This paper is organized as follows.Section 2 describes the data and methods used in this study.Section 3 introduces the characteristics of ISWs and the application effects of the ISW System.Section 4 includes the discussion of the generation mechanisms of ISWs in the study area, and the final section provides the conclusions.
2.Data and method
The ISW System was developed using the technologies of double buoys monitoring, intelligent real-time data transmission, and automatic software identification.In this system, two buoys deployed at different locations along the arrival direction of ISWs were used to monitor and send the oceanic data to an onshore server through a communication satellite.The server was adopted to receive, process, and store data from buoys and then sent data through the Internet to the ISW monitoring software installed on an offshore platform and in an onshore monitoring laboratory.The ISW monitoring software would automatically identify and output signals of ISWs and issue warnings, thus providing the early warning of ISWs for the offshore platform.Moreover, the onshore monitoring laboratory was equipped with a 24-hour artificial service, where the personnel would immediately inform operators on the offshore platform and proposed suggestions once they discovered the signals of ISWs (Fig.1).
2.1. Real-time monitoring using buoys
As shown by the historical observations near the drilling platform for the second NGHs production test, the ISWs in this area propagated at approximately 2.1-2.5 m/s (average:2.2 m/s) in the directions of approximately 270° (western)(Jackson CR et al., 2009).Therefore, buoy No.1 of the ISW System was deployed 27 km in the direction of 95° to the drilling platform, and buoy No.2 was placed 13.5 km in the direction of 85° to the drilling platform (Fig.2).They were used to provide the early warning of ISWs for the drilling platform 1.5-3 hours ahead of time.
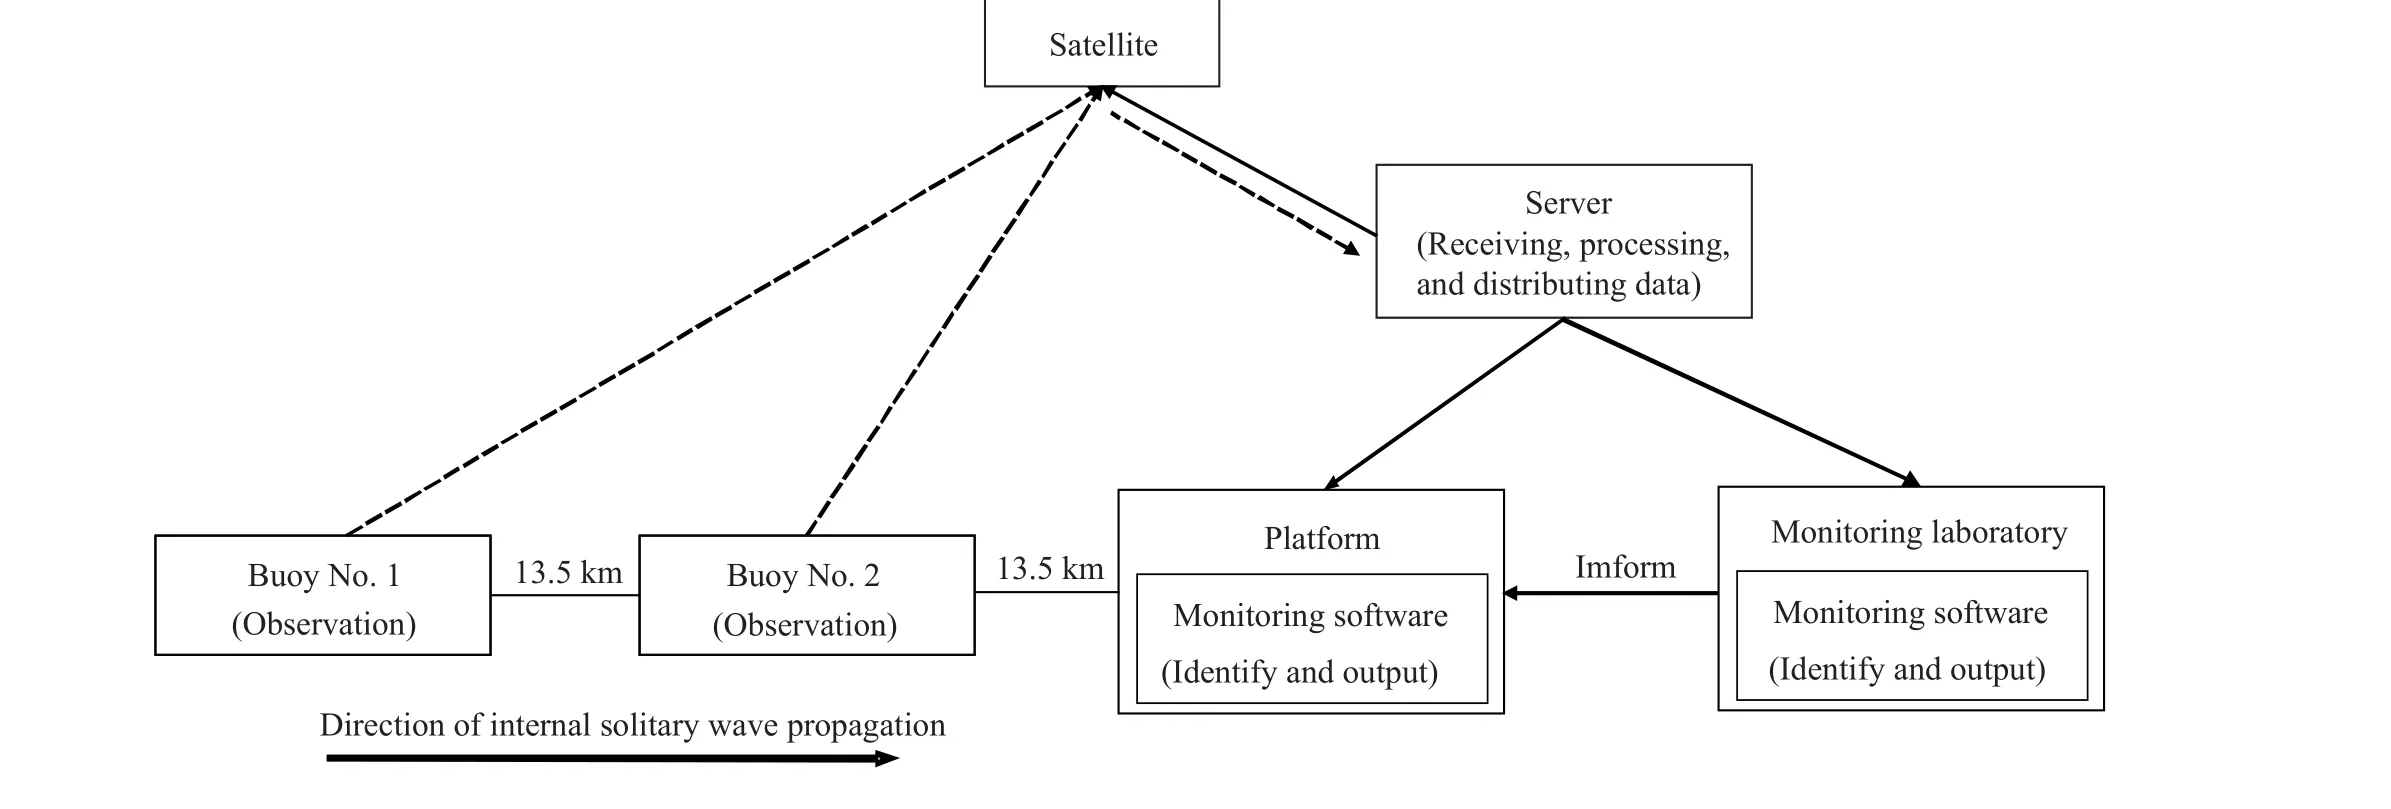
Fig.1.Technical framework of the monitoring and early warning system for ISWs.
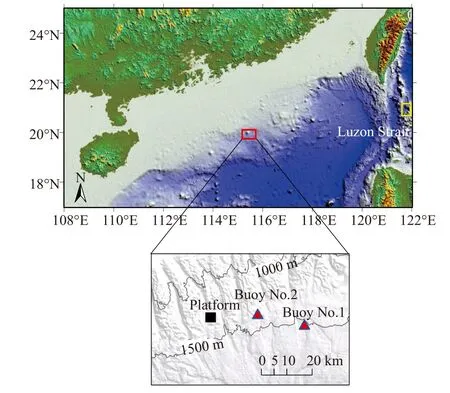
Fig.2.Locations of the drilling platform and monitoring buoys in the second NGHs production test.The red box denotes the study area(i.e., the target area for the monitoring and early warning of ISWs);the yellow box denotes the site of tide forecast data; the red triangles indicate the buoy stations; the black square is the position of the drilling platform; and the black lines indicate the water depth (unit:m).
The BETA-3M-C buoys were used in the ISW System.Each of them consisted of a buoy body, a sensor subsystem,an anchoring subsystem, and subsystems for data acquisition,data transmission, power supply, and tracking.Moreover,they were equipped with positioning and warning devices such as GPS and anchor lights (Fig.3).Their buoy bodies had maximum swing angles of less than 25°, less than 35°, and less than 45°, respectively in the case of the wave height of 5 m, 10 m, and 15 m.The buoy can automatically restore itself to the normal attitude even when it was inclined at an angle of 90° and can be placed in an area with a wind speed of less than 100 m/s, or with a wave height of less than 20 m, or with a flow velocity of less than 5 m/s.The sensors equipped in the BETA-3M-C buoys mainly included conductivitytemperature-depth sensors (CTDs, SBE 37-SM) and Acoustic Doppler Current Profilers sensors (ADCPs; TDRI Workhorse Quartermaster 150 kHz and TDRI Workhorse Sentinel 300 kHz).These sensors can monitor the pressure, temperature,and salinity of surface seawater and the velocity profiles of upper ocean currents (Table 1).The monitoring data and the operating state of buoys were transmitted to the onshore server in real time through an Iridium 9522B satellite transceiver.
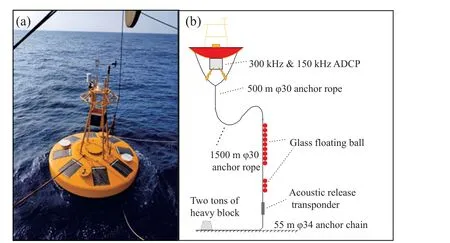
Fig.3.Structure of a buoy used in the ISW System.Physical picture (a); overall structure (b).
The ISW System was designed to comprise double buoys with dual ADCPs each and an intelligent data transmission mode, which further improved its robustness.Specifically,each of the buoys was equipped with a 150 kHz and a 300 kHz ADCP, thus successfully combining a high measuring range and a high accuracy.Moreover, the ISW System can provide effective early warning of ISWs as long as one of the ADCPs normally worked.In addition, given the massive amounts of monitoring data, the ISW System adopted a new intelligent data transmission mode to avoid data transmission failure caused by factors such as bad weather and sea conditions.In detail, the latest monitoring data would be preferentially transmitted when large amounts of historical monitoring data were waiting to be sent, thus ensuring the timeliness of early warning.Furthermore, the users can remotely control the data transmission switches, the priority orders of the four ADCPs and other auxiliary sensors in real time according to the states of data transmission and the Iridium 9522B satellite transceiver.The ISW System operation and real-time data transmission performed well in the second NGHs production test.The data from CTDs and ADCPs were transmitted at an interval of 1 hour and 12 mins,respectively.Owing to such high-frequency data transmission,the delay in the early warning of ISWs was less than 12 mins.
2.2. Data processing and software identification of ISWs
The ISW System adopted automatic software identification technology to detect ISWs.After receiving the observation data transmitted from buoys in real time, the ISW monitoring software automatically conducted data processing,identified the signals of ISWs, and issued warnings.Firstly,based on the finite depth model (Joseph RI et al., 1978) and the temperaturevs.salinity profiles, the authors calculated the parameters of various modes of ISWs in the study area(including the velocity of wave-induced current and the depth,acceleration, and duration of ISWs) and built up a database.During the application, the ISW monitoring software processed the observation data transmitted from the buoys in real time and obtained the characteristics of upper ocean currents.Afterward, it compared these characteristics with the database and calculated the similarity.Once the similarity exceeded a certain threshold, the software automatically sent out warning signals of ISWs.Moreover, the propagation speed of an ISW can be calculated based on the distance between the two buoys and the time interval of the ISW passing through them.Subsequently, the time when the ISW arrived at the drilling platform was predicted according to the distance from buoy No.2 to the drilling platform, and previous information was correspondingly updated.In sum,the ISW information issued by the software included the time when an ISW passed through two buoys; the velocity and depth of the maximum wave-induced current observed; the maximum velocities of the upwelling and downwelling currents; and the predicted time when an ISW arrived at the drilling platform.
To reduce potential risks such as software failures and omissions caused by the automatic identification algorithm, a 24-hour artificial service was arranged for the onshore monitoring laboratory, where manual auxiliary diagnoses were made on the following bases: (1) ISWs may occur if the horizontal velocity of upper ocean currents surges to more than 60 cm/s in 6-20 mins; (2) ISWs may occur if strong upwelling (>5 cm/s) and downwelling (<-5 cm/s)simultaneously take place in the upper ocean in 10-30 mins;(3) westward or northwestward ISWs may occur if the upper ocean currents are greater than 45 cm/s in the west or northwest direction.Besides, the personnel further confirmed signals of ISWs by comparing the propagation velocities measured by a single buoy with those calculated using the observation data from the two buoys.They would immediately report the information of ISWs whose modes were not registered in the database to the operators on the drilling platform, and confirmed the impacts of these ISWs.If any impact was caused, it can be determined that an ISW with a special mode had occurred and would be saved into the database, thus constantly updating the database.In addition,the software can monitor the status of buoys in real time and send out information on their abnormal working states,displacement, and failures, which assist in maintaining the buoys in time to keep them operating normally and stably.
To fulfill the safety construction requirements of the second NGHs production test, the study defined the intensity grading of ISWs based on the velocities of wave-induced currents and proposed corresponding measures (Table 2).
2.3. Simulation of ISWs
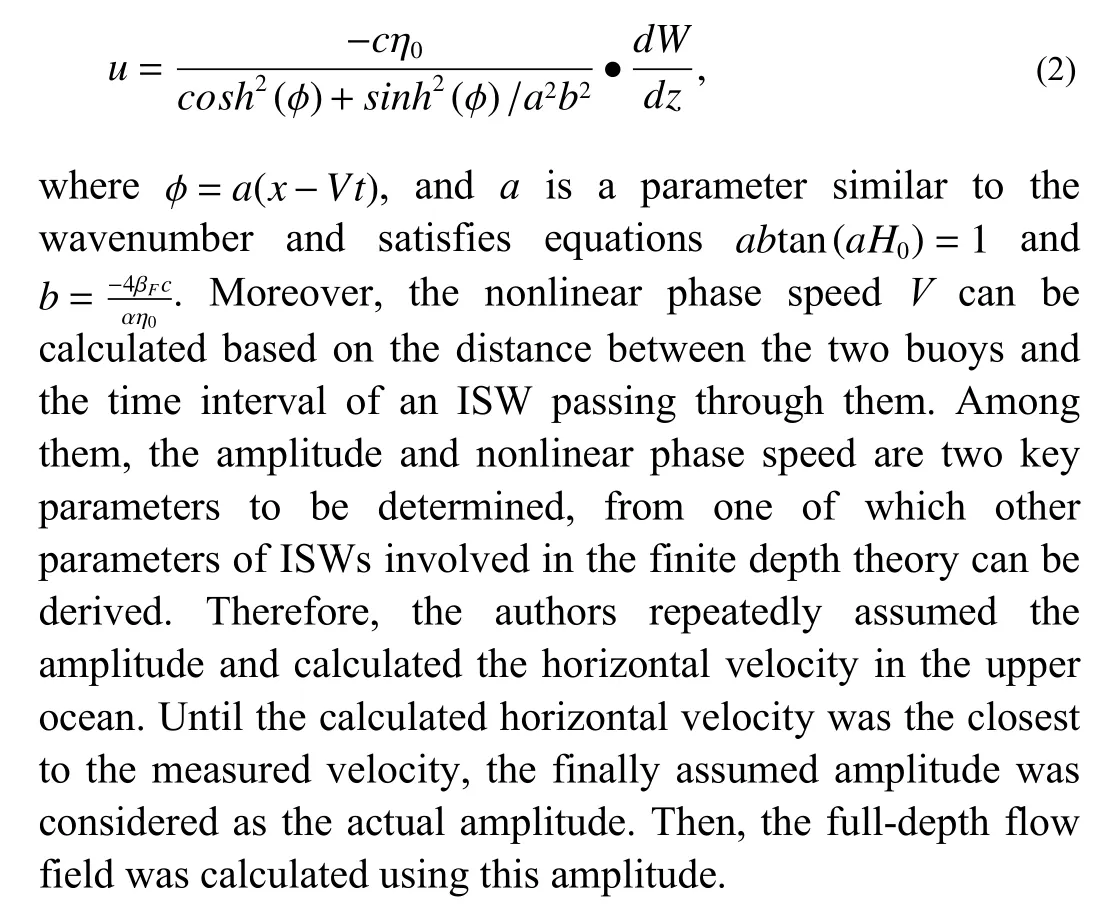
The ADCPs equipped in the buoys cannot obtain the fulldepth vertical structure of ISWs since their maximum measuring range was only 124 m.However, the impacts of ISWs on the seabed also need to be considered in offshoreengineering.Given this, the authors simulated the vertical structures of ISWs using the finite depth theory (Grimshaw R,1985; Pierini S, 1989).The amplitude of an ISW in a finite depth fluid satisfies the following equation:

Table 1.Monitoring indices and data collection settings of buoy sensors.

Table 2.Measures against ISWs of different intensity gradings.
whereηandcare the amplitude and the linear phase speed of ISW, respectively;αis a nonlinear parameter;H0is the water depth;βFis the dispersion parameter in the finite depth theory.Solving this equation yields the following horizontal velocity component (Cai SQ et al., 2015):
3.Application results
During the second NGHs production test, two buoys were deployed to the east of the drilling platform to ensure the safety of the engineering.They successfully provided realtime monitoring and early warning of ISWs for 173 days(from October 12, 2019 to April 17, 2020).
3.1. Monitoring effects and statistical characteristics of ISWs
A total of 93 ISWs were detected in the study area during the second NGHs production test, including 8 with very high intensity, 11 with high intensity, 25 with medium intensity,and 49 with low intensity.These ISWs mainly occurred at 8-96 m in the upper ocean.Moreover, the velocity, directions,and durations of the wave-induced currents were 19.1-79.8 cm/s, 250°-303°, and 3-27 mins, respectively (Table 3).As for the 44 ISWs with medium or higher intensity, the ISW System issued effective early warnings to the drilling platform and provided accurate information of ISWs in time, thus ensuring the safety of the second NGHs production test.
Fig.4 shows the strongest ISW detected during the second NGHs production test.This ISW, which propagated from the east toward the drilling platform, arrived at buoy No.2 at12:42 on April 11, 2020.The velocities of currents at 60 m surged from 40 cm/s to 108 cm/s (Fig.4a) in the direction of approximately 262°.The currents with velocity of greater than 60 cm/s lasted for 30 mins (Fig.4c).Then this ISW passed by buoy No.1 at 13:57 that day.Its peaks detected by both buoys had the time interval of 75 mins.Since the distance between the two buoys was 13.5 km, the propagation speed of the strongest ISW was 10.8 km/h.The ISW System sent out an early warning to the drilling platform and predicted that the strongest ISW would arrive at 15:12 according to its propagation speed and the distance between buoy No.1 and the drilling platform (13.5 km).When an ISW arrived at the drilling platform, the dynamic positioning system of the platform would exert a reaction force (i.e., the thrust force) to prevent the platform from moving.The thrust force of the drilling platform showed that the ISW attacked the platform at 15:12 and that the enhanced thrust force lasted for approximately 30 mins (Fig.5), which was consistent with the early warning information.It proved that the new generation of the monitoring and early warning system can provide accurate early warning of ISWs for offshore platforms.
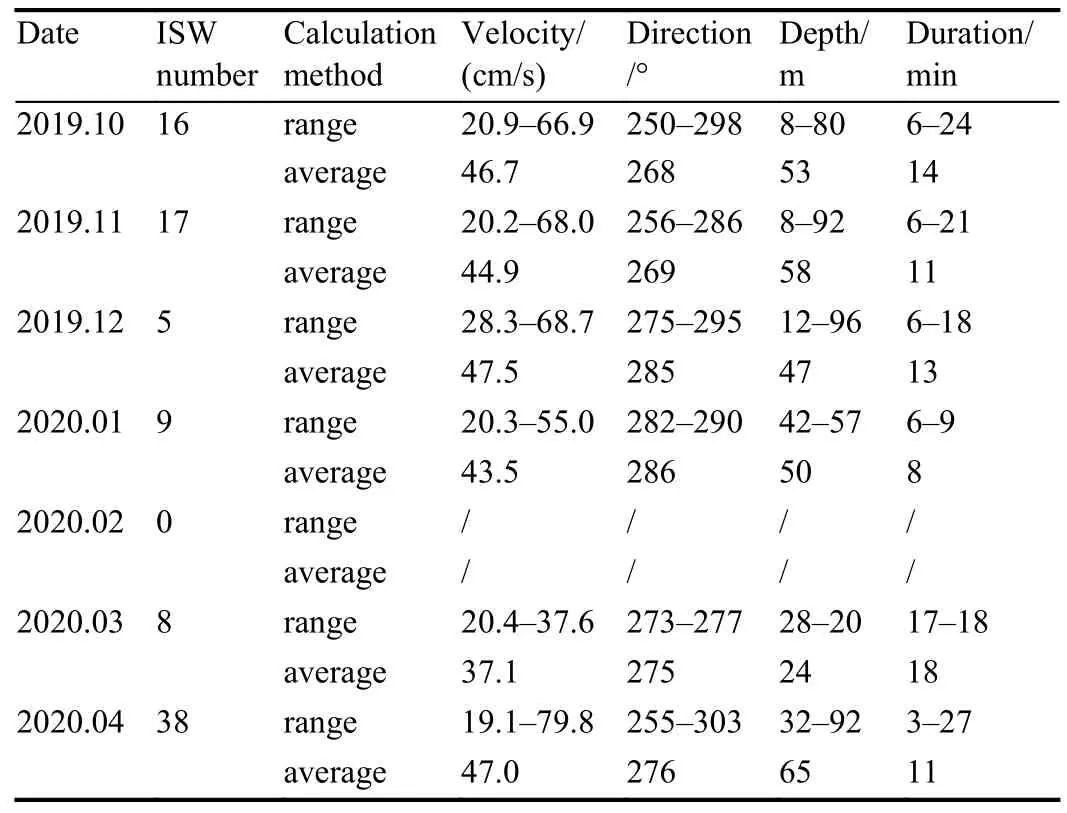
Table 3.Characteristics of ISWs (from October 12, 2019 to April 17, 2020).
3.2. Temporal variations of ISWs
Based on the 6-month observation data, the authors analyzed and summarized the temporal variations of ISWs in the study area.Fig.6 shows the statistical characteristics of ISWs and the time series of semidiurnal tides near the Luzon Strait (Fig.2; yellow box).The tide forecast data in this figure originated from the global tide model TPXO (Egbert GD et al., 1994; Egbert GD and Erofeeva SY, 2002).It can be inferred that the ISWs in the study area mainly occur during spring tides from October to December, 2019 and in April,2020.For instance, ISWs were generally detected every day from October 17 to October 22 and from October 30 to November 4.These two periods had an interval of approximately 15 days, which exactly corresponded to the spring tide period.
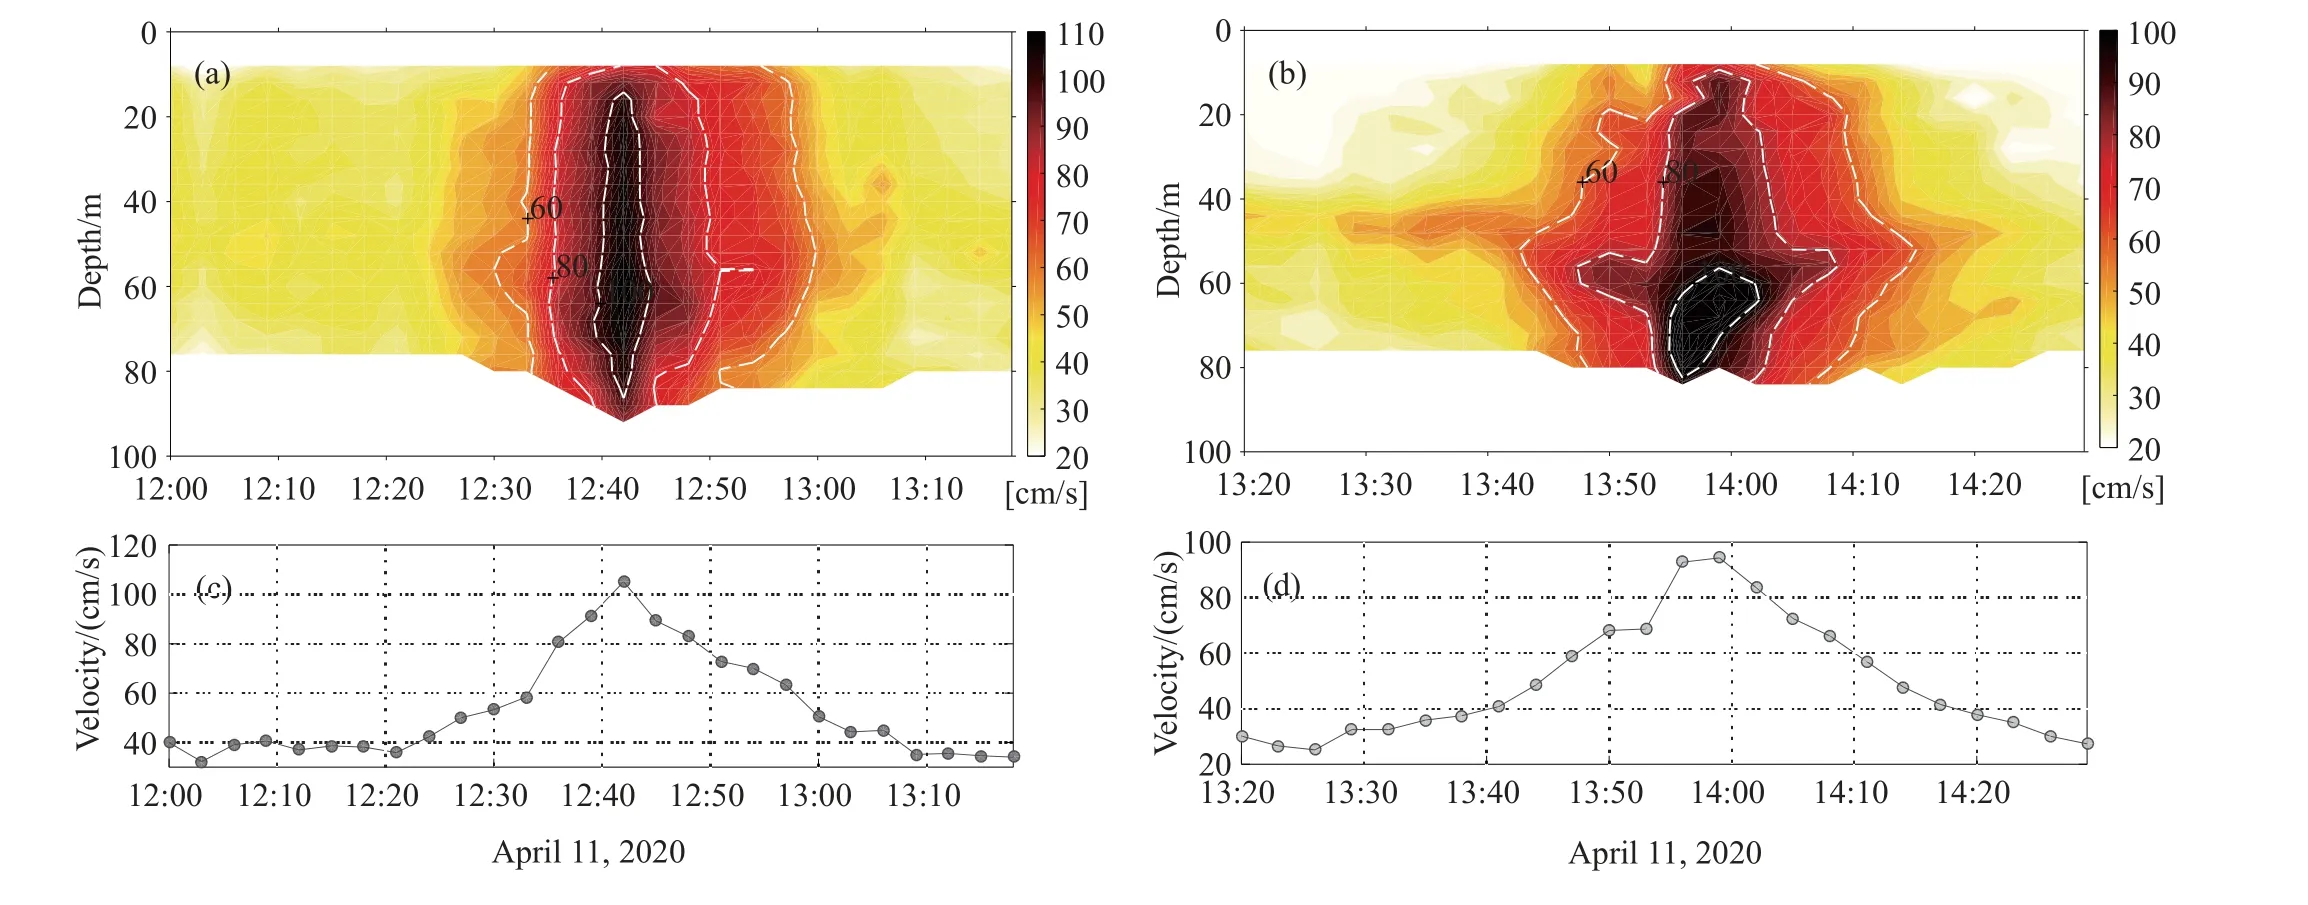
Fig.4.Velocity profiles of upper ocean currents (a, b) and average velocity at 0-100 m (c, d) when the strongest ISW passed through buoys No.2 (left) and No.1 (right) on April 11, 2020.
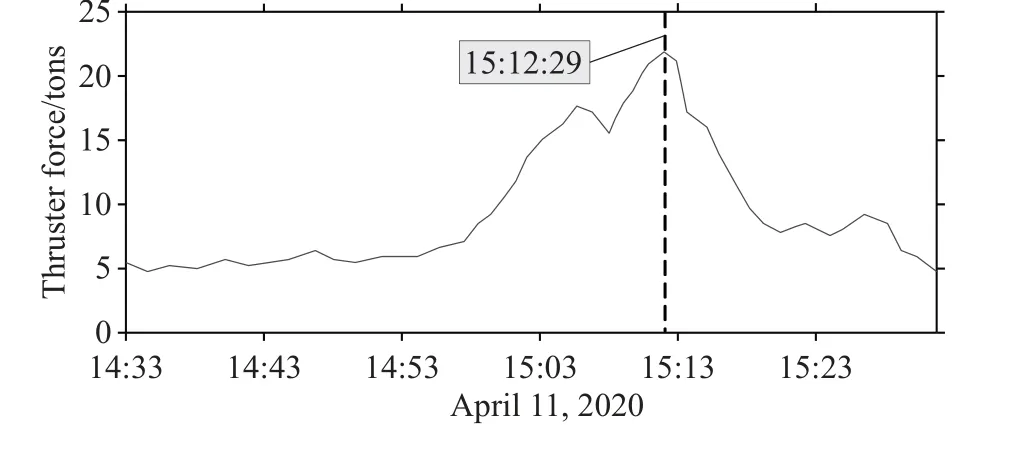
Fig.5.Changes in the thrust force of the drilling platform when the strongest ISW passed on April 11, 2020 (unit: tons).

Fig.6.Time series of ISWs in the study area.Velocity of wave-induced currents (a); depth of the maximum velocity (b); duration of the ISWs (c); semidiurnal tides near the Luzon Strait (d).
As shown by the monthly statistics, the ISW number, the velocities and durations of wave-induced currents gradually decreased from October 2019 to March 2020 (Table 3, Figs.6a and 6c), and the average direction progressively shifted from southwest to west.However, the ISWs significantly intensified and occurred more frequently in April 2020.That is to say, the ISWs in the study area had apparent seasonality and occurred the least frequently in winter.This phenomenon may be related to the seasonal changes in the upper density pycnoclines in the SCS and the westward energy flux from the Luzon Strait (Li MJ, 2012; Chen L et al., 2019).In addition, as shown by the daily statistics, the ISWs, especially those with very high intensity, were concentrated at 05:00-06:00 and 13:00-14:00 (Fig.7).This occurred possibly because the energy of the ISWs was primarily sourced from semidiurnal tides (Duda TF et al., 2004; Li Q and Farmer DM, 2011).
3.3. Vertical structure of ISWs

Fig.7.Daily distribution of the velocity of wave-induced currents during the monitoring.

Fig.8.The horizontal velocity profile (a) and the vertical shear profile (b) when the strongest ISW passed by buoy No.2 on April 11, 2020,and the temperature vs.salinity profile (c) near buoy No.2 in April 2021.
Fig.8 shows the profile and the vertical shear profile of the horizontal velocity of wave-induced currents when the strongest ISW passed by buoy No.2 on April 11, 2020, as well as the temperaturevs.salinity profile near the buoy in April 2021.It can be found that the strongest shear occurred in the thermoclines (approximately 80-90 m, Figs.8b and 8c)when the ISW approached and left.Besides, the authors simulated the vertical structure of the ISWs using the observation data from buoy No.2 and the finite depth theory(Fig.9).The simulation results at 0-100 m were consistent with the observation results.Specifically, both results showed that the maximum velocities of wave-induced currents were up to 100 cm/s, the cores of the currents were roughly located at 100 m, and the wave-induced currents with velocities of greater than 60 cm/s lasted for approximately 30 mins (Figs.9a and 9b).The simulated velocity profile indicated that the velocity of wave-induced currents at 1500 m was up to 30 cm/s and its direction was opposite to that in the upper ocean(Fig.9c).These results suggested that the vertical structure of ISWs in the study area was a typical current profile of mode-1.
4.Discussion
According to previous studies, the ISWs in the SCS are mostly generated from the Luzon Strait due to lee wave and the interactions between tides and local topography (Liu AK et al., 1998, 2004; Zhao Z et al., 2004; Buijsman MC et al.,2010).Based on the empirical formula proposed by Jackson CR et al.(2009), the authors calculated the time it takes for the ISWs originating in the Luzon Strait to propagate to different locations in the SCS.
Fig.9.Vertical structure of the strongest ISW passed by buoy No.2 on April 11, 2020.Simulation results at 0-100 m (a); monitoring results at 0-100 m (b); simulated full-depth structure (c).
In equation (3),T(x,y) is the time it takes for waves to propagate from the start position (x0,y0) to other position (x,y),andC(x,y) is the empirical formula of the phase speed of waves (Jackson CR et al., 2009), which is applicable to the SCS.In equation (4),H(x,y) is the water depth;Cmaxis the maximum phase speed (~2.971 m/s);B1andB2are terms that determine how rapidly variations in depth will affect the slowing and refracting of the waves.In this study,B1= 0.003 andB2= 1390.758.
As suggested by the temporal distribution of waveinduced currents and tidal currents in the Luzon Strait (Fig.6d),the time when the ISWs intensively occurred in the study area lagged the period of semidiurnal tides in the Luzon Strait for 2-3 days.This delay exactly matches the time it takes for the ISWs originating in the Luzon Strait to propagate to the study area (approximately 2.7 days, Fig.10).Therefore, it can be inferred that some of the ISWs in the study area mainly originated from the interactions between the topography and the semidiurnal tides in the Luzon Strait.
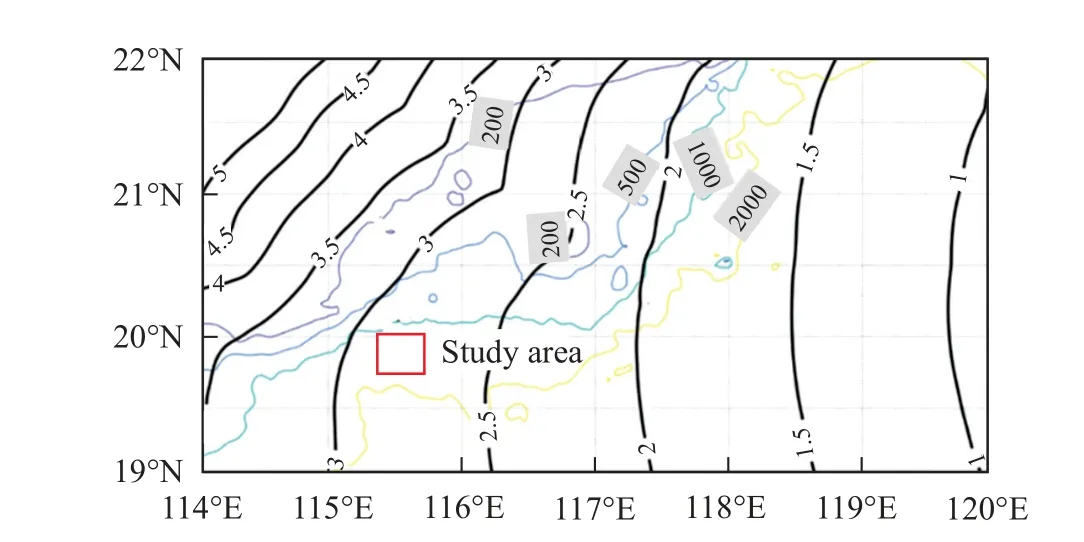
Fig.10.Time it takes for ISWs to propagate from the Luzon Strait to the study area (black solid lines; unit: day).The colorful solid lines denote water depth (unit: m), and the red box denotes the study area.
5.Conclusions
This study developed a new generation of monitoring and early warning system for ISWs in order to provide accurate early warning of ISWs for offshore engineering and better ensure its safe implementation.The ISW System was successfully applied to the second NGHs production test in the Shenhu Area, SCS from October 12, 2019 to April 17,2020.
Based on two buoys deployed near the drilling platform,the ISW System obtained the observation data in real time.Afterward, the data were transmitted to an onshore server through a satellite, and sent through the Internet to the ISW monitoring software.Then, the independently developed ISW monitoring software identified the signals of ISWs and issued warnings in time.The ISW System adopted double buoys with dual ADCPs each, an intelligent data transmission mode,and automatic software identification technology, which greatly improved its robustness in the face of severe sea conditions.
During the second NGHs production test, 93 ISWs were detected in total, including 8 with very high intensity and 11 with high intensity.As shown by the thrust force of the drilling platform, the time at which the strongest ISW reached the platform and the duration of the wave-induced current were consistent with the early warning information.This consistency suggested that the ISW System can provide accurate and effective warning signals of ISWs for offshore platforms.The statistical results showed that the ISWs in the study area occurred the least frequently in winter and that most of them occurred during the spring tides from October to December, 2019 and in April, 2020.The ISWs mainly appeared at 8-96 m, with durations of 3-27 mins.The velocities of wave-induced currents were at 19.1-79.8 cm/s in directions of 250°-303°.
As revealed by the theoretical model and the observation data, the vertical structure of ISWs in the study area was a typical current profile of mode-1, and the wave-induced currents near the seabed can reach 30 cm/s.The ISWs were primarily generated from the interactions between the semidiurnal tides and local topography in the Luzon Strait.The characteristics of ISWs revealed by this study can provide important information for the design of other offshore engineering in the Shenhu Area, South China Sea.Moreover,the ISW System is expected to be widely used in offshore engineering construction.CRediT authorship contribution statement
Bin-bin Guo, Qian-yong Liang and Chu-jin Liang conceived of the presented idea.Yi-fei Dong and Xue-min Wu carried out the implementation, Dan-yi Su, Chu-jin Liang,Fei-long Lin and Su-meng Jiang developed the theoretical formalism, performed the analytic calculations, and contributed to the interpretation of the results.Dan-yi Su and Bin-bin Guo wrote the manuscript with input from all authors.Declaration of competing interest
The authors declare no conflicts of interest.Acknowledgment
This study was funded by the Key Special Project for Introduced Talents Team of Southern Marine Science and Engineering Guangdong Laboratory (Guangzhou)(GML2019ZD0307), the Marine Geological Survey Program of China Geological Survey (DD20190218, DD20221706),the Key Program of Marine Economy Development Special Foundation of Department of Natural Resources of Guangdong Province (GDNRC [2020] 043), and the National Natural Science Foundation of China (41806074, 41730528).The authors would like to extend their gratitude to the staff of all expeditions of R/V Haiyangdizhi 6 and R/V Haiyangdizhi 4 for their assistance in the setting, picking up, and maintenance of the buoys used in this study.
杂志排行

China Geology的其它文章
- Melt extraction and mineralization: A case study from the Shuangjianzishan supergiant Ag-Pb-Zn deposit (208 Mt), Inner Mongolia, NE China
- Health risk assessment of heavy metals in soils and crops in a mining area (Au-Ag-Cutrona-oil et al.) of the Nanyang Basin, Henan Province, China
- Classification and mineralization of global lithium deposits and lithium extraction technologies for exogenetic lithium deposits
- A three-dimensional Moho depth model beneath the Yemeni highlands and rifted volcanic margins of the Red Sea and Gulf of Aden, Southwest Arabia
- Heavy metal pollution assessment in marine sediments in the Northwest coast of Sabah,Malaysia
- Reply: Comment on “Geological mapping and mining prospecting in the Aouli inlier(Eastern Meseta, Morocco) based on remote sensing and geographic information systems (GIS)” by Benaissi et al.(China Geology, 5 (2022))