Health risk assessment of heavy metals in soils and crops in a mining area (Au-Ag-Cutrona-oil et al.) of the Nanyang Basin, Henan Province, China
2023-12-15QiuyaoDongHaotianWnPanWangChaoSongShuyaLaiZhnjingYangYuanyiZhaoMingjiangYan
Qiu-yao Dong, Hao-tian Wn,c, Pan Wang,*, Chao Song, Shu-ya Lai,d, Zhn-jing Yang,Yuan-yi Zhao, Ming-jiang Yan
a Institute of Hydrogeology and Environmental Geology, Chinese Academy of Geological Sciences, Shijiazhuang 050061, China
b Key Laboratory of Quaternary Chronology and Hydro-Environmental Evolution, China Geological Survey, Ministry of Natural Resources, Shijiazhuang 050061, China
c School of Earth Sciences and Resources, China University of Geosciences (Beijing), Beijing 100083, China
d School of Earth Sciences, Hebei GEO University, Shijiazhuang 050031, China
e Institute of Mineral Resources, Chinese Academy of Geological Sciences, Beijing 100037, China
Keywords:Heavy metal Zn-Cd-Pb pollution Cr-Ni pollution As pollution Natural ecosystem Health risk assessment Adult-children health risk Ecological risk index (ERI)Ecological geological engineering Mining activity
ABSTRACT Heavy metal distribution in mining areas has always been a hot research topic due to the special environment of these areas.This study aims to explore the impact of heavy metal pollution on soils and crops in the study area, ensure the safety of local crops and the health of local residents, and provide a basis for the subsequent environmental restoration and the prevention and control of environmental pollution.Based on the analysis of the heavy metal concentrations in local soils and crops, the study investigated the spatial distribution, pollution degrees, and potential ecological risks of heavy metals in the farmland of a mining area in the southeastern Nanyang Basin, Henan province, China explored the sources of heavy metals and assessed the health risks caused by crop intake.The results of this study are as follows.The root soils of crops in the study area suffered heavy metal pollution to varying degrees.The degree of heavy metal pollution in maize fields is higher than that in wheat fields, and both types of fields suffer the most severe Cd pollution.Moreover, the root soils of different crops suffer compound pollution.The root soils in the maize fields suffer severe compound pollution at some sampling positions, whose distribution is similar to that of the mining area.Cd poses the highest potential ecological risks among all heavy metals, and the study area mainly suffers low and moderate comprehensive potential ecological risks.The principal component analysis (PCA) shows that the distribution of Zn, Cd, Pb, and As in soils of the study area is mainly affected by anthropogenic factors such as local mining activities; the distribution of Cr and Ni is primarily controlled by the local geological background; the distribution of Hg is mainly affected by local vehicle exhaust emissions, and the distribution of Cu is influenced by both human activities and the geological background.Different cereal crops in the study area are polluted with heavy metals dominated by Cd and Ni to varying degrees, especially wheat.As indicated by the health risk assessment results, the intake of maize in the study area does not pose significant human health risks;however, Cu has high risks to human health, and the compound heavy metal pollution caused by the intake of wheat in the study area poses risks to the health of both adults and children.Overall, the soils and crops in the study area suffer a high degree of heavy metal pollution, for which mining activities may be the main reason.
1.Introduction
Soil is an important part of the earth’s environment and natural ecosystem and is also the largest land resource that is the most closely related to people’s life (Gao LD et al., 2020).With the development of society and the economy,environmental problems (e.g., vegetation destruction, soil erosion, and air pollution) have become increasingly prominent, and heavy metal pollution in soils is particularly severe.Anthropogenic factors, such as mining activities,metal smelting, and factory exhaust emissions, have become the main sources of heavy metal pollution of local soils and crops.Compared with other pollutants, heavy metals are widely distributed, difficult to find and remove, and greatly harmful (Li GY et al., 2011).They are prone to be enriched through food chains, thus posing a great threat to human activities and lives.Therefore, the heavy metal pollution of soils and crops in mining areas has attracted much attention of numerous researchers (Granero S and Domingo JL, 2002;Nesta BS et al., 2015; Lin J et al., 2021; Bao LR et al., 2020;Hu QQ et al., 2019).However, different areas have different characteristics and risks of heavy metal pollution due to different soil characteristics, heavy metal pollution conditions,and vegetation types in these areas (Wu GH et al., 2020; Xia W et al., 2018; Li J et al., 2008; Chen F et al., 2017).The correct and objective analysis and assessment of the current status and risks of heavy metal pollution in soils and crops in different areas are essential for the prevention and control of heavy metal pollution as well as relevant remediation and restoration in the future (Zou LL et al., 2017; Dong QY et al.,2022).
Tongbai County in Henan Province is rich in mineral resources, and its mineral resources per capita and km2are 14 and 25 times the corresponding national average level,respectively.Mineral exploitation in this county has a long history.However, the long-term unregulated mineral exploitation in the last century led to varying degrees of pollution of vegetation, air, and groundwater in the county and its surrounding areas (Lai SY et al., 2021; Zang J, 2011;Liu XQ et al., 2004).It is critical to achieve scientific mining and prevent the environmental pollution caused by waste gas,wastewater, and waste residues.Previous studies of soil acidification and heavy metal pollution characteristics in the Nanyang Basin (including the study area; Lai SY et al., 2021;Ma ZB et al., 2021; Zhang PW et al., 2021; Xie QF et al.,2021; Dong QY et al., 2022a) have preliminarily revealed the soil pollution characteristics in the study area.However, these studies mostly focus on pollution assessment on a large spatial scale, while the pollution of the soil-crop system in polluted areas has been scarcely researched.In particular, there is a lack of systematic analyses of the pollution, enrichment, and risks to human health of heavy metals in surrounding soils and crops.
Based on the anomaly data from the 1∶250000 land quality geochemical survey of the farmland in southwest Nanyang Basin, this study analyzed the characteristics of local root soil and crop pollution using the single-factor pollution index (SFPI) method and the Nemerow comprehensive pollution index (NPI) method.Moreover, this study assessed the local ecological risks using the potential ecological risk index (ERI) method, attempted to interpret the sources of heavy metals in soils using the principal component analysis(PCA) method, and assessed the possible human health risks induced by the intake of crops in the study area.The purpose of this study is to strengthen the management of heavy metal risks in the soils of the study area, ensure the quality safety of local crops and the health of residents, and provide a scientific basis for subsequent environmental restoration and the prevention and control of environmental pollution.
2.Materials and methodology
2.1. Overview of the study area
The study area is located in southern Henan Province and on the eastern margin of the Nanyang Basin.Regarding administrative division, this area extends to the north of Tongbai County and the south of Biyang County and consists of five townships (Fig.1a).The study area has geographical coordinates of 32°27′-32°43′N and 113°5′-113°37′E and covers an area of approximately 761 km2.It has a warm and humid continental climate of northern subtropical monsoon type, with four distinct seasons and abundant rainfall.The landforms in the study area are dominated by low mountains and hills, with lush forests.The crops in the study area mainly include wheat and maize.The study area lies in the northern Qinling tectonic subzone, and extremely developed structures and four phases of frequent magmatic activities have created extremely rich mineral resources in the study area (Fig.1b).This area has a long mining history.Medium-sized copper deposits were discovered in this area as early as the 1960s, and a super-large gold deposit was discovered in October 2021, with a preliminarily estimated gold metal of 31.55 t.Up to now,more than 50 types of mineral deposits have been proven in the study area, including the trona deposits, whose reserves rank first in Asia and second in the world.This area also hosts the largest open-pit gold deposit in China and the Tongbai silver deposit —the top-ranking out of four major silver deposits in China.Moreover, local oil and kyanite are also important in China.
2.2. Sample collection and processing
Areas with elemental anomalies were identified based on the 1∶250000 land quality geochemical survey of the Nanyang Basin (Tongbai-Biyang area).To analyze the pollution sources and the pathways of heavy metals from the pollution sources to the soils in these areas, this study evenly deployed sampling points in the prevailing wind directions in the farmland of the study area according to the distribution of crops and the locations of mining and tailing areas.A total of 32 samples were collected from May to June 2020, including 16 wheat samples and 16 samples of root soils (depth: 0-20 cm).Subsequently, a total of 46 samples were collected from August to September 2020, including 23 maize samples and 23 samples of root soils (depth: 0-20 cm).The crop samples were collected using the plum blossom point method.In other words, a land area of 2000 m2was taken as a sampling unit,from which 15 samples were collected and mixed in equal amounts to form a mixed sample.The root soils in crop fields were collected simultaneously.The quartation method was employed to collect mixed soil samples (1 kg each).Then,each mixed soil sample was air-dried in the shade and then ground and filtered through a 20-mesh nylon screen for analysis after impurities (e.g., plant roots, stones, and insects)in the sample were removed.Each mixed crop sample weighed more than 500 g.After being cleaned, dried, peeled,and ground, the mixed crop samples were packed into polyethylene-sealed bags and then sent to the laboratory for analysis.
2.3. Test methods and data processing
The samples were analyzed at the Henan Province Rock and Mineral Testing Center.The Cr concentration in soils was measured according to DZ/T 0279-2016Analysis Methods for Regional Geochemical Sampleusing a ZSX Primus II X-ray fluorescence spectrometer.The Cd, Pb, Zn, Ni, and Cu concentrations in soils were determined according to GB/T 14506-2010Methods for Chemical Analysis of Silicate Rocksusing an XSERIES2 inductively coupled plasma mass spectrometer (ICP-MS).The As and Hg concentrations were measured using a BAF-2000 atomic fluorescence photometer.The As concentration was measured according to DZ/T 0279-2016Analysis Methods for Regional Geochemical Sample,and the Hg concentration was measured according to NY/T 1121.10-2006Soil Testing.Part 10:Method for Determination of Soil Total Hydrargyrum.For crop samples,microwave digestion using HNO3-H2O2was conducted first.Then, the Cd, Cr, Pb, Zn, Ni, and Cu concentrations in the crop samples were determined as per GB 5009.268-2016National Food Safety Standard:Determination of Overall Migrationusing an XSERIES2 ICP-MS.During the tests, the accuracy and precision of the measured data were controlled by analyzing the national primary certified reference materials, and the qualified rates of the analytical accuracy and precision of each element were all ≥ 98%.The minimum detection limit of each analytical method was equal to or better than the requirements specified in DZ/T 0295-2016Specification of Land Quality Geochemical Assessment.
The data on soils and crops in the study area were statistically analyzed using Excel and the SPSS 25.0 software,and plots were mainly prepared using the ArcGIS 10.6 software.
2.4. Assessment criteria and methods for heavy metals
The critical values for the heavy metal assessment of farmland soil referred to GB 15618-2018SoilEnvironmental Quality-Risk Control Standard for Soil Contamination of Agricultural Land(Trial), and those for the heavy metal assessment of crops referred to GB 2762-2017National Food Safety Standard-Maximum Levels of Contaminants in Foodsand NY 861-2004Limits of Eight Elements in Cereals,Legume,Tubes,and Their Products.Since there is no available limit of Ni in cereals in the current food safety standards of China, the recommended limits proposed by the Zhejiang Academy of Medical Sciences (Fu YG et al., 1999)were referenced in this study.The national and Henan provincial background concentrations of elements in soils were all sourced fromBackground Concentrations of Elements in Soils of China(China National Environmental Monitoring Center, 1990).The criteria for specific limits are listed in Table 1.
2.4.1.Single-factor pollution index method(SFPI)
The single-factor index refers to the ratio of the concentration of a pollutant to its critical value in the assessment criteria, and it can be calculated as follows(Equation 1):
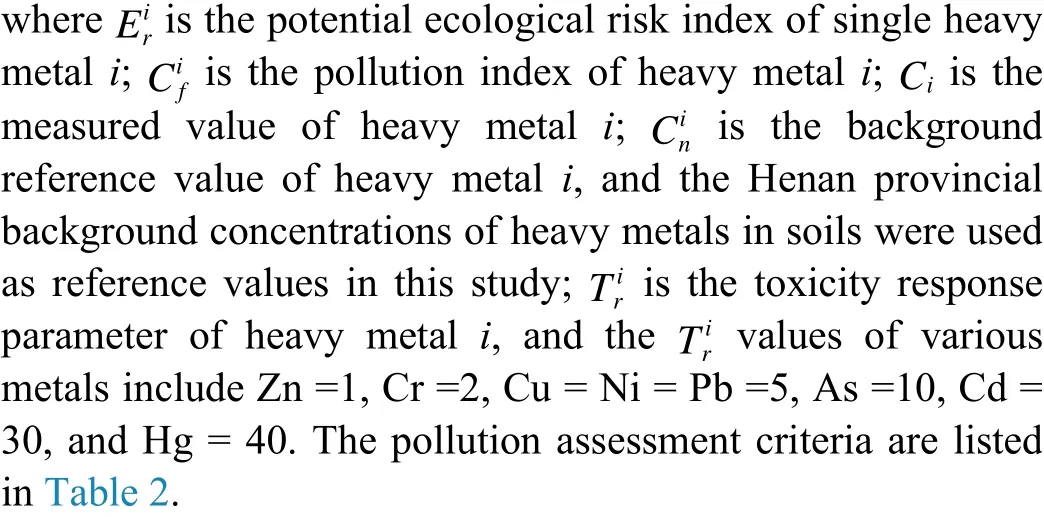
wherePiis the single-factor pollution index of pollutanti,Ciis the measured concentration of pollutanti(mg/kg), andSiis the critical value of pollutantiin the environmental quality assessment criteria (mg/kg).The pollution assessment criteria are described in Table 2.
2.4.2.Nemerow comprehensive pollution index method(NPI)
The NPI (Liu PZ et al., 2018) is a conventional method for assessing soil pollution indices, and it can be calculated as follows (Equation 2):
wherePNis the comprehensive pollution index of pollutants,Pimeanis the average of single-factor pollution indices of pollutanti(mg/kg), andPimaxis the maximum value of singlefactor pollution indices of pollutanti(mg/kg).The Nemerow comprehensive pollution index (PN) is listed in Table 2.
2.4.3.Potential ecological risk index method(PERI)
The potential ecological risk index (Hakanson L, 1980) is a tool used to assess heavy metal pollution in soils according to the properties and characteristics of heavy metals.It can be expressed as follows (Equation 3):
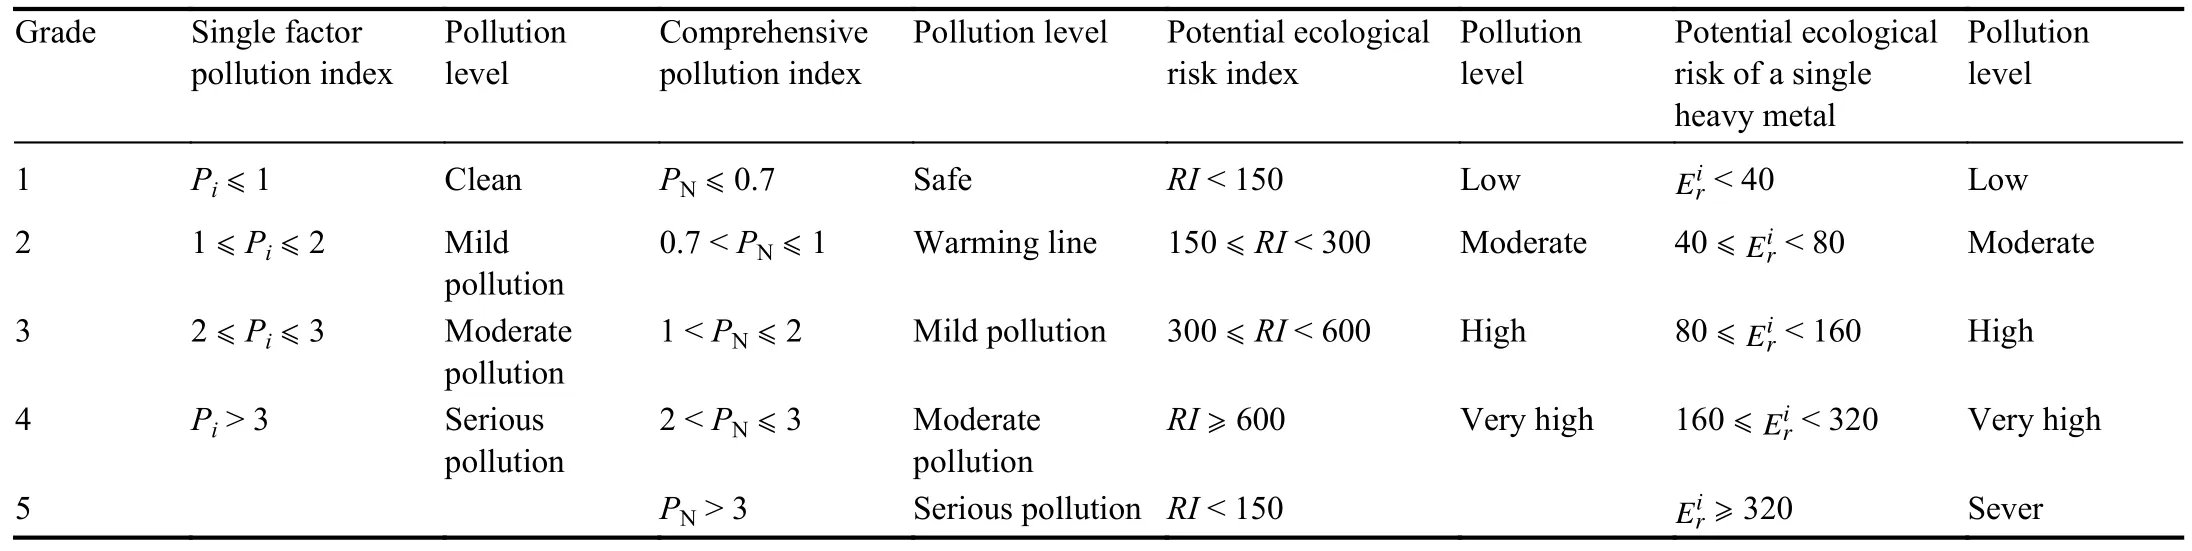
Table 2.Classification criteria of heavy metal pollution in soil.
2.4.4.Health risk assessment of crop intake
This study calculated the health risks caused by the intake of crops in the study area using the Multimedia Contaminant Fate, Transport, and Exposure Model (MMSOILS) developed by the US Environmental Protection Agency (EPA).The equation for calculating the average daily intake of pollutants in cereals is as follows (Equation 4):
whereCDIis the average daily intake of pollutants in cereals,mg/(kg/d);Cis the pollutant concentration in cereals, mg/kg;andIis the daily intake of cereals per capita, mg/kg.Referring to the US EPA’sExposure Factors Handbookand relevant literature, as well as the dietary habits of residents, this study determined that the daily intake of maize and wheat of an adult in the study area was 0.1 kg/d and 0.32 kg/d,respectively and that the daily intake of maize and wheat of a child was 0.05 kg/d and 0.1 kg/d, respectively.In the above equation,EFis the exposure frequency (unit: d/a) andEDis the exposure duration (unit: a);BWis the body weight (unit:kg), andATis the contact time (unit: a).Some specific parameters of the assessment model are listed in Table 3.
The equation for calculating the health risk index of crop intake is as follows (Equation 5):
whereHQis the health risk index.HQ≤ 1 indicates that the pollutants in cereals pose no risk to human health.By contrast,HQ> 1 indicates that the pollutants can cause health risks, and a largerHQis associated with higher health risks caused by pollutants.
The equation for calculating the target hazard quotient(THQ) is as follows (Equation 6):

Table 3.Calculation parameters of the health risk assessment model (MMSOILS).
In this equation,THQ≤ 1 indicates that the pollutants in cereals pose no risk to human health;THQ> 1 denotes that the pollutants in cereals likely pose risks to human health;THQ> 10 suggests that heavy metals have chronic toxicity to humans.
3.Results and discussion
3.1. Heavy metal pollution in soils and ecological risks
3.1.1.Statistics and spatial distribution characteristics of heavy metal pollution in soils
The soils in wheat and maize fields in the study area have average pH of 5.69 and 6.1, respectively, suggesting slight acidity.Table 4 shows the statistics of heavy metal concentrations in the soil samples of the study area.According to this table, the soil samples from the wheat fields had average Pb, Cd, Zn, Cu, Cr, Ni, As, and Hg concentrations of 47.76 mg/kg, 0.33 mg/kg, 91.38 mg/kg,31.84 mg/kg, 86.91 mg/kg, 36.57 mg/kg, 9.72 mg/kg, and 0.11 mg/kg, respectively.This table also shows that the soil samples from the maize fields had average Pb, Cd, Zn, Cu,Cr, Ni, As, and Hg concentrations of 59 mg/kg, 1.47 mg/kg,149.97 mg/kg, 38.81 mg/kg, 124.8 mg/kg, 55.56 mg/kg, 8.94 mg/kg, and 0.05 mg/kg, respectively, which were 1.24, 4.45,1.64, 1.22, 1.44, 1.52, 0.92, and 0.45 times those in the soil of the wheat fields, respectively.As revealed by the comparison between the results in Tables 1 and Table 4, the average concentrations of heavy metals (except for As) in the soil samples from the wheat fields in the study area were all above the Henan provincial and national background concentrations of elements in soils.Specifically, the average Pb, Cd, Zn, Cu,Cr, Ni, As, and Hg concentrations in the soil samples from the wheat fields were 2.14, 4.71, 1.46, 1.59, 1.36, 1.33, 0.85, and 3.23 times the Henan provincial background concentrations of elements in soils, respectively and 1.84, 3.30, 1.23, 1.41, 1.42,1.36, 0.86, and 1.69 times the national background concentrations of elements in soils.The average concentrations of heavy metals (except for As and Hg) in the soil samples from the maize fields were all above the national background concentrations of elements in soils.Specifically,the average concentrations of Pb, Cd, Zn, Cu, Cr, Ni, As, and Hg were 2.65, 21, 2.40, 1.94, 1.96, 2.03, 0.78, and 1.47 times the Henan provincial background concentrations of elements in soils, respectively and 2.27, 14.7, 2.02, 1.72, 2.05, 2.07,0.8, and 0.77 times the national background concentrations of elements in soils, respectively.According to the risk screening values specified in GB 15618-2018Soil Environmental Quality-Risk Control Standard for Soil Contamination of Agricultural Land(Trial), the soil samples from the wheat fields suffered serious Cd pollution, with an over-limit ratio of up to 37.5%.The concentrations of other heavy metals in the soil samples from the wheat fields were all below their limits except for the Pb and Cr concentrations.The soil samples from the maize fields also suffered serious Cd pollution, with an over-limit ratio of 47.8%.Meanwhile,the concentrations of other heavy metals in some soil samples from the maize fields were all above their standards.Overall,the maize fields in the study area suffer more serious soil pollution than the wheat fields, and the elements causing pollution mainly include Cd, Pb, and Ni.
Regarding the coefficient of variation (CV), the soil samples from the wheat fields had CVs of Pb, Cd, and Hg of 0.74, 0.76, and 2.05, respectively, all of which were above 0.5.This result reflects strong spatial variability and the interference of anthropogenic factors, especially for Hg.The CVs of all heavy metals (except for Cu) of soil samples from the maize fields were close to or greater than 1, indicating extremely strong spatial variability and a great impact on human activities.This result is possibly caused by local mining.
Fig.2 shows the spatial distribution of heavy metal concentrations in the root-soil samples from the study area.According to this figure, most of the areas with high heavy metal concentrations are correlated with the locations of ore occurrences, and there is a significant spatial correlation between these concentrations and the distance from the mining area.Owing to the basin terrain, the study area has an average annual prevailing wind direction of NE.The heavy metal concentrations downwind of the mining area were significantly higher than those upwind, demonstrating that the heavy metal distribution in the study area is largely affected by local mining activities.However, the Cr and Ni concentrations (Figs.2e, f) were low around the Magutian iron deposit and the gold deposits in the east, indicating that Cr and Ni are slightly correlated with mining activities and are not the characteristic pollutants of mining activities (Xu YN et al., 2014).By contrast, other heavy metals such as Cd,Pb, Zn, Cu, and As (Figs.2a-d, g) are mainly sourced from large quantities of associated minerals such as galena,sphalerite, and chalcopyrite in hydrothermal deposits and gold-bearing quartz veins (Yang Y, 2008).Heavy metals are all rich in the vicinity of Dahe Town, and the possible reasons are as follows.The study area has a warm and humid continental climate of the northern subtropical monsoon type and has high rainfall.Transported by rainwater, the heavy metals leaching from tailing piles near the local mining areas accumulate in the nearby Erlangshan Reservoir.Then, local farmers divert water from the reservoir for irrigation, thus causing soil pollution and heavy metal anomalies in the study area.
3.1.2.Assessment of heavy metal pollution in soils
The heavy metal pollution in the soils of the study areawas assessed according to the screening values given in GB 15618-2018 (Table 5).As indicated by the assessment results,the single-factor pollution indices of heavy metals in the soil samples from the wheat fields were in the order of Cd > Cu >Ni > Pb > Cr > Zn > As > Hg, and these soil samples did not show significant As and Hg pollution.The single-factor pollution index of Cd in these soil samples was greater than 1,indicating severe Cd pollution.Although these soil samples did not show significant pollution of other heavy metals overall, the concentrations of these heavy metals in some of these samples were much higher than their allowable limits.The single-factor pollution indices of heavy metals in the soil samples from the maize fields were in the order of Cd > Ni >Cu > Pb > Zn > Cr > As > Hg.The high single-factorpollution index of Cd in these soil samples suggests serious pollution, and other heavy metals in these soil samples showed the same pollution characteristics as those in the soil samples from the wheat fields.

Table 4.Concentrations and over-limit ratios of heavy metal elements in soil (N = 39).
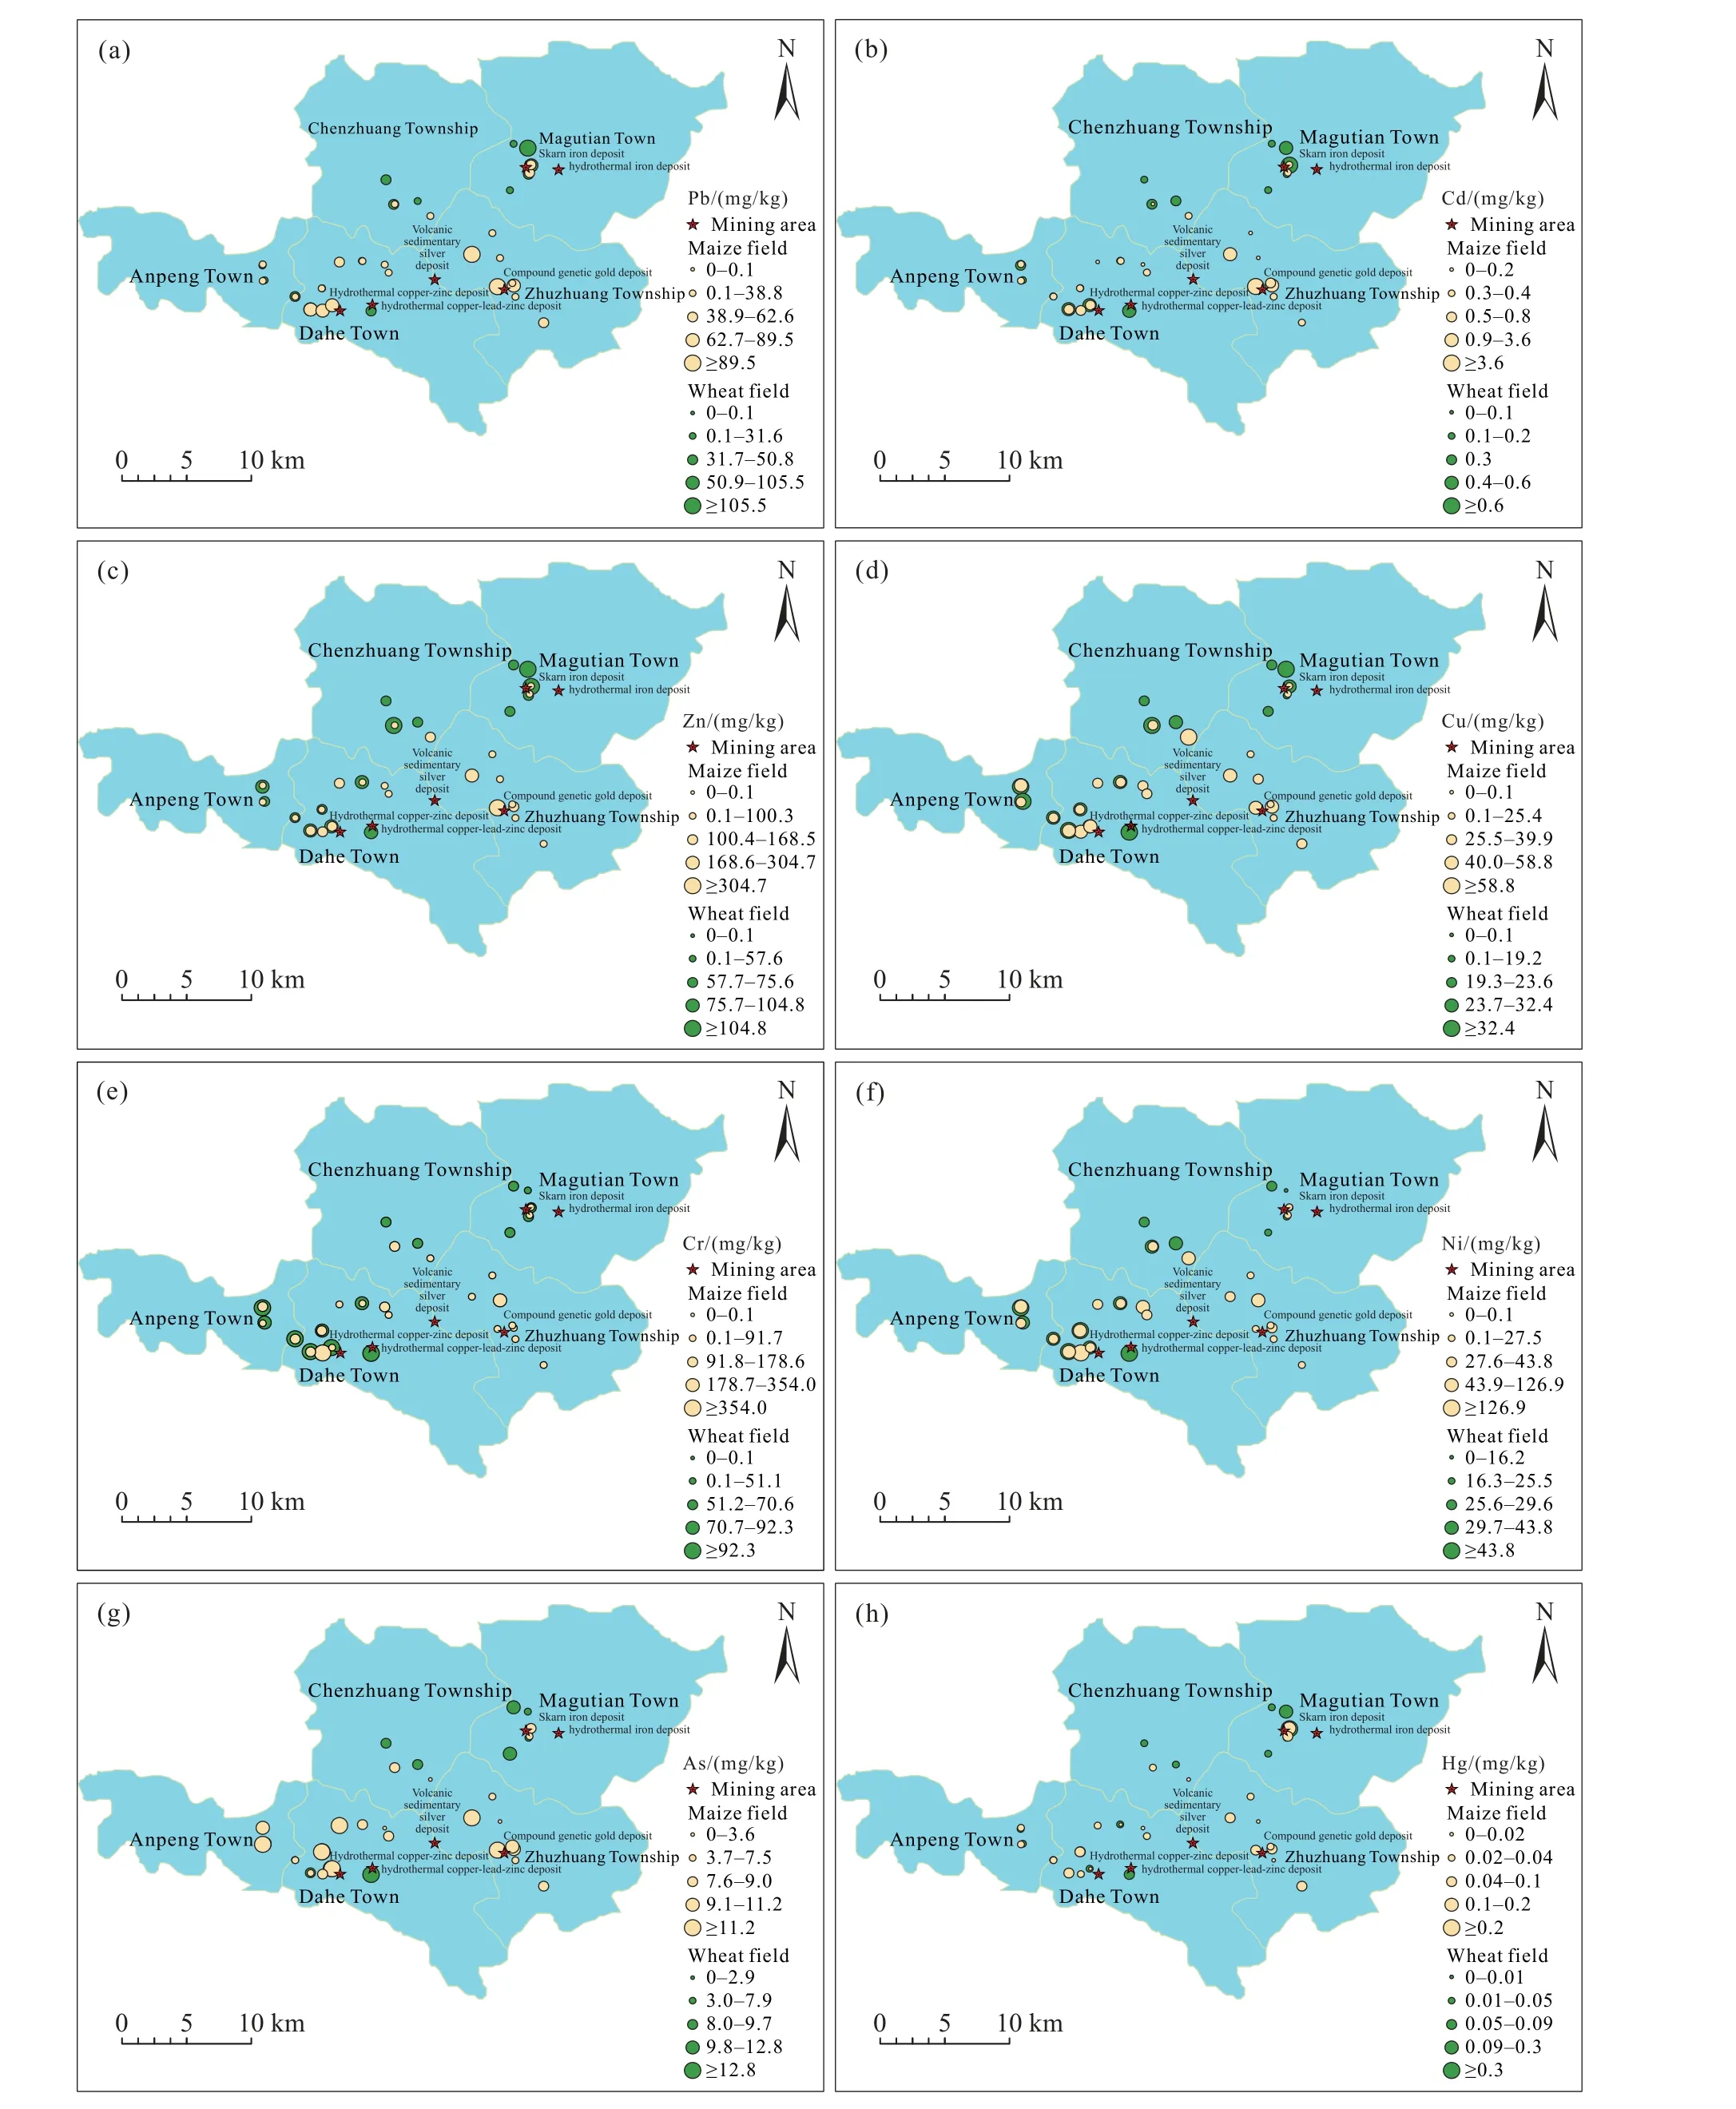
Fig.2.Spatial distribution of heavy metals in soils of different crop fields in the study area.

Table 5.Single factor pollution indices of heavy metals in the soil of the study area.
The Nemerow comprehensive pollution indices of soil samples from wheat and maize fields in the study area were calculated to be 0.49-2.62 and 0.49-51.76, respectively, and Cd contributed the most to thePNof both types of fields.The assessment results are shown in Fig.3.The soil samples from both types of fields in the study area suffered heavy metal pollution to different degrees, and the soil samples from the maize fields were polluted more severely with heavy metals than those of wheat fields.Moreover, 50% and 22% of soil samples from wheat and maize fields in the study area were free from pollution, respectively, and 39% of soil samples from maize fields suffered heavy metal pollution.Therefore,wide attention should be paid to the serious heavy metal pollution in the study area.
3.1.3.Assessment of potential ecological risks of heavy metals in soils

Fig.3.Statistics of the assessment results base on the Nemerow comprehensive pollution index.a-wheat fields; b-maize fields.
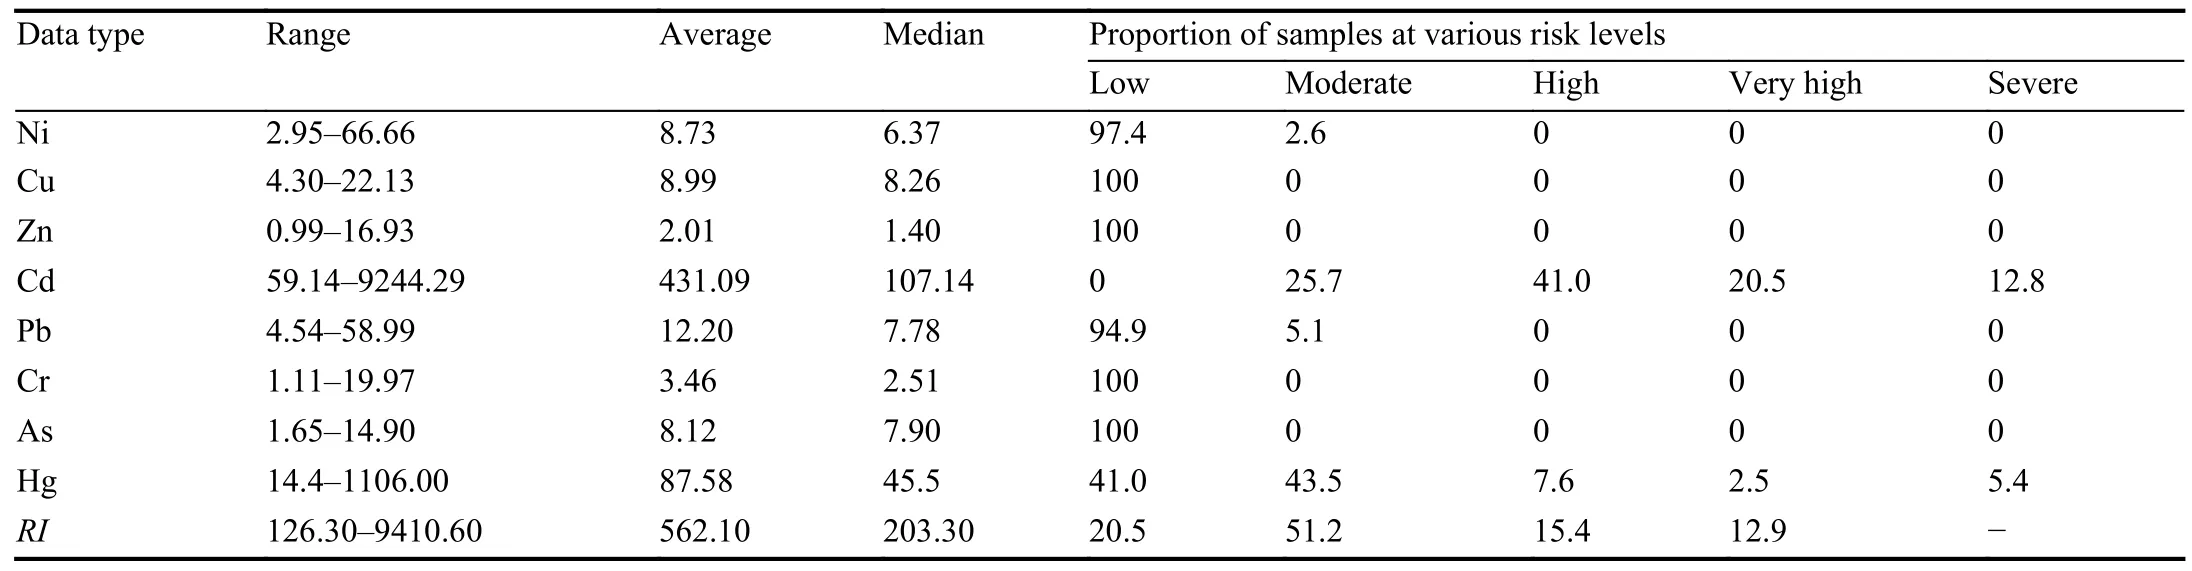
Table 6.Statistics of the potential ecological risk levels of heavy metals in soil samples from the study area.
Table 6 shows the assessment results of potential ecological risks caused by heavy metals in root-soil samples from the wheat and maize fields in the study area.According to this table, Cd, Hg, Ni, and Pb in the soil samples all showed different degrees of hazards, and their average potential ecological risk indices were 431.09, 87.58, 8.73, and 12.20, respectively.Among them, Cd had a high average potential ecological risk index of 59.10-9244.29.The samples with low, moderate, high, very high, and severe potential ecological risks accounted for 0, 25.7%, 41.0%, 20.5%, and 12.8% of the total samples, respectively, with the samples with high risks predominating.The assessment results of the single-factor pollution index of Hg in the soil samples indicate that the Hg concentration did not significantly exceed the standard.However, Hg in the soil samples had high potential ecological risks, with an average potential ecological risk index of 87.58, and mainly posed moderate risks.2.6% and 5.1% of the samples had moderate potential ecological risks of Ni and Pb.The Cu, Zn, Cr, and As in the soil samples had an average potential ecological risk index of 8.99, 2.01, 3.46,and 8.12, respectively.They mainly posed low potential ecological risks, without causing significant pollution.The potential ecological risks of heavy metals in the soil samples were in the order of Cd > Hg > Pb > Cu > Ni > As > Cr > Zn.As shown in Fig.4, among the heavy metal elements in the soil samples, Cd had the highest potential ecological risks and was the main factor causing potential ecological risks,followed by Hg, Pb, and Ni in sequence.
The composite index of potential ecological risks of the soil samples varied greatly, with an average of 562.1.The samples with low, moderate, high, and very high composite potential ecological risks accounted for 0.5%, 51.2%, 15.4%,and 12.9% of the total samples, respectively.Moreover,samples with moderate composite potential ecological risks predominated.Some soil samples had high composite potential ecological risks, and they were mainly collected from Zhuzhuang Town.
3.1.4.PCA of heavy metals in soils
PCA was employed in this study to analyze the sources of heavy metals in soils.The Kaiser-Meyer-Olkin (KMO) test and Bartlett’s test of sphericity were conducted for the raw data on the heavy metal concentrations in the soil samples,yielding a KMO value of 0.555 and a probability associated with Bartlett test statistic of 0.000 (less than 0.05).These results indicate that the raw data are qualified for PCA.
As shown by the PCA results of heavy metals in the rootsoil samples, the top three eigenvalues of the correlation matrix were 2.978, 2.143, and 1.122, and their variance contribution rates were 37.23%, 26.79%, and 14.05%,respectively, with a cumulative contribution rate of 78.04%.Therefore, they can reflect the vast majority of information about the data, as detailed in Table 7.
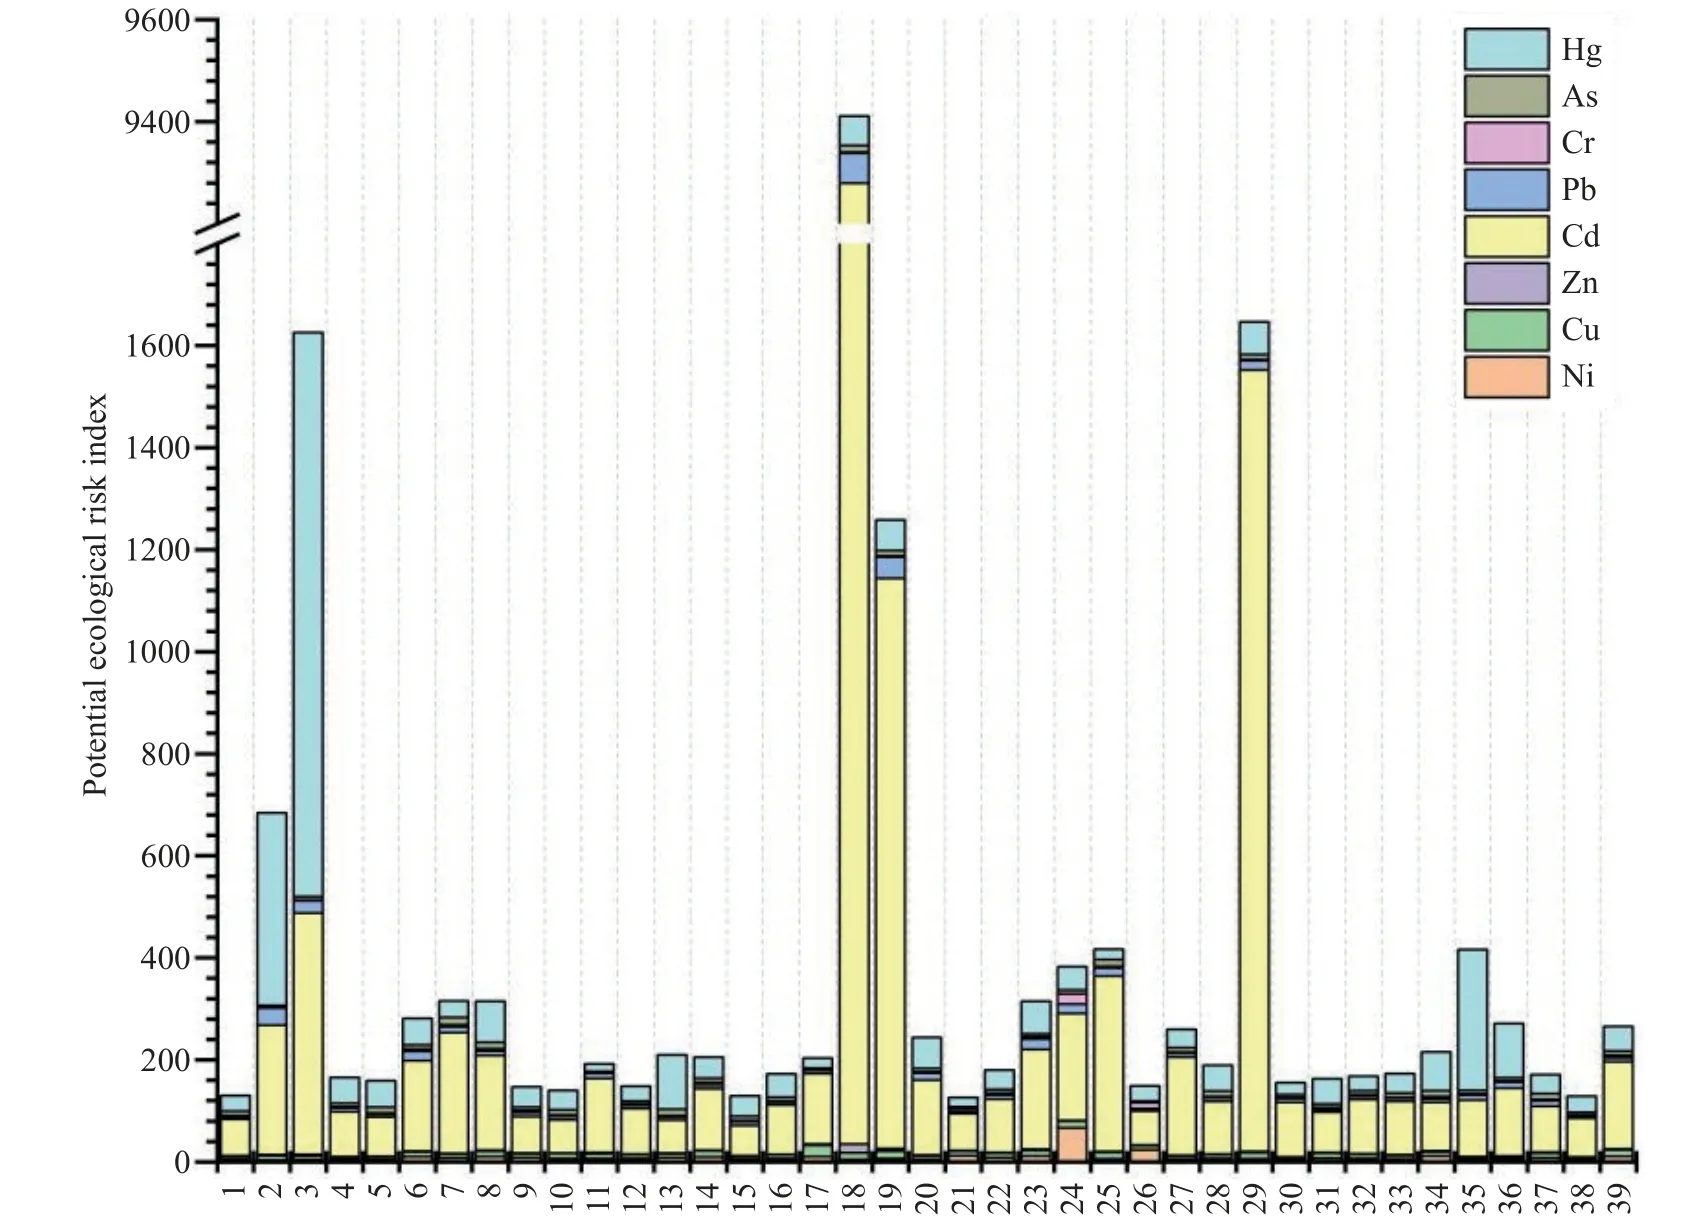
Fig.4.Histogram of superimposed potential ecological risk indices of heavy metals in soil samples of the study area.
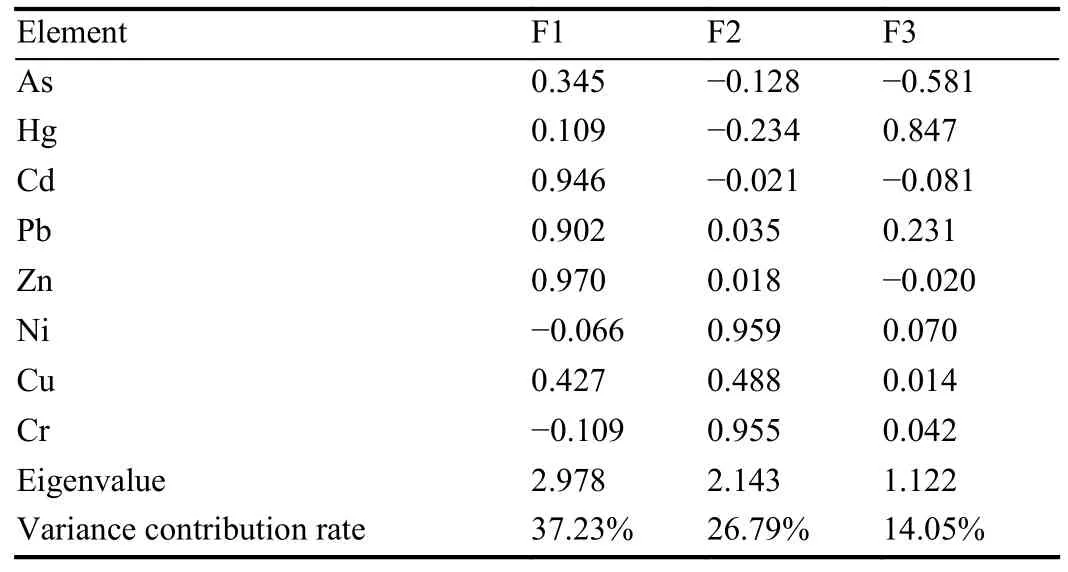
Table 7.PCA matrix of heavy metals in soils.
As shown in Table 7, the first principal component (F1)correlated strongly with As, Zn, Cd, and Pb, indicating that the four heavy metals are closely related to each other and may originate from the same source.By comparison with Fig.2,the areas with high concentrations of the four heavy metals are related to mining areas.Therefore, the As, Zn, Cd, and Pb in the study area may be mainly caused by the mining activities of humans.This conclusion can be confirmed by their high spatial variability.The second principal component(F2) correlated strongly with Ni and Cr, indicating that the two heavy metals may originate from the same source.As revealed by relevant studies, the formation of Cr and Ni is associated with ultramafic rocks, and their concentrations show a rising trend from acidic to intermediate-acid, then intermediate and finally mafic igneous rocks and are the lowest in granitic rocks (Qian B et al., 2017).Fig.1 and Fig.2 show that zones with high Cr and Ni concentrations in the study area are distributed in the Lower Paleozoic Erlangping Group and Lower Proterozoic Qinling Group.The protoliths of these exposed strata comprise intermediate-mafic volcanic rocks and carbonate rocks.The areas with low Cr and Ni concentrations are mainly distributed in the Lower Paleozoic Waitoushan Formation, where the rocks mainly include biotite granulites, sericite schists, and carbonaceous sericitequartz schists and the protoliths consist of intermediate-acid rocks (Luo S, 2018).Therefore, the Cr and Ni in the study area are mainly controlled by the geological background.The third principal component (F3) correlated mainly with Hg.By comparison with Fig.2, Hg does not show a significantly regular spatial distribution and is only somewhat rich in the vicinity of Magutian Town in the north of the study area.The enrichment area of Hg is at the intersection of the Shanghai-Shaanxi and Xuchang-Guangzhou expressways and has developed traffic systems, heavy traffic, and a high flow rate of people.It is can be inferred that the Hg concentration is mainly controlled by human activities.By combining the analysis of F1, F2, and F3, the Cu concentration is likely affected by both natural and anthropogenic factors.This finding is consistent with the results of Wang R et al.(2020).
3.2. Heavy metal pollution in crops and ecological risks
3.2.1.Characteristics and assessment of heavy metal pollution in crops
Table 8 shows the statistics of the heavy metal concentrations in the crop samples.The average concentrations of Pb, Cd, Zn, Cu, and Ni in the wheat samples were 0.02 mg/kg, 0.13 mg/kg, 38.09 mg/ kg, 5.74 mg/kg, and 0.95 mg/kg, respectively, and those in the maize samples were 0.03 mg/kg, 0.03 mg/kg, 22.83 mg/kg, 1.79 mg/kg, and 0.66 mg/kg, respectively.Therefore, the concentrations of heavy metals (except for Pb and Zn) in the wheat samples were higher than those in the maize samples.According to the food hygiene and health standards of China, the Cd and Ni concentrations in the wheat samples had high over-limit ratios of 43.75% and 87.5%, respectively, and the Ni concentration in the maize samples had an over-limit ratio of up to 82.6%,which was close to that of the Ni concentration in the wheat samples.
The CVs of the Pb, Cd and Ni in the wheat and maize samples were all greater than 50%, suggesting strong spatial variability.The CVs of the Zn and Cu in these samples were greater than 15%, indicating moderate spatial variability.The heavy metal concentrations in these samples had significantly different spatial distribution patterns due to the effects of external factors.
For the wheat samples, Zn had the highest enrichment coefficient of up to 41.69%, followed by Cd, which had an enrichment coefficient of 38.83%.For the maize samples, Zn also had the highest enrichment coefficient, followed by Cu.The results show that Zn had much higher biological activity than other elements and that Pb and Cr had the lowest enrichment coefficients, and these results are roughly consistent with the study results of the Xiong’an New Area(Zhou YL et al., 2021).The underground parts of plants are generally enriched in much higher quantities of heavy metals than their aboveground parts, and the amount of heavy metal enrichment in plant parts is in the order of roots > stems and leaves > grains (Zhou Y et al., 2020).Studies have shown that Pb and Cr are more prone to be enriched in the roots than in the grains of plants.In addition, Pb mainly occurs in insoluble forms [e.g., PbSO4, PbCO3, and Pb(OH)2] in soils (Cui LW et al., 2014), greatly reducing the adsorption capacity of crops for Pb and resulting in a lower enrichment coefficient of Pb.The maize samples had a lower enrichment coefficient of Cd than the wheat samples, and the possible reasons are as follows.The stems and leaves of maize plants have a strong capability to preserve heavy metals but a weak capacity totransport them to the grains; moreover, the parts of maize plants except for grains have high biomass and thus greatly dilute the heavy metals in grains (Ni SR et al., 2020).

Table 8.Statistics of heavy metal concentrations in grains of crops in the study area (mg/kg; N = 39).
The assessment results of heavy metal pollution in the grain samples are shown in Table 9.The wheat samples suffered a higher degree of heavy metal pollution than the maize samples overall.According to China's food safety and health standards, the single-factor pollution indices of heavy metals in the wheat samples were in the order of Ni > Cd > Zn >Cu > Pb > Cr.The Ni and Cd in the wheat samples had average single-factor pollution indices greater than 1 (2.38 for Ni), indicating serious pollution.In addition, the Zn concentration in some wheat samples was above the standard.The maize samples showed the same single-factor pollution index characteristics as the wheat samples.Specifically, all heavy metals in the maize samples did not show significant pollution characteristics except for Ni with a single-factor pollution index greater than 1 on average, and Cd, whose concentration in some samples exceeded the standard.
Regarding the assessment based on the Nemerow comprehensive pollution index, the wheat samples collected from the study area hadPNof 0.36-6.01 (average: 1.21), andthe maize samples hadPNof 0.43-6.86 (average: 1.45),indicating that both wheat and maize samples were polluted with multiple heavy metals.Among all heavy metals, Ni contributed the most toPNof both wheat and maize samples,as detailed in Fig.5.Wheat grains suffer a lower degree of pollution than maize grains.Specifically, 44% of wheat samples suffered mild or more serious pollution, while 65%of maize samples suffered mild or more serious pollution.These results were similar to the assessment results of the root-soil samples.

Table 9.Single factor pollution indices of heavy metals in different crop samples from the study area.
3.2.2.Health risk assessment of crop intake
The MMSOILS model was employed to calculate theCDIandHQof heavy metals in crops in the study area, as detailed in Table 10.For both adults and children in the study area, the average daily intake of Pb, Cd, Zn, Cu, Ni, and Cr in maize is less than the reference exposure doses, suggesting that these six heavy metals in maize will do no harm to the health of local residents and that the intake of a single heavy metal will not pose significant health risks.For children, the average daily intake of Cu in wheat is greater than the reference exposure dose, indicating that Cu in wheat in the study area may pose risks to child health.
For the Pb, Cd, Zn, Cu, Ni, and Cr in the crop samples,their risks to human health caused by the intake of wheat grains and maize grains are in the order of Cu > Cd > Zn > Ni >Cr > Pb and Zn > Cu > Ni > Cd > Pb > Cr, respectively.TheHQs of all heavy metals for children are higher than for adults.This result is consistent with the results of previous studies (Zhang H et al., 2020; Huang ZT et al., 2022; Li J et al., 2021), indicating that heavy metals ingested through cereal crops cause more serious health risks to children than to adults and reflecting the sensitivity and vulnerability of children to environmental pollution.In addition, the analysis reveals that the intake of heavy metals in wheat and the resultingHQare higher compared to maize grains.Therefore,it is recommended that economic crops with higher antipollution capability than wheat should be planted in the study area.
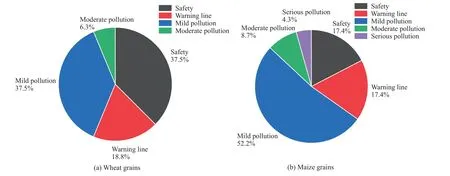
Fig.5.Statistics of the assessment results based on the Nemerow comprehensive pollution index (a-Wheat grains; b-Maize grains).

Table 10.Heavy metal intake through cereals and health risk.
The assessment results ofTHQshow that the intake of wheat in the study area poses risks to the health of both children and adults, withTHQgreater than 1.Since the maize samples hadTHQless than 1, the intake of maize from the study area will not pose risks to the health of both adults and children.
4.Conclusions
By analyzing the content of heavy metals in the soil and crops, discussing the sources of heavy metals, and evaluating the health risks of heavy metal intake through crops, the following conclusions can be reached through analyses.
(i) According to a relevant standard of soil environmental quality, the Cd concentration in both wheat and maize fields in the study area exceeds the standard to varying degrees.Moreover, the Cd, Pb, Zn, and Hg in the study area have high spatial variability due to the enormous impact of human activities.
(ii) The root soils of both wheat and maize fields in the study area show significant characteristics of Cd pollution,and both types of fields suffer heavy metal pollution to different degrees.The heavy metals in the study area mainly pose moderate potential ecological risks.Among them, Cd carries great potential ecological risks, while Cu, Zn, and Cr pose low potential ecological risks.It is noteworthy that Hg poses high potential ecological risks although the Hg concentration does not significantly exceed the standard.
(iii) According to the national food hygiene and health standards of China, the wheat in the study area suffers severe Cd and Ni pollution, while the maize is mainly polluted with Ni.Both wheat and maize in the study area suffer compound heavy metal pollution.The pollution of 44% of wheat samples and 65% of maize samples suggests that the maize suffers more serious compound heavy metal pollution than the wheat in the study area.The intake of maize grown in the study area does not pose significant health risks.However, the Cu in wheat carries higher risks to child health, and the compound heavy metal pollution caused by the intake of wheat in the study area poses health risks to both adults and children.
CRediT authorship contribution statement
Qiu-yao Dong, Hao-tian Wen, and Pan Wang conceived of the presented idea.All authors participated in field work,discussed the results, provided critical feedback, and contributed to the final manuscript.
Declaration of competing interest
The authors declare no conflicts of interest.
Acknowledgment
This study was jointly funded by National Natural Science Foundation of China (41877398) and project of the China Geological Survey (DD20221773).
杂志排行
China Geology的其它文章
- Heavy metal pollution assessment in marine sediments in the Northwest coast of Sabah,Malaysia
- Geology and mineralization of the Bayan Obo supergiant carbonatite-type REE-Nb-Fe deposit in Inner Mongolia, China: A review
- Discovery of bauxite-type helium source rock in Jinzhong basin, central North China and its resource potential evaluation
- Reply: Comment on “Geological mapping and mining prospecting in the Aouli inlier(Eastern Meseta, Morocco) based on remote sensing and geographic information systems (GIS)” by Benaissi et al.(China Geology, 5 (2022))
- Classification and mineralization of global lithium deposits and lithium extraction technologies for exogenetic lithium deposits
- Melt extraction and mineralization: A case study from the Shuangjianzishan supergiant Ag-Pb-Zn deposit (208 Mt), Inner Mongolia, NE China