A three-dimensional Moho depth model beneath the Yemeni highlands and rifted volcanic margins of the Red Sea and Gulf of Aden, Southwest Arabia
2023-12-15AminNomanAlKadasi
Amin Noman Al Kadasi
Department of Geology, Faculty of Applied Science, Taiz University, Taiz 04, Yemen
Keywords:Bouguer gravity anomaly Earth gravitational model (EGM2008)Moho discontinuity Mantle upwelling Lithosphere-asthenosphere interaction Volcanic passive margin Isostasy Gulf of Aden Red Sea Arabian Peninsula
ABSTRACT Knowing Moho discontinuity undulation is fundamental to understanding mechanisms of lithosphereasthenosphere interaction, extensional tectonism and crustal deformation in volcanic passive margins such as the study area, which is located in the southwestern corner of the Arabian Peninsula bounded by the Red Sea and the Gulf of Aden.In this work, a 3D Moho depth model of the study area is constructed for the first time by inverting gravity data from the Earth Gravitational Model (EGM2008) using the Parker-Oldenburg algorithm.This model indicates the shallow zone is situated at depths of 20 km to 24 km beneath coastal plains, whereas the deep zone is located below the plateau at depths of 30 km to 35 km and its deepest part coincides mainly with the Dhamar-Rada’a Quaternary volcanic field.The results also indicate two channels of hot magmatic materials joining both the Sana’a-Amran Quaternary volcanic field and the Late Miocene Jabal An Nar volcanic area with the Dhamar-Rada'a volcanic field.This conclusion is supported by the widespread geothermal activity (of mantle origin) distributed along these channels,isotopic data, and the upper mantle low velocity zones indicated by earlier studies.©2023 China Geology Editorial Office.
1.Introduction
The study area is located in the southwestern part of the Arabian Peninsula, enclosed between 12.5° N to 16.2°N and 43° E to 45° E.It extends northward along the western part of Yemen from the Red Sea and the Gulf of Aden ridges to khamir.The coastal plain of the Red Sea (the Tihama Plain) is up to 40-75 km wide extends parallel to the Red Sea and gently rises in elevation from sea level to about 200 m above sea level “ASL” at the foot of the Great Escarpment (Huchon P et al., 1991; Davison I et al., 1998).The Great Escarpment extends more than 1000 km from Yemen to the east of Makkah in Saudi Arabia and is marked by a sudden increase in altitude from 200 m to 1000 m ASL.On this escarpment(transitional zone between coastal areas and the plateau), the Yemeni highlands form a broad plateau along the eastern margin of the Red Sea with an average altitude of 2200 m ASL and a maximum altitude of 3660 m ASL at Jabal An Nabi Shuayb (J.N.Shuayb), southwest of Sana'a (Davison I et al., 1998).The topograpgy of the area, which is dominated by a thick sequence of Cenozoic volcanic rocks, is attributed to the interaction between mantle dynamics, lithosphere kinematics, magmatism, and surface processes (Davison I et al., 1998).Imaging Moho discontinuity is a key parameter to understanding the lithosphere-asthenosphere interaction,mechanisms of extensional tectonism and crustal deformation in volcanic passive margins (Sembroni A et al., 2016).
Seismic refraction experiments (Egloff F et al., 1991)show Moho depth varies from less than 13 km to 35 km below the Red Sea coast and the plateau, respectively.Receiver function analysis indicates variation in crustal thickness from 35 km below the plateau to 20 km and 22 km below the Red Sea and the Gulf of Aden coastal plains,respectively, (Ahmed A et al., 2013).A gravity survey along a profile extended between Ethiopian and Yemeni highlands revealed Moho depths ranging between 35 km below Sana’a and 22 km below the Tihama plain (Makris J et al., 1991).These studies sampled Moho depth beneath isolated regions,but it is still indistinct under the largest part of the study area.On the other side, global and continental/sub-continental three-dimensional crustal thickness models (e.g.Bassin CG et al., 2000; Chang SJ and Lee SV, 2011; Laske G et al., 2013;Mechie J et al., 2013; Stolk W et al., 2013; Gvirtzman Z et al.,2016) generally image major changes in Moho topography but don’t clearly reflect small scale variations, especially in geologically complex regions, such as the study area.However, the main objective of this work is to construct a continuous, three-dimensional model of Moho discontinuity undulation beneath the study area by inverting gravity data from the EGM2008.This model can be helpful in better understanding the kinematics of the lithosphere, mechanisms of crustal deformation and magmatic activity in the study area.
2.Geologic and tectonic setting
The southwestern part of the Arabian shield comprises gneisses and schists terrains intruded by granites of Pan-African age, 500 Ma to 800 Ma, (McCombe DA et al., 1994;Stewart SA, 2016).The Late Pan-African tectonic event (Najd fault system), dominated by large shear zones and NWtrending strike-slip faults (Levin G and Park J, 2000; Nehlig P et al., 2002; Stewart SA, 2016; Stern RJ and Johnson PR,2019), heavily affected the shield and controlled the next geological architecture and tectonic regime in this region(Nehlig P et al., 2002; Al Kadasi AN, 2021).The crystalline basements exposed in the eastern, southern, and western parts of the area (Fig.1).
The sedimentary rocks unconformably overlaying the basement and are dominated by Permian sandstones (Wajid Formation) in the northern part, Jurassic limestones (Amran Group) exposed mainly in the northern part, in addition to small exposures along the eastern and western boundaries of the plateau.The Cretaceous sandstones (TawilahGroup) are occurred in the form of isolated elongated exposures at the eastern and northern boundaries of the Cenozoic volcanics and along the uplifted rift shoulders formed by the Cenozoic extensional tectonism.The Quaternary deposits are mainly accumulated along the coastal plains of the Red Sea (Tihama basin) and the Gulf of Aden (Aden-Lahj basin).
A huge amount of magmatic materials erupted in three distinct phases during the Cenozoic in Yemen (Manetti P et al., 1991), concentrated in the western part, in response to the impingement of the Afar plume below the Afro-Arabia lithosphere and the subsequent processes that are eventually leading to the opening of the Red Sea and the Gulf of Aden(Capaldi G et al., 1987; Chiesa S et al., 1983, 1989; Chazot G et al., 1998; Ali MY and Watts AB, 2013; Stern RJ and Johnson PR, 2019; Sanfilippo A et al., 2021).A thick pile(about 2.5 km) of flood basalt and bimodal (basalt-rhyolite/ignimbrite) volcanic rocks erupted along N-S trending fissures throughout the whole plateau during the first phase (pre-rift,30.9 Ma to 26.5 Ma) of magmatic activity (Civetta L et al.,1978; Chiesa S et al., 1989; Baker J et al., 1996; Chazot G et al., 1998).The second phase (syn-rift) is associated with the separation of Arabia from Africa (27.5 Ma to 16.1 Ma,Davison I et al., 1998; Stern RJ and Johnson PR, 2019).It is characterized by synchronous uplift, erosion, widespread crustal extension and intrusive magmatism (Menzies MA et al., 1992, 1997; Davison I et al., 1994; Zumbo V et al., 1995;Baker J et al., 1996; Stern RJ and Johnson PR, 2019).The intrusive rocks (mostly alkali-granites, syenite, and less frequently diorite and gabbro) are concentrated mainly in the transitional zone between the plateau and the coastal plain in the form of dike swarms, plugs, domes, etc (Huchon P et al.,1991; Davison I et al., 1994).A higher amount of magma driven by shallow mantle processes in the asthenosphere(Baker J et al., 1996; Furman T et al., 2016; Stern RJ and Johnson PR, 2019; Sanfilippo A et al., 2021) is added to the lithosphere during the syn-rift period, at least 3 to 10 times the volume of erupted rhyolitic volcanic rocks and intrusive bodies (Davison I et al., 1998).The main part of the Yemen Trap Series (YTS) is formed during the first and second phases of magmatic activity.The third phase of magmatic avtivity (Post-rift < 6 Ma) is restricted along the margin of the Red Sea (Jabal An Nar volcanic area, near Al Mokha), Gulf of Aden (Aden volcanic line, extends from Aden to Perim Island), and on the Yemeni highlands (Sana ’a-Amran,Dhamar-Rada’a and Marib-Sirwah fields) where the latest eruption occurred in 1937 in Dhamar-Rada’a field, (Manetti P et al., 1991; Chazot G et al., 1998).This phase was also driven by shallow mantle processes in the asthenosphere(Chazot G et al., 1998) and characterized by strato-type volcanoes, cones, domes, sheets, and lava flows.
Many earthquakes were recorded in the study area in historical times, including those occurred in Dhamar (Ms=5.7)in 1982 and in Al Uddyn, around Al Qafr (Ms=4.4) in 1991(Ambraseys NN and Melville CP, 1983; Ambraseys NN et al.,1994; Alsinawi SA and Al Aydrus AA, 1999; Lemenkova P,2021).Also, several geothermal manifestations (fumaroles,boiling pools, hot springs, and hydrothermal alteration) are distributed throughout the area (Minissale A et al., 2007).Both seismic and magmatic activities indicate an unstable dynamic situation in the area.
3.Data and methods
3.1. Gravity data
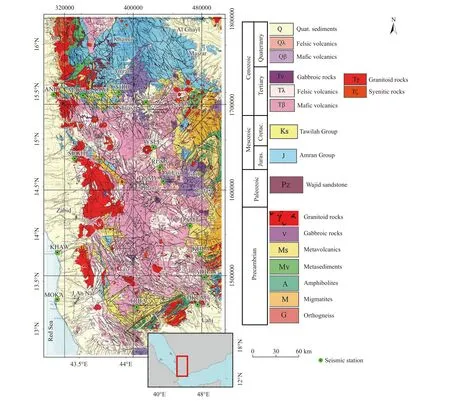
Fig.1.Shows the main geologic features of the study area and its location between the ridges of the Red Sea and the Gulf of Aden (modified from Robertson PLC, 1990).
Simple Bouguer gravity anomaly data, 5' × 5' grid, of the study area were obtained from the EGM2008, developed by the US National Geospatial-Intelligence Agency (available at http://icgem.gfz-potsdam.de/calcgrid).This Model is a highresolution global gravity model combines satellite, airborne and terrestrial gravity data (Pavlis et al., 2008).It overcomes the absence/scarcity of gravity data and provide the opportunity for a large scale regional and sub-regional studies of the earth geodynamics, isostacy, and kinematic of the lithosphere (e.g., Arabelos DN and Tscherning CC, 2010;Steffen R et al., 2011; Tenzer R et al., 2012; Evariste NH et al., 2014; Pal SK et al., 2015; Meliani O et al., 2016; Guy A et al., 2017).To produce the complete Bouguer gravity anomaly of the area (Fig.2a), the effect of nearby topography is removed from the data by using the 5' × 5' grid global relief model ETOPO1 (Fig.3; Amante C and Eakins BW, 2009)and an average topographic density (ρc) of 2670 kg/m3.A constant density is used for the sedimentary cover and the underlain igneous/metamorphic rocks to remove the effect of the Bouguer plate.Thus, the effect of the sedimentary cover(whose density is lower than that of hard rocks and induces negative Bouguer gravity anomalies) on the complete Bouguer gravity anomaly needs to be corrected.The sedimentary cover in the study area is mainly exposed in the Red Sea and Gulf of Aden coastal plains and in the northern part of the area, the Sana'a Basin (Fig.1) and its thickness varies between 1 km and 4 km (Davison I et al., 1994, 1998;Egloff F et al., 1991; Ahmed A et al., 2013).Due to the absence of information related to the lateral variation in the sedimentary cover thickness, the gravity anomaly of these rocks is calculated using an average thickness of 2.0 km and a density of 2.43 g/cm3and subtracted from the complete Bouguer gravity anomaly (Fig.2a) in order to obtain the sediment corrected complete Bouguer anomaly (SCCBA) of the study area shown in Fig.2b.
3.2. Inversion of gravity data
The gravity anomaly caused by topographic variations “h(x, y)” on a constant density contrast two-dimensional surface is calculated by equation (1) according to Parker RL (1972)
Where F[Δg(x, y)] is the Fourier transform of the gravity anomaly, G is the gravitational constant, Δρ is the density contrast across the interface, k is the wavenumber, and Zois the mean depth of the interface from which the topographic variations are calculated.
The Parker-Oldenburg algorithm (Oldenburg DW, 1974)is used to compute the depth of the density discontinuity surface from gravity anomalies as follows:
This algorithm allows the determination of Moho discontinuity undulation by means of an iterative inversion scheme until a reasonable solution is reached.This procedure requires the mean Moho depth (Zo) and the density contrast across the Moho discontinuity (Δρ) to be predefined.
The Matlab code, “3DINVER.M” produced byGomez-Ortiz D and Agarwal PN (2005), according to the Parker-Oldenburg algorithm, is used in this study to calculate the Moho discontinuity depth.Gravity data are extended prior to the inversion to avoid aliasing and suppress ringing effects associated with the applications of the Fourier transform.FollowingGomez-Ortiz D and Agarwal PN (2005), iteration stops after ten iterations or when the convergence criterion is satisfied (i.e., the “RMS” between Moho depths from the new and the previous iterations is equal to or less than 0.02 km).
Precise modelling of Moho interface undulation requires that the inverted gravity anomaly data be carefully filtered using critically selected cutoff wavelengths in order to remove both deep mantel and shallow crustal signals.Inversion results accuracy also depends on the used values of Δρ and Zo.Thus,to attain a more accurate image of Moho discontinuity, the Moho depth model of the study area was constructed in two steps.
3.2.1.Initial Moho depth models
Seventy-two initial models of Moho discontinuity depth are constructed during the first step of modelling by inverting the six sets of SCCBA data (i.e., the output of the six low pass filters applied to the SCCBA, Section 3.2.1.3) using different values of Δρ, Zoin order to select the most appropriate values of these parameters to create the final Moho depth model of the area.The tested range of Δρ and Zowas chosen based on earlier studies, as described in the next paragraphs.

Fig.3.Elevation model extracted from the global relief model Etopo1 (Modified from Amante C and Eakins BW, 2009).
3.2.1.1.Mean Moho depth(Zo)
Earlier studies show variation in Moho discontinuity depth from less than 13-23 km below the Red Sea and the Gulf of Aden coasts to 35 km below the plateau (Egloff F et al., 1991; Makris J et al., 1991; Ahmed A et al., 2013).On the other side, the average depth of the Moho discontinuity estimated byAhmed A et al.(2013) below 17 seismic stations distributed through the study area (Table 1, Figs.1-4) is 28.2 km below sea level.Based on these studies, the tested Zovalues in the first step of inversion are 23 km, 25 km, and 28 km.
3.2.1.2.Density contrast(Δρ)
The average density of the crust (ρc) and mantle (ρm) in the study area is indirectly estimated from elastic wave velocity using the next empirical relation (Brocher TM,2005);
Where Vpis the velocity of compression (P) wave and ρ is the rock density.
Based on the average value of Vpin the upper mantle(7.95 km/s) and in the different crustal zones, except the sedimentary cover, (5 km/s, 6.2 km/s, 6.8 km/s, and 7 km/s)estimated from refraction experiments (see figure 8 of Egloff F et al., 1991), the crust-mantle density contrast (Δρ) in the area is 0.48 g/cm3.
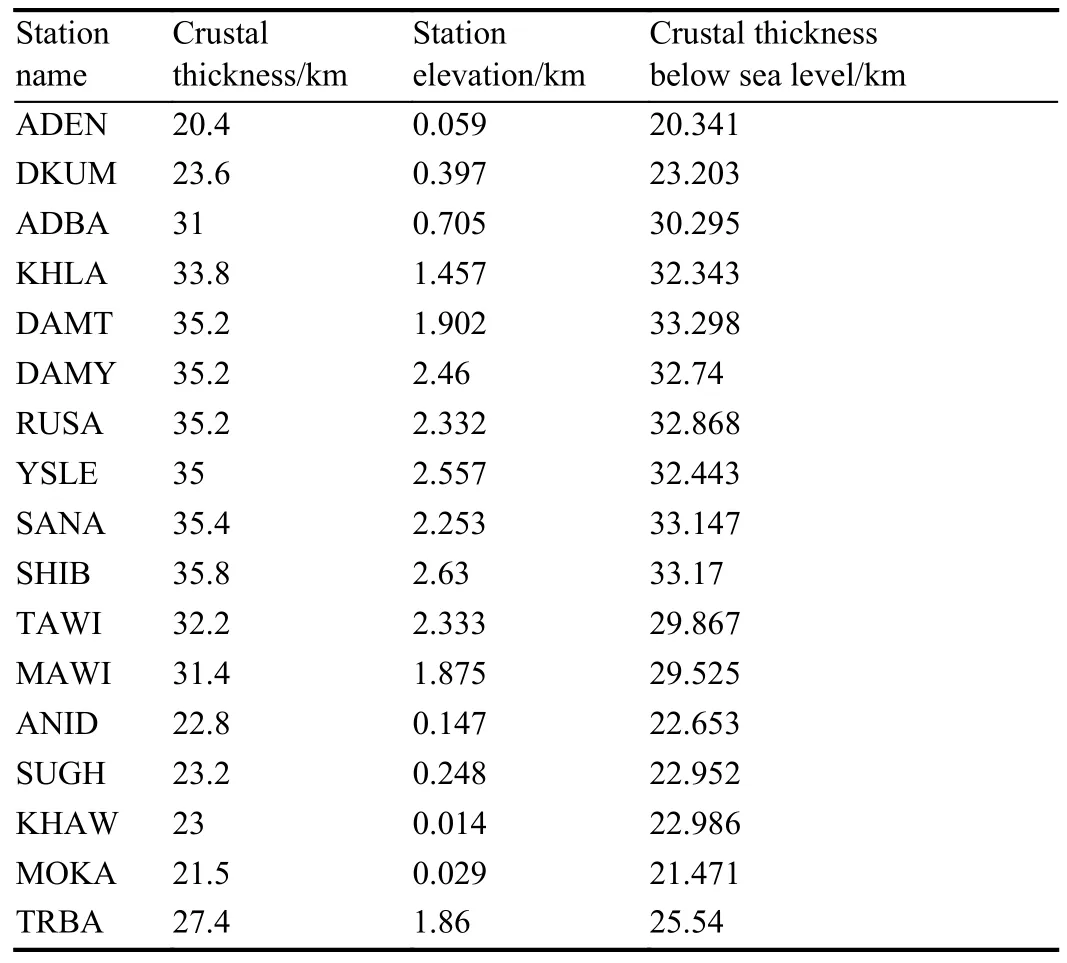
Table 1.Crustal thickness in the study area obtained by receiver function analysis (Modified from Ahmed A et al., 2013).
On the other side, the Moho depth model derived from gravity data in this work is constrained by the receiver function crustal thickness estimated below seventeen seismic stations distributed throughout the study area (Figs.1-4)assuming an average crustal velocity (Vp) of 6.2 km/s (Ahmed A et al., 2013).This value and the above mentioned upper mantle Vpgive Δρ of 0.50 g/cm3.
Both values of Δρ from equation (3), 0.48 g/cm3& 0.50 g/cm3, seem to be high in view of the intensive magmatic activity that affected the study area in the form of intrusion and/or underplatting (e.g., Ahmed A et al., 2013; Al Kadasi AN et al., 2020; Al Kadasi AN, 2021) which is expected to reduce the density contrast across the Moho boundary.Thus,the tested Δρ values in the initial step of modeling Moho undulations are 0.35 g/cm3, 0.40 g/cm3, 0.45 g/cm3and 0.48 g/cm3.
3.2.1.3.Cutoff wavelength
Precise modeling of Moho undulations requires that the inverted gravity anomaly be only related to the Moho discontinuity.Several filters with different cutoff wavelengths were used in previous studies to prepare gravity data for inversion in order to obtain more stable models of Moho undulation (Tirel C et al., 2004; Gomez-Ortiz D and Agarwal BN, 2005; Shin YH et al., 2007).
In this work, due to the relatively small size of the study area, it is assumed that the SCCBA is free from deep mantle signals.On the other side, to ensure removing high frequency signals from the inverted gravity data, a Butterworth low-pass filter with six cutoff wavelengths (60 km, 90 km, 120 km, 150km, 180 km, and 210 km) is applied to the SCCBA.The output of these cutoff wavelengths is inverted using the above mentioned Zoand Δρ values in order to create initial Moho depth models.
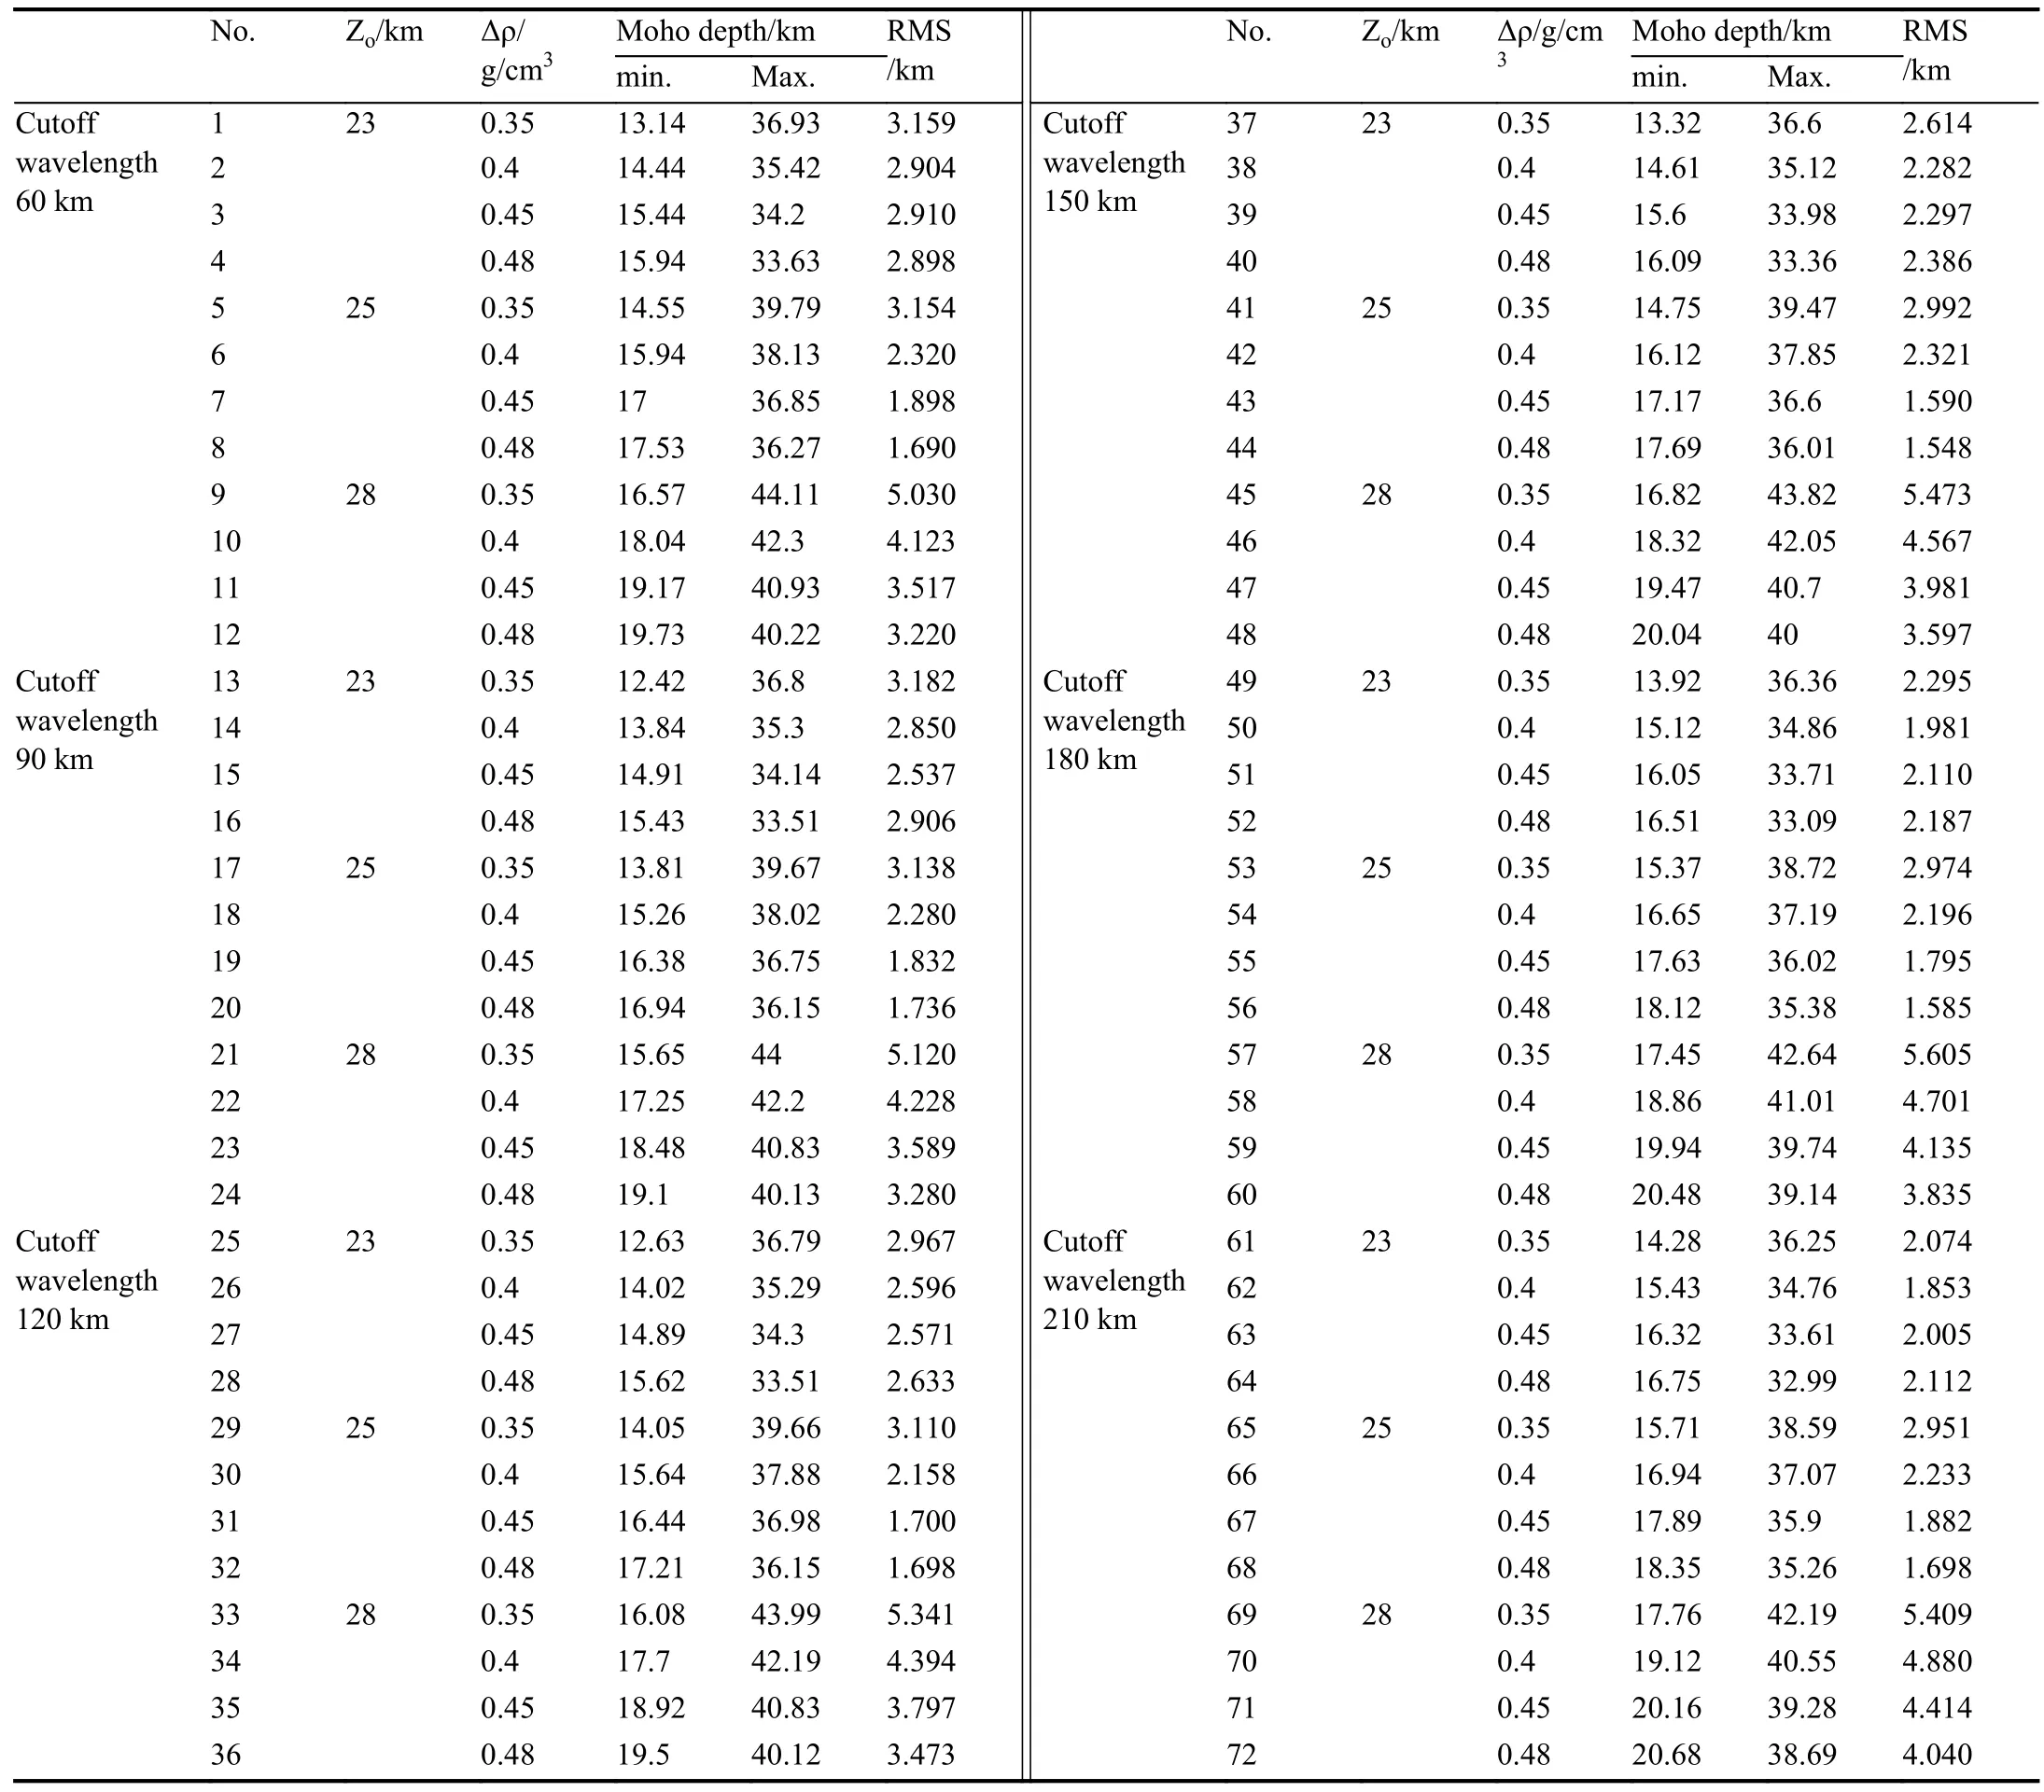
Table 2.Initial Moho depth models obtained by inverting the filtered SCCBA data using six cutoff wavelengths and the RMS between the gravity and seismically derived Moho depths below 17 seismic stations distributed throughout the study area.
The seventy-two initial Moho depth models obtained from the first step of inversion are compared with the seismically derived Moho depths under 17 seismic stations (Table 1, Figs.1-4) and the root mean square error (RMS) between the two sets of Moho depths is calculated for each model.The parameters of the initial Moho depth models along with the calculated RMS are listed in (Table 2).This table indicates that model No.44 (obtained by inverting the 150 km cutoff wavelength SCCBA using Zo=25 km and Δρ=0.48 g/cm3) gives the lowest RMS (1.55).Moho depth models obtained from the other five sets of SCCBA using Zo=25 km and Δρ=0.48 g/cm3also show a small RMS compared with the other models from the same SCCBA data set.This suggests that the optimum Zovalue is 25 km and the tested Δρ values in the second step of Moho depth modeling must be larger than 0.48 g/cm3.
3.2.2.Final Moho Depth model of the study area
Based on initial Moho depth models, the 150 km cutoff wavelength SCCBA data inverted to obtain the final Moho depth model of the study area using Zo=25 km and Δρ of 0.50 g/cm3, 0.51 g/cm3, 0.52 g/cm3, 0.53 g/cm3and 0.54 g/cm3.In order to further check the validity of using Zo=25 km in calculating the final Moho depth model, Moho depths are also calculated using Zo=24 km and 26 km.
The fifteen Moho depth models obtained in this step are also compared with the seismically derived Moho depths below 17 seismic stations in the study area and the root mean square error RMS between the two sets of Moho depths is calculated (Table 3).
3.3. Isostasy
To understand the relationship between Moho discontinuity undulation, ground surface topography, Bouguer gravity anomalies and isostasy, the isostatic gravity of the study area is calculated, following the Airy model, from the filtered topography of the area (i.e., the 150 km cutoff wavelength topographic data) using Zo=25 km, ρc=2.67 g/cm3and Δρ=0.5 g/cm3, the same values used in calculating the final Moho depth model of the area.Isostatic anomalies/isostatic residuals of the study area are then obtained by subtracting isostatic gravity from Bouguer gravity.
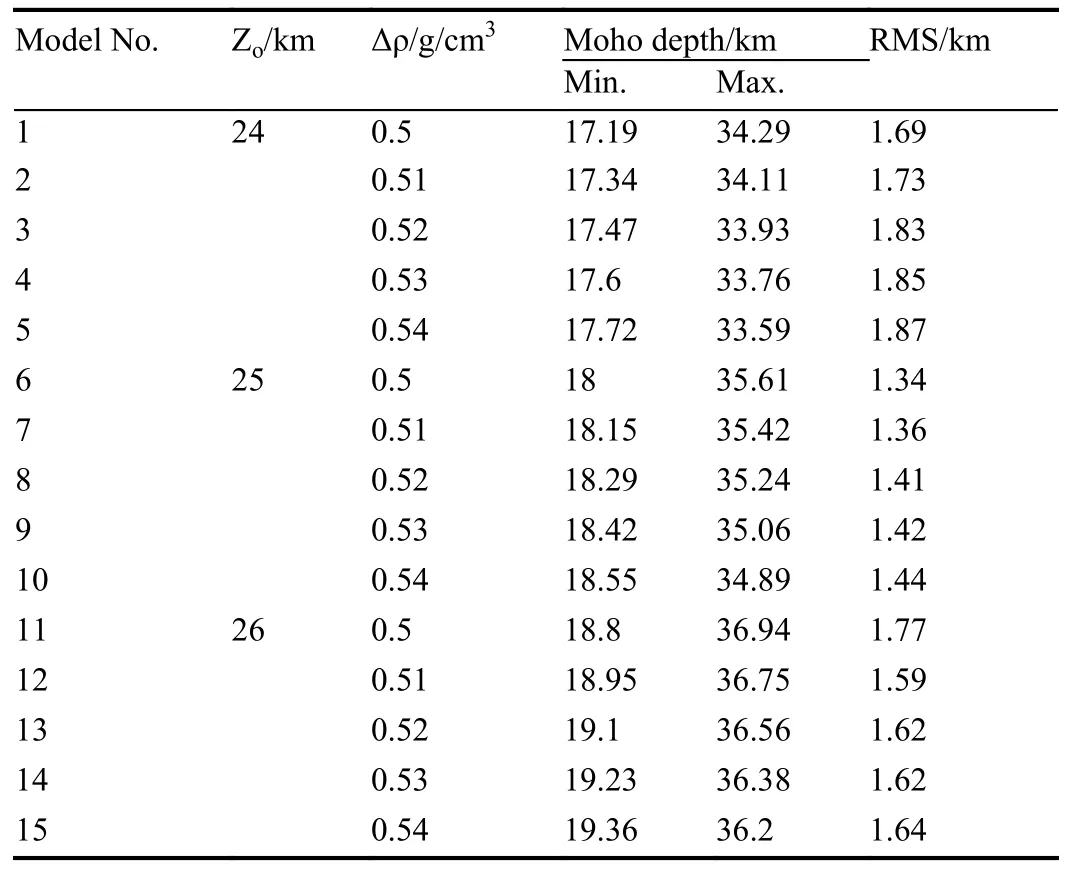
Table 3.Moho depth models obtained by inverting of 150 km cutoff wavelength SCCBA data and the RMS between the gravity and seismically derived Moho depths below 17 seismic stations distributed throughout the study area.
4.Results and discussion
4.1. Sediment corrected complete Bouguer anomaly (SCCBA)map
The general features of gravity anomalies shown in Fig.2b are briefly described in this section.The gravity anomaly is gradually decreasing from about 20 mGal over coastal regions to -210 mGal over the plateau, indicating gradual crustal thickening from the Red Sea and the Gulf of Aden ridges toward the plateau.The transition from coastal regions to the plateau shows a steep gradient in the gravity field (more clearly seen along the Red Sea coastal plain), marking the sudden increase in the Great Escarpment elevation from about 200 m to 1000 m.
A general anticorrelation is clearly observed between the SCCBA (Figs.2a-b) and ground surface topography (Fig.3),but a closer inspection indicates that topographic feature peaks are slightly shifted away from gravity anomaly minima.This suggests another factor also contributed to the observed gravity anomalies, along with crustal thickening.
The minimal gravity anomaly belt running between Sana'a-Amran and Dhamar-Rada'a Quaternary volcanic fields(Figs.1, 2, 4) coincides well with the upper mantle low velocity anomaly zone attributed to hot mantle upwellings(Korostelev F et al., 2014).As the cutoff wavelength of the low pass filter applied to the SCCBA increases from 60 km to 210 km (section 3.2.1), the negative anomaly peak beneath the Sana'a-Amran region gradually diminishes (Figs.4a-c),indicating a relatively small size of this hot mantle upwelling.Furthermore, the minimal gravity anomaly belt becomes more localized between Sana'a and Damt with its peak situated below/around the Al Lisi and Isbil active volcanoes in the Dhamar-Rada’a Quaternary volcanic field (Figs.4a-c).
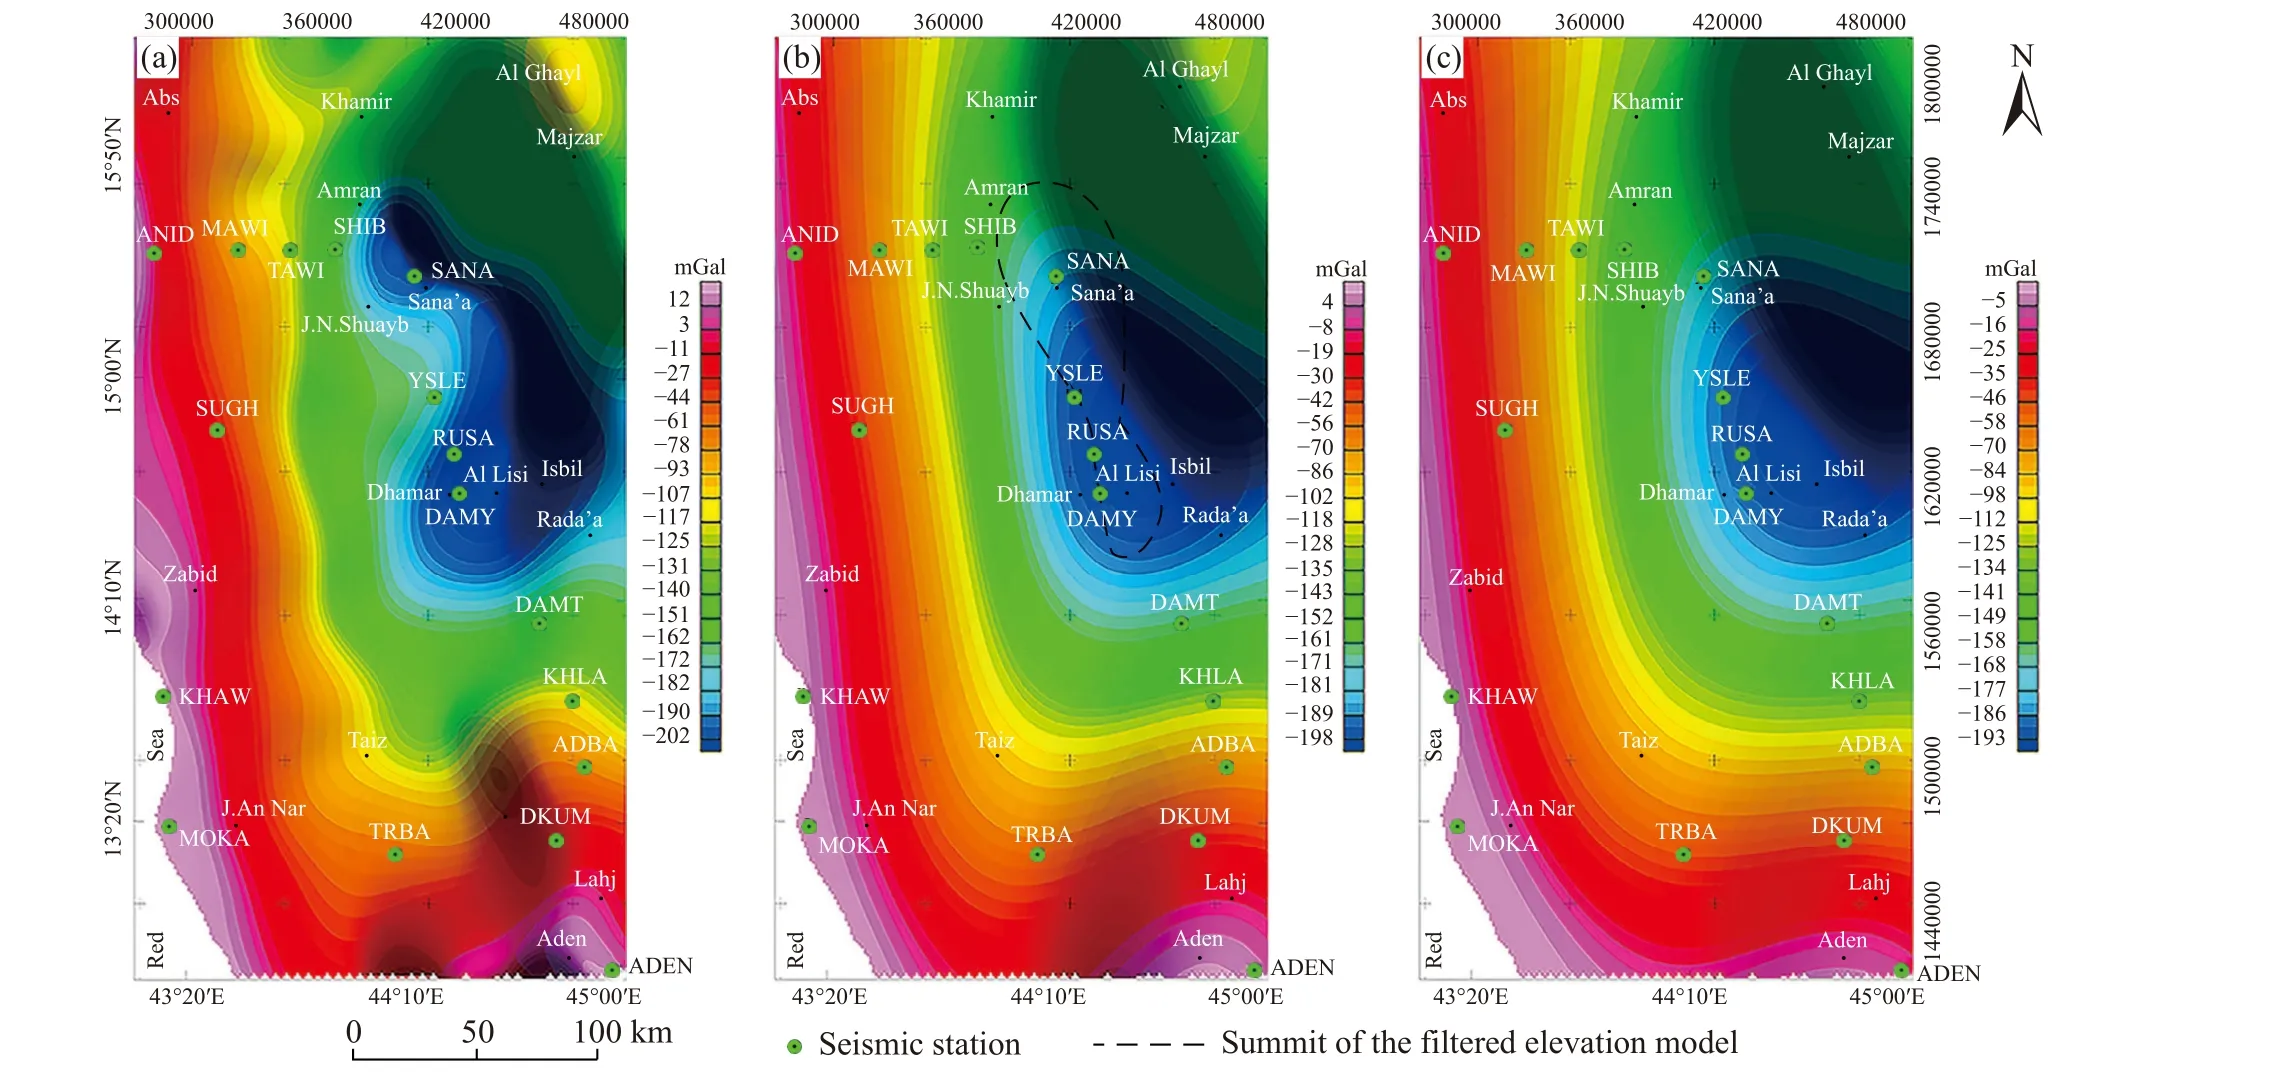
Fig.4.Sediment corrected complete Bouguer anomaly (SCCBA) with cutoff wavelengths of 60 km (a), 150 km (b), and 210 km (c).
The reactivation of deep crustal faults attributed to the final stage of the Pan African Orogeny during the Cenozoic assists upper mantle decompression melting and provides magma for Cenozoic volcanic activity (Al Kadasi AN,2021;Sanfilippo A et al., 2021).This indicates that, in addition to crustal thickening, hot magmatic materials also contributed to the gravity anomaly belt below the highlands(Figs.2, 4) which explains the mismatch between the gravity anomaly minima and topographic feature peaks (Fig.2).Several studies delineated mantle anomaly zones under the study area (e.g., Chang SJ and Lee SV, 2011; Chang SJ et al.,2011; Corbeau J et al., 2014).Similarly, Daradich A et al.(2003) indicated an elongated upper mantle low velocity zone beneath the Arabian shield.Park Y et al.(2007) delineated a NW-SE trending mantle anomaly zone below the Arabian shield associated with the Cenozoic uplift and volcanic centres on the shield.Lim JA et al.(2020) found an elongated,narrow, low-velocity anomaly below the Arabian shield that was connected to the asthenospheric flow from the Afar plume.Mukhopadhyay M et al.(2021) imaged a 10 to 12 km thick and 40 km wide uplifted upper mantle zone beneath the Tihamat plain, SW- Saudi Arabia, at depths varying between 37 km and 45 km.
4.2. Moho depth model of the study area
Table 3 shows 15 Moho depth models obtained by inverting the 150 km cutoff wavelength SCCBA (section
3.2.2.).Among these models, model No.6 (with Zo=25 km and Δρ=0.50 g/cm3) gives the lowest RMS (1.34) between the seismically derived and the gravity-derived Moho depths under 17 seismic stations in the study area.Thus, this model(model No.6,Fig.5) reflects the most accurate image of Moho discontinuity undulation in the study area.Moreover,the difference in the RMS values of the different models listed inTable 3 is quite small, which confirms the stability of the estimated Moho depths.
Three zones of Moho depth can be easily recognized on the 3D Moho depth model of the study area (Fig.5).The shallow zone is located at depths varying between 20 km and 24 km below the Red Sea and the Gulf of Aden coastal plains,and the intermediate zone lies at depths of 24 km to 30 km beneath the transitional region between the coastal plains and the plateau.The deep zone is located beneath the plateau at depths vary between 30 km to 35 km and its deepest part is largely coincident with the Dhamar-Rada Quaternary volcanic field.
Moho depths from this study agreed well with Makris J et al.(1991) who recorded an average crustal thickness of 35 km below the Sana’a region and 22 km below the Tihama plain.The obtained Moho depths also agreed well with crustal thickness from the receiver function, which varies from 20 km to 23 km under coastal regions to 35 km below the plateau(Ahmed A et al., 2013).Furthermore, Moho depths from the present work also lying within the range of the estimated Moho depths below the Arabian plate by earlier regional and semi-regional studies such asGettings ME et al.(1986) 20 km to 40 km, Chang SJ and Lee SV (2011) 25 km to 35 km,Mechie J et al.(2013) 30 km to 45 km, Gvirtzman Z et al.(2016) 20 km to 45 km, and byAl Amri A et al.(2017) 20 km to 25 km near the Red Sea coasts.
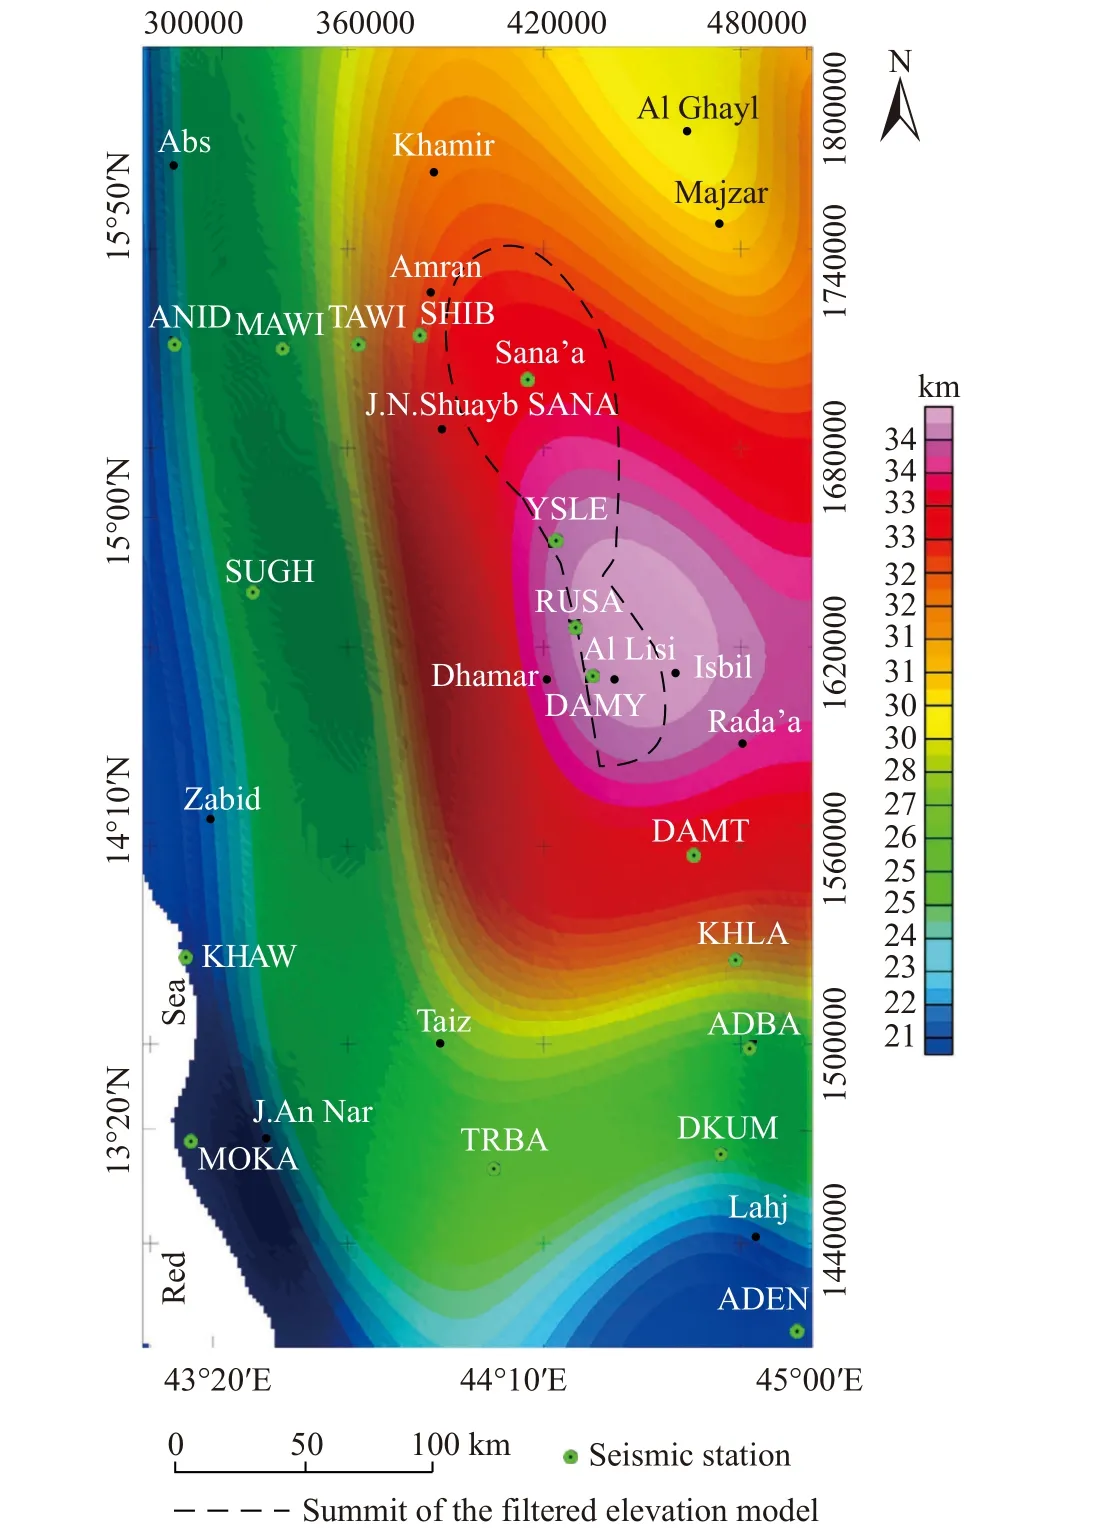
Fig.5.The three dimensional Moho depth model constructed in this study from EGM2008 based on the Parker-Oldenburg algorithm.
The calculated gravity anomaly from the Moho depth model of the study area (Fig.6a) is very close to the observed gravity anomaly (Fig.4b) and the difference between them(gravity residuals) varies from -7 mGal to 9 mGal (Fig.6b).These residuals are mainly attributed to the assumed constant Δρ across the Moho interface by the Parker-Oldenburg algorithm (Oldenburg DW, 1974), which causes a local decrease in the calculated gravity field (relative to the observed field) in regions characterized by a higher Δρ value than that used in inverting gravity data, and vice versa.
Two negative belts are clearly identified on the gravity residual map (Fig.6b).The first one, running between the Dhamar-Rada'a and Sana'a-Amran Quaternary volcanic fields coincides with the upper mantle low velocity zone imaged by Korostelev F et al.(2014).The second belt extends between the Dhamar-Rada'a volcanic field and the Late Miocene Jabal An Nar volcanic area, on the Red Sea coast, where an upper and lower mantle velocity anomalies attributed to the Afar mantle plum are also imaged byKorostelev F et al.(2014)from the surface to a depth of 300 km.Similar to the first belt of gravity residuals, the second belt suggests a channel of hot magmatic materials (or a linear arrangement of small, isolated mantle upwellings) extends along this region.
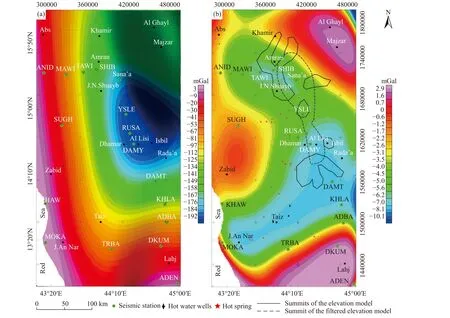
Fig.6.The calculated gravity anomaly from the constructed Moho depth model of the study area (a) and the difference (gravity residuals)between the observed and the calculated gravity anomalies (b).
Several evidences from earlier studies support this interpretation such as the widespread geothermal activity,with a clear mantle imprint distributed along these channels(Fig.6b) in the form of fumaroles, boiling pools, hot springs,hot groundwater wells, etc (Minissale A et al., 2007).Isotopic data show that the Late Miocene volcanic activity in Southwestern Arabia was shifted northeastward in response to the dispersion of the Afar plume head and partially overlapped during the Quaternary (Orihashi Y et al., 1998).The interpreted magmatic channels in this work, based on the negative gravity residuals, also coincide with the narrow low velocity zone attributed to an asthenosperic flow from the Affar plume extending from Afar depression to Harrats Ithnayn and Lunayyir, Western Arabia (Figs 8, 9 ofLim JA et al., 2020).Furthermore, a northeastward dispersion of the Afar mantle plume has been imaged beneath the Arabian plate by several earlier studies (such as Chang SJ and Lee SV,2011; Chang SJ et al., 2011; Kaviani A et al., 2020).
On the other side, a positive closure of gravity residuals is shown in the southern part of Fig.6b, matching the Gulf of Aden coastal plain and the southern basement block (Fig.1).This region is highly intruded by high density materials(Davison I et al., 1994, 1998; Ahmed A et al., 2013; Ali MY and Watts AB, 2013) which increase crustal density and consequently increase the observed gravity anomaly relative to the calculated gravity anomaly.The weak Moho Ps conversion phase from DKUM and ADEN seismic stations indicated byAhmed A et al.(2013) confirm the reduction of density contrast across the Moho interface in this region and assists this interpretation.The same explanation is also valid for the relatively low amplitude positive closure at the upper eastern corner of Fig.6b which is located between Sana'a-Amran and Marib-Sirwah Quaternary volcanic fields,correlated with the Al Jawf graben boundary, and associated at the surface, in addition to the limestone with crystaline basement, granite and other intrusive bodies.
4.3. Isostasy
Isostatically compensated regions are generally characterized by zero or very low isostatic anomalies, whereas overcompensated and undercompensated regions reflect negative and positive anomalies, respectively.This is because both the Bouguer gravity anomaly and the isostatic gravity anomaly are negative, but the Bouguer gravity anomaly is numerically larger than the isostatic gravity anomaly in overcompensated regions and smaller in undercompensated regions.
Isostatic anomaly in the study area (Fig.7) indicates that undercompensated regions (isostatic residuals > 9 mGal)occupied the western and southern parts of the area correlated with coastal plains and the transitional zone between coastal plains and the plateau, mostly matching the shallow and intermediate zones on the Moho depth model (Fig.5).In these regions, the crust is gradually thinned seaward, stretched, and intruded and/or underplatted by high density materials mostly of mantle origin (Davison I et al., 1994, 1998; Ahmed A et al., 2013; Ali MY and Watts AB, 2013; Korostelev F et al.,2014; Lim JA et al., 2020), which explain the deepening of isostatic Moho relative to gravity Moho in these regions.
The plateau shows a couple of compensated and overcompensated conditions.Isostatically compensated region(with isostatic residuals between -9 mGal to 9 mGal)occupied a larger part of the plateau.While the overcompensated region (isostatic residuals < -9 mGal)forming an irregular spot matching well the deepest part of the Moho depth model (Fig.5) below Dhamar-Rada'a Quaternary volcanic field.This suggests that the thermal activity and the erupted magmatic materials in this region reduced the density of the deep lithosphere and asthenosphere and contributed to the deepening of gravity Moho relative to isostatic Moho.
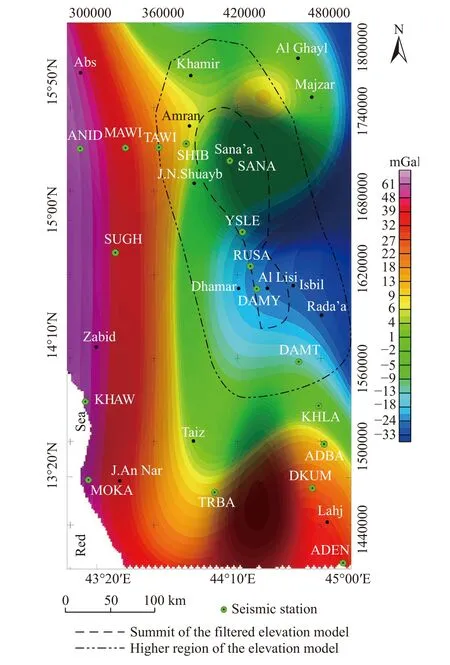
Fig.7.The isostatic anomaly model of the area calculated according to the Airy model for isostatic compensation.
The above discussion suggests that the overall isostatic balance of the area (indicated by the general anticorrelation between ground surface topography and both Bouguer anomalies and the Moho depth model) is achieved by a cooperative effect of several mechanisms (crustal thickening,buoyancy, mantle upwelling, and magmatic activity).
Crustal thickening is generally caused by lithosphere shortening and/or magmatism (volcanism and underplating).In the study area, a huge amount of mantle-derived magma erupted throughout the plateau during the Oligo-Miocene and continued in the Quaternary due to the effect of the Afar mantle plume.(Menzies MA et al., 1992, 1997; Davison I et al., 1994; Baker J et al., 1996).Isotopic data reflect that flood and intraplate basalts are partially derived from garnet-facies mantle melt (Baker J, 1996; Ali MY and Watts AB, 2013;Furman T et al., 2016), suggesting that the lower part of the lithosphere is thinned and permits the ascending of the hot plume/asthenosphere to the upper part of the mantle and undergo decompression melting (Davison I et al., 1998).Thinning of the cold lithosphere drives surface uplift(Davison I et al., 1998; Lim JA et al., 2020), while decompression melting of the hot asthenosphere leads to basaltic underplating (Ji WQ et al., 2012).
As indicated in Section (1), the average elevation of the Yemeni highlands is 2200 m ASL.Of this, the volcanic activity increased the surface elevation by 600 m and the remaining height is attributed to lithospheric thinning,buoyancy, magmatic underplating and flexural upwarp(Davison I et al., 1998).
5.Conclusions
(i) A three-dimensional Moho depth model of the study area is constructed by inverting gravity data from the EGM2008 using the Parker-Oldenburg algorithm.Three zones of Moho depth are recognized on this model.The shallow zone lies below the Red Sea and the Gulf of Aden coastal plains at depths of 20 km to 24 km; the intermediate zone is situated at depths of 24 km to 30 km (correlated mostly with the transitional zone to the plateau); and the deep zone lies below the plateau at depths ranging from 30 km to 35 km.The deepest part of the Moho discontinuity coincides mainly with the Dhamar-Rada’a Quaternary volcanic field.
(ii) The difference between the calculated gravity anomalies from the Moho depth model of the study area and the observed gravity anomalies pointing to two channels of hot magmatic materials linked the Dharmar-Rada'a Quaternary volcanic field with the Sana’a-Amran Quaternary volcanic field, on one side, and with the Late Miocene Jabal An Nar volcanic area, on the other side.The upper mantle low velocity anomaly zones and the widespread geothermal activity recorded by earlier studies in these regions support this conclusion.
(iii) Several mechanisms (such as uplift, magmatism,buoyancy, and mantle upwelling) are contribute to the overall isostatic balance of the study area.
Declaration of competing interest
The author declares no conflicts of interest.
Acknowledgments
Deep thanks to the two anonymous reviewers for their valuable comments and suggestions to improve this manuscript, as well as for future work.The author is greatly thankful for the help of the China Geology editors in processing this manuscript and producing it in this form.The gravity data used in this study was obtained from the EGM2008 provided by the International Centre for Global Earth Models (ICGEM), special thanks to this organization.
杂志排行

China Geology的其它文章
- Heavy metal pollution assessment in marine sediments in the Northwest coast of Sabah,Malaysia
- Geology and mineralization of the Bayan Obo supergiant carbonatite-type REE-Nb-Fe deposit in Inner Mongolia, China: A review
- Discovery of bauxite-type helium source rock in Jinzhong basin, central North China and its resource potential evaluation
- Reply: Comment on “Geological mapping and mining prospecting in the Aouli inlier(Eastern Meseta, Morocco) based on remote sensing and geographic information systems (GIS)” by Benaissi et al.(China Geology, 5 (2022))
- Health risk assessment of heavy metals in soils and crops in a mining area (Au-Ag-Cutrona-oil et al.) of the Nanyang Basin, Henan Province, China
- Melt extraction and mineralization: A case study from the Shuangjianzishan supergiant Ag-Pb-Zn deposit (208 Mt), Inner Mongolia, NE China