Prognostic model and treatment plan analysis of hepatocellular carcinoma based on genes related to glutamine metabolism
2023-12-13LiangYuChenYingWangHaojieRenMingxinLiuGaofengLiuChangqing
Liang Yu, Chen Ying, Wang Hao-jie, Ren Ming-xin, Liu Gao-feng, Liu Chang-qing✉
1.School of Clinical Medicine, Bengbu Medical College, Bengbu 233000, China
2.School of Life Sciences, Bengbu Medical College, Bengbu 233000, China
Keywords:
ABSTRACT Objective: To identify the prognosis of hepatocellular carcinoma (HCC) and the effect of anti-cancer drug therapy by screening glutamine metabolism-related signature genes because glutamine metabolism plays an important role in tumor development.Methods: We obtained gene expression samples of normal liver tissue and hepatocellular carcinoma from the TCGA database and GEO database, screened for differentially expressed glutamine metabolismrelated genes (GMRGs), constructed a prognostic model by lasso regression and step cox analysis, and assessed the differences in drug sensitivity between high- and low-risk groups.Results: We screened 23 differentially expressed GMRGs by differential analysis, and correlation loop plots and PPI protein interaction networks indicated that these differential genes were strongly correlated.The four most characterized genes (CAD, PPAT, PYCR3, and SLC7A11) were obtained by lasso regression and step cox, and a risk model was constructed and confirmed to have reliable predictive power in the TCGA dataset and GEO dataset.Finally,immunotherapy is better in the high-risk group than in the low-risk group, and chemotherapy and targeted drug therapy are better in the low-risk group than in the high-risk group.Conclusion: In conclusion, we have developed a reliable prognostic risk model characterized by glutamine metabolism-related genes, which may provide a viable basis for the prognosis and Treatment options of HCC patients.
1.Introduction
Hepatocellular carcinoma is the most common primary liver cancer, and its incidence is on the rise, according to the latest cancer burden data for 2020 released by the World Health Organization’s International Agency for Research on Cancer.HCC is the sixth most common cancer worldwide and has the third highest mortality rate in the world[1].HCC is characterized by insidious onset, high malignancy, rapid progression, poor prognosis, and high mortality.This makes the 5-year survival rate of HCC patients only 10.1%, but the 5-year survival rate can be increased to about 50% if patients are detected early and treated surgically[2].However, the vast majority of HCC patients are already at an advanced stage at the time of presentation, when surgical treatment is not effective[3].Therefore,it is clinically important to explore new potential markers for prognosis prediction and individualized treatment.
Glutamine has a key role in cell survival and growth.Glutamine can synthesize nucleic acids, lipids, and proteins required for cell growth through the multiple mechanisms of action of different enzymes and genes through different cellular signaling pathways[4].Glutamine is not an essential amino acid, but is considered conditionally essential, especially under catabolic stress conditions,such as post-surgery and trauma, where the demand for glutamine increases dramatically in the gastrointestinal tract, kidneys, and immune system[4].In addition, glutamine is closely related to the malignant progression of tumors[5].Due to the rapid proliferation of tumor cells, glutamine is transformed into a conditionally essential amino acid when glutamine synthesis cannot meet the demands of tumor proliferation as a nutrient for tumor cell energy supply and as an important precursor for the synthesis of nucleotides, proteins,and GSH synthesis[6].It has been shown that tumor cells utilize glutamine through glutamine transporter protein uptake to provide energy and biosynthesis to tumor cells, thus promoting malignant progression of the tumor[7].Recent studies have shown that glutamine metabolism is extensively involved in the proliferation and invasive metastasis of hepatocellular carcinoma, suggesting that glutamine metabolism is a potential prognostic and therapeutic target for hepatocellular carcinoma.
Immunotherapy joins surgery, chemotherapy, and radiotherapy as new optional options for cancer treatment[8].Glutamine metabolism regulates tumor development by affecting the tumor microenvironment (TME)[9].In triple-negative breast cancer, tumor cells competitively prey on glutamine in TME, resulting in limited availability of glutamine to tumor-infiltrating T lymphocytes and thus affecting their antitumor immune response[10].In glutamineaddicted clear cell renal cell carcinoma, competitive depletion of glutamine by tumor cells leads to local deprivation of extracellular glutamine, resulting in proliferation and activation of Treg cells,thereby inhibiting the antitumor activity of Teff cells[11].Thus,the genomic signature of glutamine metabolism in immune and cancer cells is a promising predictor of immunotherapy and clinical outcomes.
We systematically analyzed the expression of GMRGs and their effects on the clinical characteristics, prognosis, and treatment response of HCC patients.We performed differential analysis of the TCGA database and screened 23 differentially expressed GMRGs.and showed a strong correlation between them.The 14 genes associated with patient survival status were then screened by oneway cox.Further, four genes were screened by lasso regression and step multifactorial cox to construct a scoring model, which can accurately predict clinical outcomes and immune and drug treatment effects in HCC patients.We expect that this study will contribute to the development of feasible immune and pharmacological treatments for HCC.
2.Materials and Methods
2.1 Data selection and acquisition
RNA expression data, somatic mutation data, CNV files, and corresponding clinicopathological information of HCC were retrieved from the TCGA-LIHC database (https://portal.gdc.cancer.gov/) and the GEO database (https://www.ncbi.nlm.nih.gov/geo/)was used to obtain GSE14520 clinical parameters and normalized gene expression data[12].Six gene sets related to glutamine metabolism were obtained from the MSigDB database (Hallmark gene set), with a total of 80 GMRGs after removal of duplicates.
2.2 Development and validation of GMRG-based prognostic features
The 14 GMRGs associated with HCC identified in the univariate Cox regression analysis were subsequently analyzed by least absolute shrinkage and selection operator (LASSO) regression using the R package “glmnet”.In order to prevent overfitting effects of the model, the penalty parameter λ was determined by tenfold cross-validation, and finally 7 genes were screened for the next step of Step multi-factor cox using the “rms” package.Four GMRGs were finally selected to construct the risk score model based on the corresponding coefficients and gene expressions.The GMRGs characteristic risk scores were calculated for each patient as follows:
Coef(i) and X(i) denote the regression coefficients and gene expression values associated with GMRGs.A lasso regression algorithm in R programming language was used to calculate risk scores.The regression coefficients calculated from linear combinations of multiple genes were used to classify subjects into high and low risk groups by median risk score.ROC curves were analyzed at 1, 3, and 5 years using the “time-ROC” (version 0.4) R package.
2.3 Construction of the column line diagram
The column line graphs are intended to provide valuable clinical predictions for patients with liver cancer, including their risk scores and other clinicopathologic characteristics, particularly regarding OS at 1, 3, and 5 years.We developed GMRGs-related clinicopathological column line graphs using the “rms” and “regplot”R packages.We then performed calibration curve analysis and decision curve analysis (DCA) to validate the clinical reliability of the established column line graphs.
2.4 Immunotherapy analysis
The Tumor Immune Dysfunction and Rejection (TIDE)algorithm was used to infer the clinical response of patients to immunotherapy[13].The IMvigor210 cohort combined with anti-PD-L1 therapy was analyzed in a study of the correlation between the GMRGs scoring model and immunotherapy response[14].The complete data sets in Mvigor210 cohort, including gene expression data and clinical information, are from http://research-pub.gene.com/IMvigor210CoreBiologies.
2.5 Drug treatment analysis
We used the Genomics of Drug Sensitivity in Cancer (GDSC)dataset (https://www.cancerrxgene.org/) to assess the response to chemotherapy in each sample.Based on GDSC data, we used the half-maximal inhibitory concentration (IC50) to estimate the drug response.The prediction procedure was undertaken by the“pRRophetic” package in the R language[15].
2.6 Data Analysis
Clinicopathological factors associated with prognosis were determined by one-way cox and Step Cox analysis.Categorical data were tested by the chi-square test.Survival curves were generated for each subgroup in the dataset using the Kaplan-Meier method.P values less than 0.05 were considered statistically significant.All statistical analyses were performed by R (version 4.2.1).
3.Results
3.1 Mutations and interactions of GMRG in HCC
We first identified the expression levels of 80 GMRGs in tumor specimens and normal specimens using the TCGA-LIHC dataset.A total of 23 differential genes (DEGs) were identified (all | logFC | >1, adjusted P value < 0.05), and most of the DEGs were abundant in the tumor samples.The expression of all genes was higher in HCC than in normal tissues, except for AADAT, GLYATL1, ASS1, and UROC1, whose expression was lower than in normal tissues (Figure 1A).Similarly, a strong positive correlation could be observed between these DEGs based on the correlation network constructed on the mRNA expression levels in TCGA-LIHC (Figure 1B).Protein-protein interaction (PPI) analysis was established through the String website, revealing that DEGs have a strong interaction(Figure 1C).Next, we determined the incidence of copy number variation (CNV) and somatic mutations in 23 GMRGs in HCC.40 of 371 HCC samples (10.78%) showed mutations, with the highest mutation rate of 2% in the SLC25A12 gene and 1% in the remaining 9 genes (Figure 1D).Figure 1E shows the CNV alteration loci of 23 GMRGs on chromosomes.The above analysis indicates that the genetic and expression changes of GMRGs in HCC are highly heterogeneous, revealing that the imbalance of GMRGs expression plays a key role in the development of HCC.
3.2 Prognostic risk model for HCC based on GMRGs
We constructed a risk-prognosis model based on GMRGs.Univariate COX analysis revealed that only 14 prognosis-related genes were associated with OS in patients out of 23 DEGs (P<0.05)(Figure 2A).Next, we included the 14 GMRGs in the lasso regression analysis below.Figure 2B-C shows the tenfold crossvalidation of lasso regression and lasso regression, resulting in 7 genes retained for the next step of step cox regression analysis and 4 genes retained for the final prognostic model construction as a final result.The risk score was calculated as follows: risk score =(0.3530 * CAD expression) + (0.5985 * PPAT expression) + (0.1797* PYCR3 expression) + (0.2609 * SLC7A11 expression).

Fig 2 Construction of the risk model
3.3 Distribution characteristics of the risk prognostic model
We then further analyzed the overall distribution of risk features.Figures 2A-B show that the four risk-related genes had consistent expression trends in both the training and validation sets, i.e., all were highly expressed in the high-risk group.We ranked the risk scores of the two sample patients from low to high, and the results are shown in Figure 2C-D.The distribution of patients’ high and low group scores and overall survival time is shown in Figure 2E-F plots,and the results indicate that patients with higher risk scores have shorter survival time.Then we compared the risk scores in different clinical information (survival status, clinical stage of tumor, and histological stage of tumor), and it can be seen that death status and stages 3-4 have higher risk scores, which proves that the prognostic risk model also has a guiding effect on clinical information.
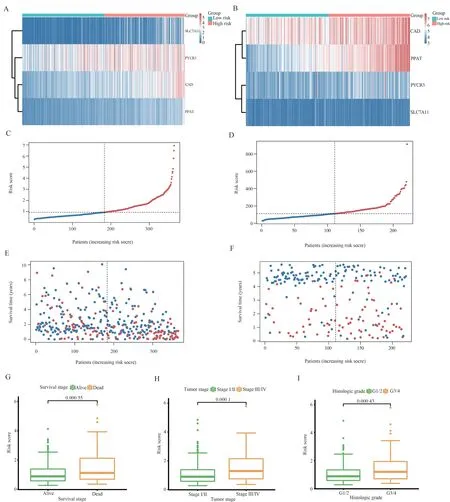
Fig 3 Survival analysis of risk scores in the TCGA cohort and GEO cohort
3.4 Construction of column line graphs to predict prognosis of HCC patients
Due to the high correlation between risk scores and patient prognosis, we incorporated clinical parameters (age, gender, and clinical stage of the tumor) to create the line graphs.Columnar plots were used to estimate the 1-, 3-, and 5-year OS of HCC patients(Figure 4A).The calibration curve of this established line plot showed high accuracy between the actual observed and predicted values (Figure 4C).In addition, we estimated the AUC values of these clinical factors for predicting 1-year, 3-year, and 5-year OS, respectively.As shown in Figure D, the AUC values were as expected, which implies that the column line plot has excellent predictive power for prognosis.The Kaplan-Meier survival analysis showed that the overall survival of patients in the high-risk group was significantly shorter (Figure 4B).Also, the results of the analysis in the GEO cohort were consistent with the TCGA cohort, and the surface-constructed column line graphs had high accuracy.(Figure 4E-G).
3.5 Immunotherapy effect analysis

Fig 4 Construction and validation of column line diagrams

Fig 5 Immunotherapy effects and immune checkpoint differences in the GMRGs risk score model
The low-risk group had a higher TIDE score, demonstrating that they were more insensitive to immunotherapy (Figure 5A).The Dysfunction score and the Exclusion score could be used to explain this phenomenon.The low-risk group had a higher Dysfunction score (Figure 5B), demonstrating low immune cell function, and the high-risk group had a higher Exclusion score (Figure 5C),demonstrating rejection of immune cells.Then, to further explore the value of GMRGs in predicting response to immunotherapy,we in the IMvigor210 cohort analyzed the difference in the effect of receiving anti-PD-L1 immunotherapy between the high-risk and low-risk groups.Patients in complete and partial remission with immunotherapy had higher risk scores than patients with stable and progressive disease (Figure 5D), implying that the highrisk group was more likely to benefit from immunotherapy.The e-plot illustrates that a higher proportion of patients in the re-risk group were in complete and partial remission, and a chi-square test indicated that this difference was significant (P=0.01).We then compared the difference in tumor mutation load in the high and low risk groups, and the results were not significant, indicating that TMB predicts immunotherapy inappropriately in a risk model based on GMRGs.Finally, we compared the differences in the expression of immune checkpoint molecules in the high- and low-risk groups(Figure 5G) and saw that most of the immune checkpoint molecules were highly expressed in the high-risk group, indicating that the high-risk group was more likely to benefit from immune checkpoint inhibitors.
3.6 Drug sensitivity analysis
We used the pRRophetic algorithm to explore the association between the GMRGs-based risk scores of HCC patients and their response to six common anticancer drugs (cisplatin, methotrexate,doxorubicin, lapatinib, nilotinib, pazopanib, rapamycin,sorafenib, and tipifarnib) (Figure 6A-I).It can be seen that both chemotherapeutic agents and targeted agents were better treated in the low-risk group than in the high-risk group, except for the highrisk group, where lapatinib was more effective.
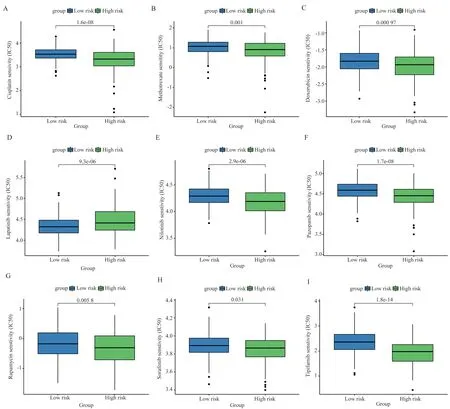
Fig 6 Assessing treatment response through the GMRGs risk model
4.Discussion
Glutamine is an important support material for tumor proliferation and invasion.It has long been shown that hepatocellular carcinoma cells cannot grow in media lacking glutamine, and the more glutamine is added to the media, the faster the cells proliferate and the greater their ability to invade and migrate[16].Tumor cells can transport glutamine through specific transporter proteins (e.g., solute carrier family 1 neutral amino acid transporter member 5, SLC1A5),which are then converted to glutamate by glutaminase and then to α-ketoglutarate, which enters the tricarboxylic acid cycle and participates in tumorigenesis, development, and migration[17,18].For example, glutamine metabolites in tumor cells provide energy for tumor progression after entering the tricarboxylic acid cycle[19].Glutamine catabolism produces raw materials for the synthesis of macromolecules, such as amino acids, nucleotides, fatty acids, and hexosamine, which are required by tumor cells[20].
Glutamine is then essential for immune cells to proliferate and function[21].For example, T cells in an activated state require increased glutamine uptake for rapid proliferation while promoting cytokine secretion[22]; Glutamine also allows B-cell proliferation and survival[23], and also promotes B-cell differentiation into plasma cells and lymphocytes[24].Neutrophils consume glutamine at the highest rate relative to other leukocytes, such as macrophages and lymphocytes[25,26].And glutamine enhances superoxide production in neutrophils through ATP production and regulates the expression of components of the NADPH oxidase complex[27].
However, the competitive uptake of glutamine by tumor cells and immune cells in TME leads to glutamine deficiency and the highest consumption of glutamine by tumor cells, which affects the function of immune cells[9].Selective blockade of glutamine metabolism in tumor cells can enhance the antitumor immune response by eliminating metabolic competition for glutamine in TME and simultaneously releasing glutamine for use by immune cells[10,28].Therefore, glutamine metabolism plays an important regulatory and prognostic function in tumor development and good immune function, and is a viable indicator for the selection of immunotherapy.
In this study, we first determined the transcriptional alterations and expression levels of differentially expressed GMRGs based on the TCGA-LIHC cohort and examined the gene mutations in these GMRGs.Despite the low intensity of mutations in these genes,most of them were upregulated in HCC patients and associated with prognosis.We then further screened 23 GMRGs associated with HCC survival and finally retained four genes (CAD, PPAT,PYCR3, and SLC7A11) by lasso regression and step cox analysis to establish a scoring mechanism capable of quantifying individual patient characteristics.Not only does it help to establish an accurate prognostic model, but it also analyzes the effects of immunotherapy and drug therapy through GMRGs scores, which can help clinicians effectively evaluate the rationality of immunotherapy and drug therapy as treatment options.
The four differentially expressed genes of GMRGs (CAD, PPAT,PYCR3, and SLC7A11) screened in this paper were associated with the prognosis of hepatocellular carcinoma.CAD is carbamoyl phosphate synthase 2, which catalyzes de novo pyrimidine synthesis[9].The enzymatic activity of CAD is increased 1.3-5.9-fold in hepatocellular carcinoma compared to that in normal liver tissue and is positively correlated with tumor growth rate[29].It has also been shown that reduced activity of argininosuccinate synthase in cancer supports proliferation by activating CAD and promoting pyrimidine synthesis[30].PPAT is a phosphoribosyl pyrophosphate amidotransferase that catalyzes the biosynthesis of coenzyme A[31].PPAT inhibitory expression affected the growth of three cell lines of neuroendocrine carcinoma and was strongly correlated with poor patient prognosis[32].PPAT inhibitory expression affected the growth of three cell lines of neuroendocrine carcinoma and was strongly correlated with poor patient prognosis[33].PYCR3 is pyrroline-5-carboxylate reductase 3, a cytoplasmic enzyme involved in the biosynthesis of proline from ornithine, which is upregulated in colorectal cancer and is required for cancer cell survival and proliferation[34].Solute carrier family 7 member 11 (SLC7A11) is an amino acid transporter protein that is frequently overexpressed in human malignancies[35].The expression and activity of SLC7A11 is finely regulated by oncogenes and tumor suppressors in tumor cells through multiple mechanisms and is highly specific for cystine and glutamate[36].In pancreatic ductal adenocarcinoma, knockdown of SLC7A11 inhibits tumor growth and metastatic spread[37].High expression of all four of these genes increases the rate of tumor proliferation and is associated with high expression of the four risk genes in the high-risk group for liver cancer, suggesting a poor prognosis for patients.
We then constructed a risk score model for hepatocellular carcinoma based on the four screened GMRGs and divided the patient population into two subgroups: high-risk and low-risk.KM curves showed significant survival differences between the two groups, and their predictive robustness for 1-year, 3-year, and 5-year OS was verified by ROC curves.Thus, the GMRGs scoring model has a reliable predictive power for patient prognosis.Finally,we found that four genes associated with risk scores were highly expressed in the high-risk group and were associated with a poorer prognosis in the high-risk group.We also compared the risk scores of different clinical information, and the results showed that survival status, clinical staging, and histological grading all had higher risk scores, indicating that the risk-prognosis model we constructed is still useful as a guide for clinical information.We then assessed the difference in immunotherapy status between the high and low risk groups using the TIDE algorithm and the IMvigor210 cohort.Immunotherapy was found to be less effective in the low-risk group than in the high-risk group, with low immune cell function in the low-risk group and rejection of immune cells in the high-risk group.We speculate that immune cells with low function are often difficult to reverse to normal function, so the effect of immunotherapy is often not good, while immuno-rejected tumors can play an immune role as long as the rejection state is lifted and the cells function normally,so they often have a better effect on immunotherapy, which requires further experimental verification.The IMvigor210 cohort analysis similarly showed that the immunotherapy effect was better in the high-risk group than in the low-risk group.Also, we compared the immune checkpoint expression between the two groups and found that the high-risk group expressed most of the immune checkpoint molecules, indicating that the high-risk group was more likely to benefit from immune checkpoint inhibitors.Finally, we compared the anti-cancer drug therapy in the high- and low-risk groups, and the results indicated that the low-risk group may be more suitable for drug therapy.Thus, the high-risk group is more suitable for immunotherapy, while the low-risk group is more suitable for drug therapy.
In conclusion, our study shows new insights into the effects of glutamine metabolism on HCC and GMRGs-related therapies, but there are many limitations.These data were obtained retrospectively from public databases, and it is important to conduct prospective studies and complete in vitro and in vivo experiments to validate and optimize the risk scoring models associated with GMRGs.Finally,our findings provide new ideas and directions for the selection of appropriate treatments and prognosis prediction for HCC patients.
Authors’ contribution
Yu Liang: article design, data analysis and manuscript writing; Ying Chen, Haojie Wang and Mingxin Ren: relevant literature collection and collation, data analysis; Changqing Liu and Summit Liu: provide overall ideas and revisions.
All authors declare that there is no conflict of interest.
杂志排行

Journal of Hainan Medical College的其它文章
- Effect of naringin on despair behavior and neuroprotective mechanisms in mouse model of menopausal depression
- Maternal stress exposure during pregnancy impairs ultrastructural changes in the white matter and reduces cognitive function in offspring mice
- Efficacy and safety of oral Chinese patent medicine combined with sacubitril/valsartan in the treatment of chronic heart failure: A Metaanalysis
- Effect of glycyrrhetinic acid on Th1/Th2 balance in cough variant asthma mice
- Study on pharmacodynamics and mechanism of nano-Kuiyangye in treating radiation esophagitis in rats
- Construction and validation of prognostic model of Cuproptosis-related LncRNA in osteosarcoma