Analysis on the visual recognition effect of Tibetan-Chinese bilingual guide signs
2023-12-05ChenFeiSuGuanhongZhangDanniWangChenzhuZhangYunlongBoWu
Chen Fei Su Guanhong Zhang Danni Wang Chenzhu Zhang Yunlong Bo Wu
(1School of Transportation,Southeast University,Nanjing 211189,China)(2Zach Department of Civil &Environmental Engineering,Texas A& M University,Texas 3136,USA)(3School of Engineering,Tibet University,Lhasa 850000,China)
Abstract:The influence of Tibetan characters on the visual recognition effects of Tibetan-Chinese bilingual guide signs based on drivers’ visual characteristics was studied.Four versions of Tibetan-Chinese bilingual guide signs with different heights and aspect ratios of Tibetan characters were designed,and corresponding road simulation models were established.10 Tibetan drivers and 10 Han drivers were selected to conduct driving simulation experiments using a driving simulator and eye tracker.The resultant data of the participant’s pupil diameter and the visual recognition duration obtained from the eye tracker system were analyzed by analysis of variance.Combining results from the statistical analysis of driving simulator data and the questionnaire results on the visual recognition experience,it can be concluded that for Tibetan drivers,when the height of Tibetan characters was 2/3 of the height of Chinese characters,the visual recognition effect of the signs was better than that of 1/3 and 1/2 of the height of Chinese characters,indicating that increasing the height of Tibetan characters was conducive to improving the visual recognition effect of guide signs.The aspect ratio form of Tibetan had no significant effect on the level of difficulty encountered in drivers’ visual recognition,but it would affect the aesthetics of the bilingual guide signs.The recommended character height in Tibetan should be increased to improve the visual recognition process for Tibetan drivers.
Key words:Tibetan-Chinese bilingual; guide sign; driving simulation; visual recognition characteristics
Tibetan is mandatory in Tibet,and it is to be used in urban public facilities,signboards,advertisements,etc.,together with the common national characters,Chinese or the Han language and is also used widely in Qinghai,Gansu,and other regions.The text on traffic signs must be such that drivers can read it quickly and accurately within a given distance.However,there are no specific regulations on the setting and layout of Tibetan-Chinese bilingual traffic signs.The specifications for the layout of traffic signs take the height of Chinese characters as the standard and give the proportion range of the size of minority language characters,that is,1/3 to 1/2 of the height of Chinese characters[1].In practice,this leads to small Tibetan fonts,an unreasonable layout design,an imbalance in the aspect ratio,and other undesirable phenomena,which will affect Tibetan drivers’ visual recognition of traffic signs adversely.Moreover,situated on a plateau with an average elevation of 4 500 m above sea level,the air pressure is low,the air is thin,the air temperature is low,and the natural environment is somewhat harsh,and all these factors play a major role in influencing drivers’ cognitive ability,judgment,and responsiveness.Dykiert et al.[2]found that reaction time becomes markedly impaired above a threshold of 4 000 m,which was consistent with the findings of Bolmont et al[3].
In addition to the above issues,although bilingual guide signs are common in ethnic minority areas or international cities,extant studies on the visual effects of bilingual traffic signs are limited,especially Tibetan and Chinese bilingual traffic signs.According to previous studies,information on bilingual guide signs could be found disruptive to drivers with different language backgrounds[4].It takes more time to read bilingual signs than monolingual ones[5-6].Jamson et al.[7]selected bilingual road signs used widely in various countries as research objects to explore the impact of bilingual road signs on drivers.The results showed that bilingual signs could guide multinational drivers but sometimes distract national drivers.Yang et al.[8]discussed the effectiveness of Chinese-English bilingual guide signs for drivers with different language backgrounds on Chinese highways.For Chinese drivers,when the number of Chinese place names on the sign was fewer than 5,there was almost no difference in the effect of monolingual and bilingual signs.When the number of place names exceeded 5,the performance of visual recognition for Chinese in the bilingual guide sign scenario was worse than in the monolingual guide sign scenario.Therefore,to meet the needs of different road users,it is necessary to carry out targeted research on Tibetan-Chinese bilingual guide signs based on visual characteristics.
Visual characteristics are important indicators in evaluating drivers’ cognitive activities,which can reflect the visual effect of traffic signs well.The concepts of fixation point number,fixation point order,fixation duration,pupil size,sight angle and other eye movement parameters,and the objects they can represent have been demonstrated in detail in previous studies[9-11].Fixation frequency,fixation duration,and spatial distribution were correlated significantly with drivers’ actual performance in driving tasks.Specifically,more complex cognitive activities are frequently accompanied by reduced eye movement,prolonged gaze duration,and reduced the spatial distribution of the gaze itself[12-13].In terms of experimental methods,compared with a static picture or a video playback experiment,a dynamic driving simulation experiment has the advantage of being closer to the real driving environment,so it is used more widely to analyze drivers’ eye movement data analysis[14-16].Costa et al.[17]studied the visual attention of 15 drivers to different types of guide signs and found that the gaze duration,sign category,and number of characters had a significant influence on speed.Lin et al.[18]used the eye tracker to record the duration of the driver’s viewpoint on guide signs and studied the quantitative relationship between the information on guide signs and the driver’s visual recognition time.Pei et al.[19]divided the sign layout into three parts (left,middle,and right),selected visual characteristics with low correlation to construct comprehensive evaluation indicators,and studied the visual effect of different layout areas,among which the visual effect of the right area was found to be better than that of the middle area.Therefore,it is reasonable and feasible to study Tibetan and Chinese bilingual directions based on visual characteristics.
In summary,this paper aimed to take Tibetan-Chinese bilingual guide signs of the highways in Tibet as the research object,conduct driving simulation tests,and study the effect of different layout design parameters (Tibetan character height and aspect ratio forms) on the visual recognition of Tibetan-Chinese bilingual guide signs by analyzing drivers’ visual characteristics and eye movement behaviors.Suggestions for optimizing Tibetan-Chinese bilingual guide signs are offered.This study can provide a reference for subsequently improving the layout and setting of bilingual guide signs and enhancing the effectiveness of guide signs in Tibet.
1 Materials and Methods
1.1 Participants
According to previous research on visual recognition of signs,Costa et al.[17]studied the gaze duration and sign category of a sample of 15 drivers.Xu[20]counted the number of subjects in nearly one hundred articles and found the sample size of a single group of driving simulation experiments ranged from 10 to 30.Twenty participants with a driver’s license were recruited for this experiment,including 10 Han volunteers whose mother tongue is Chinese (GroupC) and 10 Tibetan volunteers whose mother tongue is Tibetan (GroupT).All participants were college students with ages ranging from 20 to 24 years (M=21.5,SD=1.4),with a driving age from 1 to 4 years (M=2.7,SD=1.4),in good health,and with visual acuity of 20/40 or better.
1.2 Apparatus
A driving simulator and eye tracker are used to investigate drivers’ visual characteristics in response to different designs of the bilingual guide sign.
The driving simulator comprises a cockpit and a console,plus a display system made up of three 60-inch liquid crystal displays.It can be used to collect experimental data,including characteristics of driving behavior and vehicle dynamics.The real-time simulation and modeling are controlled with UC-WIN/ROAD software developed by the Japanese company FORUM8.The software has the functions of three-dimensional road simulation modeling and driving simulation.The simulation environment was created by calibrating parameters such as road alignment data,the surrounding environment,traffic signs,and traffic flow in the software.
The driver’s eye movement data were collected by the Tobii Pro Glasses 2 eye tracker manufactured by Tobii,a Swedish company.It consists of a head-mounted module,a recording module,a computer equipped with controller software and the ErgoLab human-computer interaction cloud platform.The effective range obtained by the eye tracker is 52° up to down,82° left to right,and the sampling rate is 50 Hz.
1.3 Experimental scene
The road simulation model was established based on the environmental and alignment parameters of a section of the 318 National Highway from Lhasa to Nyingchi,which is a two-lane,two-way road and the design speed is 60 km/h.The test route is 7 km in length,with 3 T-shaped intersections.The layout,position and support modes of guide signs were set according to the Specification for Layout of Highway Traffic Signs and Markings[1].
The current design of Tibetan-Chinese bilingual guide signs takes Chinese characters as the benchmark.The height of Tibetan characters is 1/3 to 1/2 of the height of Chinese characters (H),and their width is in two forms: expanding with the width of Chinese characters and fixing the aspect ratio to 1.5.To explore the visual recognition effect of Tibetan-Chinese bilingual guide signs,4 types of test guide signs,Type A,Type B,Type C,and Type D,were designed.The combination forms of character height and aspect ratio are shown in Tab.1.
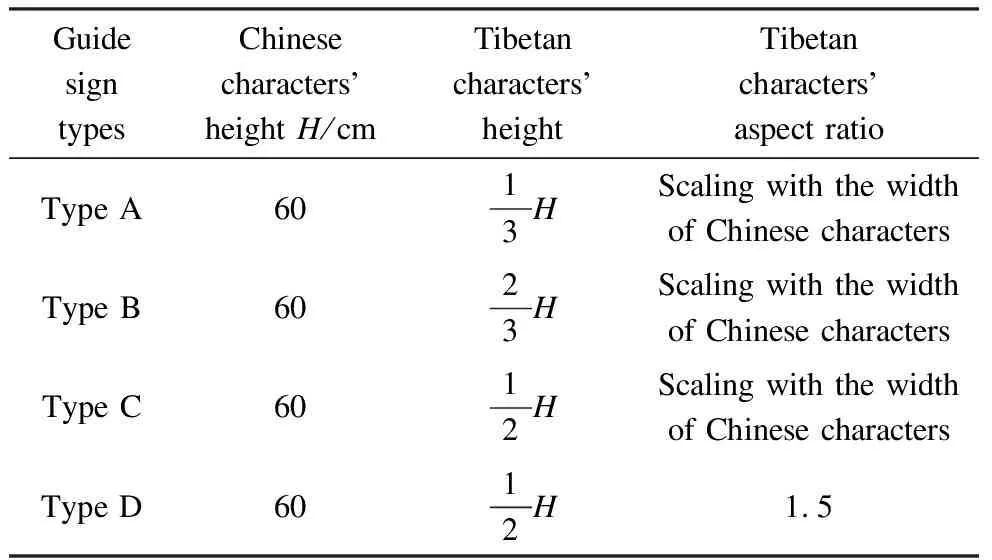
Tab.1 Four types of test guide signs
Considering the more common practice,the Tibetan aspect ratio form of expanding with the width of Chinese characters was applied to Types A,B and C guide signs to explore the influence of character height on drivers’ visual recognition of road signs.Type C and Type D have the same character height,which was used to explore the impact of the aspect ratio setting on drivers’ visual recognition of road signs.Fig.1 shows the guide sign examples of Type A,Type B,Type C,and Type D.
1.4 Procedure
Each participant was informed of the purpose and tasks of the experiment and was asked to read and sign an informed consent form.The experimental site was in the school’s driving simulation laboratory.Before the formal experiment began,participants had a warm-up practice for about 5-15 min to become accustomed to the simulator and the eye tracker.After the staff had imported the experimental scene onto the three-screen display,the participants were informed of their driving destination in the simulation.Then,they were requested to drive to their destination by identifying the guide signs correctly.Each participant was required to conduct four tests,each lasting about 15 min,for a total of about 1 h,and the Tibetan character height and the aspect ratio of the signs were different in each test.At the end of a single test,the staff would replace the place name order of each intersection in the model to prevent participants from becoming familiar with the road conditions and causing biases in the test data.Due to the limited location of the experiment,only the differences in the visual cognitive responses of Tibetan and Han drivers were considered,and the effects of the plain and plateau regions on visual cognitive responses were not considered.
On completion of the experiments,the participants were asked to complete a questionnaire,which consisted of three sections: questionnaire description,personal information,and questions about the experimental scenes[21],as shown in Tab.2.Through the form of a questionnaire,the driver’s visual experience and subjective feedback on the guide signs can be obtained.

Tab.2 Composition of the questionnaire for the simulation driving experiment
1.5 Data processing
1.5.1 Extracting the segments of drivers’ visual recognition of guide signs
The fixation point trajectory diagram can show the sequence and position of the driver’s fixation points on the video screen.The size and number of the dots represent the fixation time and order,respectively,which can be applied to show the eye movement trajectory pattern of a single participant in the whole process of eye movement recording.ErgoLab is used to export the data of the fixation point trajectory diagram and obtain the data of fixation point size,fixation point number,fixation point start time,fixation point end time,fixation point duration,etc.
Taking the No.1 Han driver as an example,at 45.105 s of the test process,the driver’s fixation point moved from PointAto PointB,indicating that the driver began to read the guide sign,as shown in Fig.2(a).

(a)
At 47.267 s of the test,as shown in Fig.2(b),the driver’s fixation point moved from PointBto PointC,indicating that the driver had finished reading the sign and looked away.Therefore,it can be concluded that the period of the driver’s visual recognition of the guide sign is from 45.105 to 47.267 s,and the visual recognition duration is 2.162 s.The eye movement data,such as pupil radius,fixation point coordinates,and fixation duration corresponding to this period,were exported for data analysis.
1.5.2 Data analysis
The Shapiro-Wilk test was used to confirm the normality of the data.Then,the performances of 4 types of guide signs were compared using the one-way analysis of variance (ANOVA) and post hoc multiple analysis to examine whether the differences between the groups were significant.
2 Results
2.1 Pupil diameter
The pupil diameter data of Group T (Tibetan drivers) were analyzed,and the descriptive statistical data and normal distribution test results obtained are shown in Tab.3.The pupil diameter data of Group T showed the characteristics of a normal distribution (W=0.951,p=0.081>0.05).
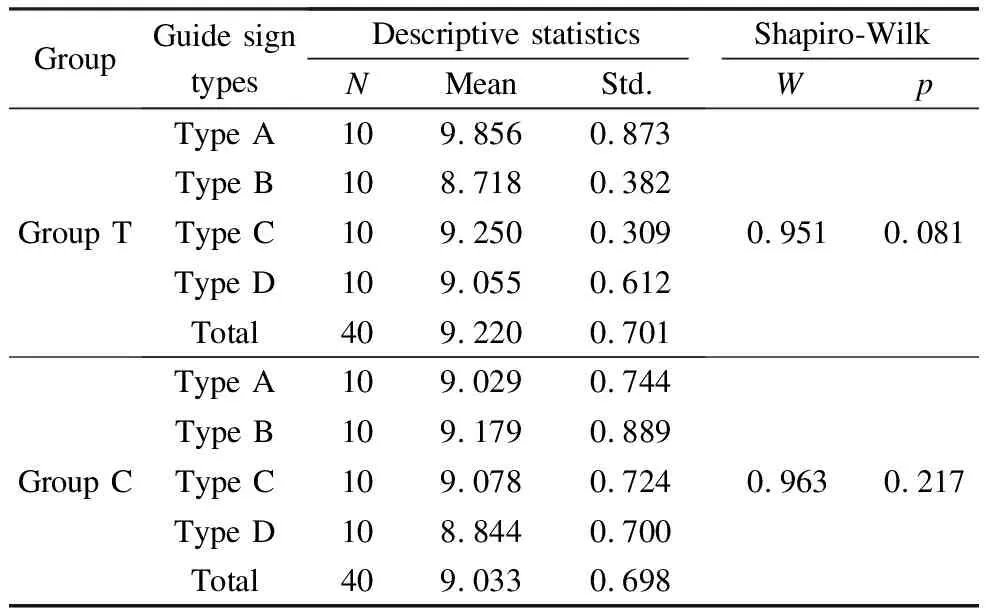
Tab.3 Basic statistics of pupil diameters


Fig.3 Pupil diameters of Group T and Group C
As can be seen in Tab.4,for the variance homogeneity test of Group T,there was no significant difference in the fluctuation of pupil data (p>0.05),that is,the premise requirement of homogeneity of variance was satisfied,and according to the results of one-way ANOVA,for Group T,the pupil diameter of different types of guide signs showed significant differences (F=6.676,p<0.05),indicating that different types of guide signs had significant effects on the pupil diameter of drivers.

Tab.4 One-way ANOVA of pupil diameters

Descriptive statistics and a normal distribution test were applied to the pupil diameter data of Group C (Han drivers),and the results are shown in Tab.3.The pupil diameter data of Group C showed the characteristics of a normal distribution (W=0.963,p=0.217>0.05).
As can be seen in Fig.3,for Group C,the pupil diameter of the Type B guide signs was the largest,and that of the Type D guide signs was the smallest,but the overall difference between the four types of guide signs was small.According to the variance homogeneity test of Group C,there was no significant difference in the fluctuation of pupil data (p>0.05),and statistical requirements were met.The one-way ANOVA was used to study the difference between different types of guide signs on the pupil diameter of Group C,as shown in Tab.4.For Group C,different guide sign types showed no obvious differences in terms of pupil area (F=0.385,p=0.764>0.05),that is,the change in height and aspect ratio of Tibetan characters had almost no effect on the visual recognition effect of Chinese readers.
2.2 Visual recognition duration
The visual recognition duration data of Group T were analyzed,and the descriptive statistical data and normal distribution test results obtained are shown in Tab.5.The pupil diameter data of Group T showed the characteristics of a normal distribution (W=0.947,p>0.05).
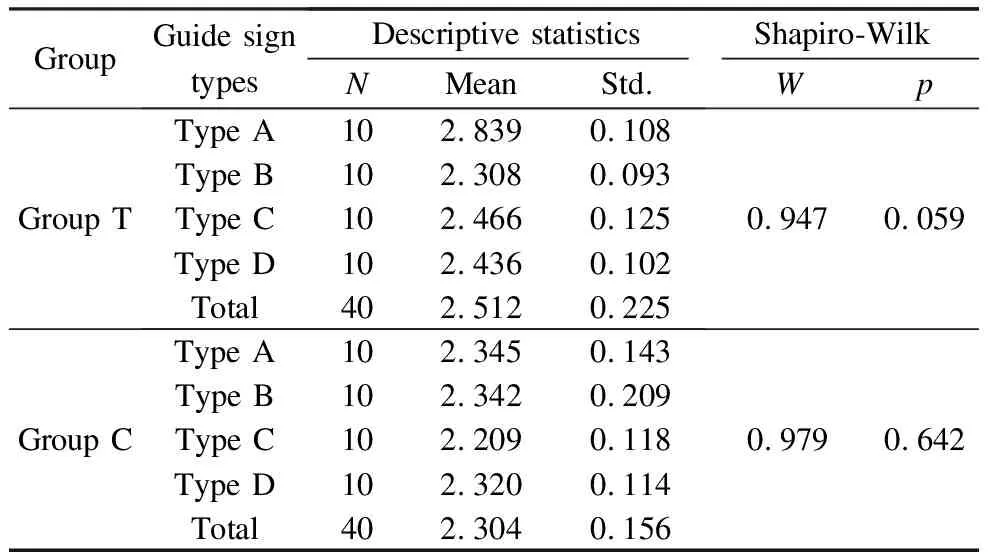
Tab.5 Basic statistics of visual recognition duration

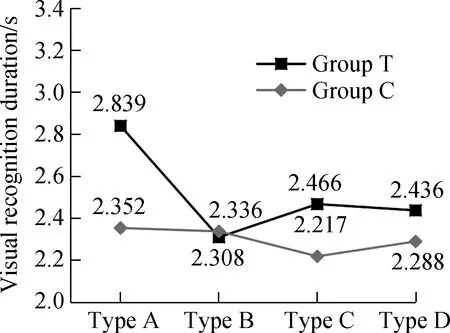
Fig.4 Visual recognition duration of Group T and Group C
As can be seen in Tab.6,for the variance homogeneity test of Group T,there was no significant difference in the fluctuation of visual recognition duration (p>0.05); that is,the premise requirement of homogeneity of variance was satisfied.Then,according to the results of one-way ANOVA,for Group T,the visual recognition duration of different types of guide signs showed significant differences (F=44.980,P<0.05),indicating that different types of guide signs had significant effects on the visual recognition duration of drivers.

Tab.6 One-way ANOVA of visual recognition duration

Descriptive statistics and a normal distribution test were applied to the visual recognition duration data of Group C,and the results are shown in Tab.5.The visual recognition duration of Group C showed the characteristics of a normal distribution (W=0.979,p=0.642>0.05).
As can be seen in Fig.4,for Group C,the visual recognition duration of the Type A guide signs was the largest,and that of the Type C guide signs was the smallest,but the overall difference between the four types of guide signs was small.According to the variance homogeneity test of Group C,there was no significant difference in the fluctuation of visual recognition duration (p>0.05),and statistical requirements were met.The one-way ANOVA was used to study the variance between different types of guide signs on the visual recognition duration of Group C,as shown in Tab.6.For Group C,different guide sign types showed no obvious difference in visual recognition duration (F=1.802,p=0.164>0.05).
2.3 Questionnaire survey
For Group T,the questionnaire focused on the readability and aesthetics of the guide signs,including whether participants could understand the meaning of signs and whether the signs’ design met their preferences.Participants rated it on a scale of 1 to 5 based on their simulated driving experience,with higher scores indicating better readability or aesthetics,as shown in Fig.5.

Fig.5 Questionnaire survey results of Group T
For readability,Type A,Type B,Type C,and Type D averaged 1.8,4.7,3.3 and 3.6,respectively.Of Group T,80% rated the Type A guide sign as the least readable,giving it a 1 or 2.100% of participants rated the Type B guide sign as the most readable,with 70% of them giving it a perfect score.The Type C and Type D guide signs were found to be less readable,with participants more likely to rate them as a 3 or 4,and the difference between them was not significant.As for aesthetics,the average scores for Type A,Type B,Type C,and Type D were 1.6,3.7,2.7,and 4.5,respectively.Participants generally believed that Type A had the worst aesthetics,and Type C guide signs were similar to Type A,only one point higher than Type A.Of Group T,100% rated the Type D guide sign as either a 4 or 5,indicating that Type D was superior aesthetically.
For Group C,the questionnaire mainly investigated whether Tibetan would affect Chinese readers’ recognition process.The results showed that none of Group C thought the Tibetan characters were intrusive,60% of the participants did not find the Tibetan characters changed in different experiments,and 20% of the participants even though the words above the Chinese characters were English.
As the rating of the questionnaire mainly considered the readability and aesthetics of the Tibetan characters in the guide signs,the rating subject was the Tibetan native language participants,while the Chinese native language participants mostly considered the influence of Tibetan on the recognition process,so the impact on the rating can be ignored.
3 Discussion
Pupil dilation was used to evaluate the difficulty of various cognitive tasks; larger pupil diameters are associated with more complex cognitive tasks.The process of drivers’ visual recognition of guide signs is the behavior of fixation,which is believed to be associated with cognitive processing[22].The longer the fixation duration is,the harder it is found to process information[23-24].Therefore,both pupil diameter and visual recognition duration can be used as parameters to characterize the visual recognition effect of guide signs,and they have the same trend of change,which is also consistent with the experimental results in this paper.
For Group C,neither the Tibetan character changes in height,nor the aspect ratio would affect Han participants’ visual recognition.As with the Chinese-English bilingual guide signs,as the test route in this paper was T-shaped intersections,the number of place names was only 3 and the sign form was relatively simple,so the Chinese place names could be displayed more prominently[8].In addition,the shape and structure of Chinese characters and Tibetan characters were significantly different,and the height of Tibetan characters was significantly smaller than that of Chinese characters,so participants whose mother tongue was Chinese could focus on reading Chinese characters without much interference from Tibetan.Drivers were found able to read one and two lines of monolingual signs and two lines of bilingual signs without affecting their driving behaviors[4,7].All the signs used in this study are two-line bilingual signs.According to the test,when the information in the layout of the guide signs is not dense,the form of Tibetan would not have a great impact on Han drivers,which is also consistent with the results of the previous research on Chinese-English bilingual signs.

A comprehensive analysis of Tibetan drivers’ subjective feedback on the setting of Tibetan in bilingual guide signs shows that changes in the height of Tibetan characters will have a significant impact on the difficulty of drivers’ visual recognition of signs,thus affecting the safety of highway driving,which is consistent with the conclusion obtained from the objective analysis of visual characteristics index.The influence of the aspect ratio form of Tibetan is mainly reflected in the Tibetan drivers’ overall aesthetic visual perception of the bilingual direction sign layout,which will have an impact on the comfort of the road driving experience.In addition,when the information on the setting of the guide signs is not dense,the form of Tibetan does not have a significant impact on Han drivers.

4 Conclusions
1) The height of Tibetan characters had a significant impact on the level of difficulty of visual recognition of guide signs for Tibetan participants,and increasing the height of Tibetan characters was found conducive to improving the visual recognition effect of guide signs.
2) The aspect ratio form of Tibetan had no significant effect on drivers’ visual recognition difficulty,but it would impact the aesthetics of bilingual guide signs.
3) Han drivers mainly took note of the Chinese characters on bilingual road signs,and the form of Tibetan character height and aspect ratio had no significant influence on their visual recognition of guide signs.
4) Considering the readability and aesthetics of the Tibetan-Chinese bilingual road signs,the Tibetan parameters with better effect are as follows: The height of Tibetan characters is 2/3 of the height of Chinese characters,and the aspect ratio is 1.5.
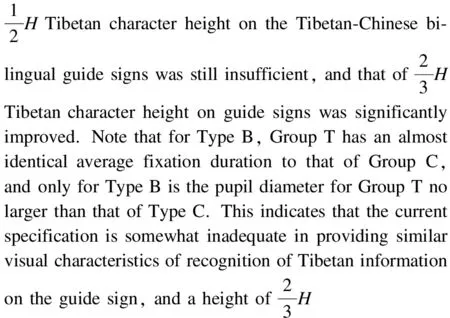
5) The current specifications for the layout of traffic signs are still insufficient in terms of the visual recognition effect of Tibetan-Chinese bilingual guide signs.Particularly,the character height for Tibetan should be increased to improve the visual recognition process for Tibetan drivers.The results can provide a theoretical basis for improving the layout and setting of Tibetan-Chinese bilingual guide signs and enhancing the effectiveness of guide signs in Tibet.
杂志排行
Journal of Southeast University(English Edition)的其它文章
- Vibration analysis of circular Janus MoSSe plates
- Effect of market integration on green economic growth: Evidence from 30 Chinese provinces
- Experimental study on the static load performance of steel-concrete composite external joints after fatigue loading
- Database-based error analysis of calculation methods for shear capacity of FRP-reinforced concrete beams without web reinforcement
- Improved complex modal superposition method with inclusion of overdamped modes
- A multilayer network model of the banking system and its evolution
