Database-based error analysis of calculation methods for shear capacity of FRP-reinforced concrete beams without web reinforcement
2023-12-05WangTaoFanXiangqianGaoChangshengQuChiyuLiuJueding
Wang Tao Fan Xiangqian,2 Gao Changsheng Qu Chiyu Liu Jueding
(1State Key Laboratory of Hydrology-Water Resources and Hydraulic Engineering,Nanjing Hydraulic Research Institute,Nanjing 210024,China)(2Cooperative Innovation Center for Water Safety and Hydro Science,Hohai University,Nanjing 210098,China)
Abstract:A comprehensive database consisting of 461 samples was established considering the shear capacity experimental data from the literature.The effects of six factors,namely the concrete compressive strength,beam width,effective depth,shear span-to-depth ratio,reinforcement ratio,and elastic modulus of fiber-reinforced polymer bars,on shear capacity were analyzed.Furthermore,the prediction performance of each calculation method was evaluated.The results revealed inconsistencies among the calculation methods regarding the consideration of the size effect and the shear span-to-depth ratio,with varying degrees of conservatism in their predictions.Strong correlations existed between the factors and the shear capacity.Among the design provisions recommended by different countries,CSA/CAN-S806-2012 exhibited the most accurate prediction,while ACI440.1R-2015 demonstrated the highest level of conservatism,and CNR-DT203-2006 exhibited the lowest safety margin.Regarding the calculation models proposed by scholars,Ahmed-2021 reported the most accurate prediction,Alam-2013 was the most conservative,and Mari-2014 exhibited the lowest safety level.
Key words:database; fiber-reinforced polymer(FRP) bars; concrete beams without web reinforcement; shearing capacity; calculation method; error analysis
Corrosion of steel bars leads to cracking and spalling of the concrete cover,resulting in a sharp decline in the durability of the structure.Consequently,this leads to high economic losses and even casualties[1-3].Fiber-reinforced polymer (FRP) bars,with their advantages of lightweight,high strength,and corrosion resistance,can fundamentally address the durability issue caused by the corrosion of steel bars in concrete structures[4-6].Therefore,the use of FRP bars as reinforcing bars in concrete structures has a wide range of applications in practical engineering[7-9].Currently,research on the flexural behavior of FRP-reinforced concrete beams is relatively mature,but the research on their shear performance is limited[10-12].
The shear capacity of beams with web reinforcement,as specified in widely used design provisions,is primarily composed of two components: concrete action and web reinforcement action[13-15].Therefore,it is crucial to study the shear capacity of FRP-reinforced concrete beams without web reinforcement as a basis for understanding the shear performance of concrete beams[16-18].The shear mechanism of FRP-reinforced concrete beams without web reinforcement is complex and consists of five main components: the shear strength of uncracked concrete in the compression zone,the dowel action of the longitudinal reinforcements,aggregate interlock,residual tensile stresses between the cracks,and arching action provided by struts and ties[19-21].Owing to the complexity of the shear problem,different design provisions and calculation models based on various theories have been proposed,resulting in variations in form and predictive accuracy[22-23].Most of these methods are semitheoretical and semiempirical formulas derived from the statistical analysis of data[24-26].In the case of complex research problems,a larger data sample of the research target provides a better reflection of its actual performance,reducing the margin of error in the statistical analysis[27-28].In recent years,there has been an increase in relevant test data for the shear performance of FRP-reinforced concrete beams without web reinforcement[29-30],which helps to address the scarcity of test data to a certain extent.Consequently,both domestic and international scholars have conducted numerous studies to develop a calculation method for the shear capacity of FRP-reinforced concrete beams without web reinforcement.These studies consider more comprehensive factors and strive for more accurate predictions by establishing a database with a relatively large sample size[31-34].
In this study,a database comprising of 461 sets of experimental data was established through the collection and organization of published literature from both domestic and international sources.This database serves as a foundation for the application of artificial intelligence-based prediction methods in the field of FRP-reinforced concrete beams.Through the correlation analysis method,this paper explores the relationship between various factors and shear capacity,thus validating the applicability of the multifactor analysis approach in FRP-reinforced concrete beams without web reinforcement.Considering the database,this research analyzes the errors associated with shear capacity calculation methods based on different design provisions and calculation models.Additionally,it elucidates the influence of size effect and shear span ratio on shear capacity.The findings of this study hold a certain reference value for further research on the calculation method for the shear capacity of FRP-reinforced concrete beams without web reinforcement.
1 Experimental Database
1.1 Database overview
A shear capacity database consisting of 461 samples was established by collecting and organizing shear test data from 47 published literature sources on FRP-reinforced concrete beams without web reinforcement.The following principles were followed during the specimen collection process:
1) The specimens were loaded under concentrated conditions.
2) The specimens featured equal rectangular cross sections.
3) The specimens were supported using a simple method.
4) The specimens exhibited shear failure.
5) The specimens were reinforced with FRP bars.
Fig.1 illustrates the distribution of different longitudinal bar types in the database,including 285 groups of GFRP specimens,128 groups of CFRP specimens,46 groups of BFRP specimens,and 2 groups of AFRP specimens.
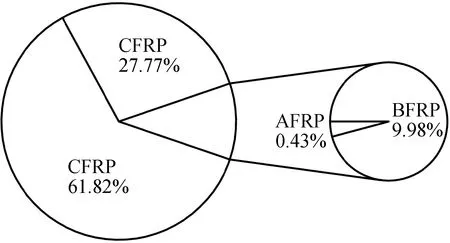
Fig.1 Proportions of specimens with different longitudinal reinforcement types
Tab.1 presents the factors influencing the shear capacity in the database,which mainly include the beam width,the effective depth of the beam,the shear span-to-depth ratio,the compressive strength of concrete,the elastic modulus of the FRP bar,and the reinforcement ratio of the FRP bars.Moreover,the table provides their minimum,maximum,and average values.

Tab.1 Database of shear capacity of FRP-reinforced concrete beams without web reinforcement
Furthermore,Fig.2 illustrates the specific distribution of the beam width,the effective depth,the shear span-to-depth ratio,the compressive strength of concrete,the elastic modulus of the FRP bar,and the reinforcement ratio of the FRP bars within the database.The following conclusions can be drawn from Fig.2:
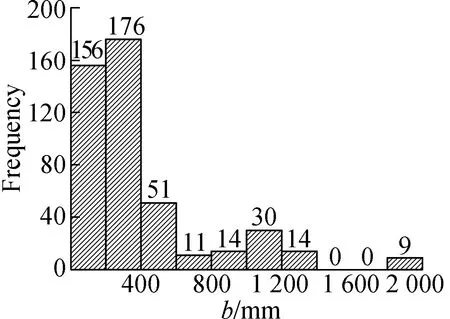
(a)
1) The data for the beam width in the database are mostly concentrated in the range of 100 to 400 mm.
2) The data for the effective depth of the beam in the database are mostly concentrated in the range of 100 to 300 mm.
3) There are relatively few samples with a shear span-to-depth ratio of less than 1 in the database (only three groups).
4) The compressive strengths of concrete samples in the database are mostly concentrated in the range of 30 to 50 MPa.
5) There are relatively few FRP bar samples in the database with an elastic modulus of 60 to 105 GPa.
6) The FRP reinforcement ratios of the samples are mostly concentrated in the range of 0.5% to 1.0%.
1.2 Parameter conversion principle in database
During data collection,certain conversions were applied when the original literature only provided the compressive strength of the concrete cube.The compressive strength is obtained as follows[34]:
f′c=0.85fcu
(1)
wherefcuis the compressive strength of the concrete cube,MPa.
When the elastic modulus of concrete is not provided in the original literature,it is derived as follows[31]:
(2)
whereEcis the elastic modulus of concrete,MPa.
When the tensile strength of concrete is not provided in the original literature,it is derived as follows[13]:
(3)
whereftis the tensile strength of concrete,MPa.
2 Calculation Method of Shear Capacity
2.1 Shear capacity calculating methods in codes
2.1.1 CSA/CAN-S806-2012
Existing research results have demonstrated that the shear capacity calculation method proposed in the CSA/CAN-S806-2012[35]design code considers the factors influencing shear capacity more comprehensively than other widely used design provisions and provides a more accurate prediction[32].The shear capacity calculation method provided by CSA/CAN-S806-2012 is shown as follows:
(4)

2.1.2 ACI440.1R-2015
The ACI440.1R-2015[81]calculation method for the shear capacity of FRP-reinforced concrete beams without web reinforcement considers the influence of the beam section size,compressive strength of concrete,elastic modulus of FRP bars,and reinforcement ratio of FRP bars.The shear capacity calculation method provided by ACI440.1R-2015 is expressed as follows:
(5)

2.1.3 JSCE-1997
The JSCE-1997[83]calculation method for the shear capacity of FRP-reinforced concrete beams without web reinforcement considers the influences of beam section size,the axial stiffness of FRP bars,size effect,the compressive strength of concrete,and the elastic modulus of steel bars.The shear capacity calculation method provided by JSCE-1997 is as follows:
Vc=βdβρfvcdbd
(6)


whereEsis the elastic modulus of the steel bar,MPa.
In Eq.(6),an upper limit value is set for the effect of the compressive strength of concrete,while the influence of the shear span-to-depth ratio is not considered.Additionally,the influence of the elastic modulus of the steel bar is considered.However,the shear resistance of plain concrete is neglected; consequently,the calculated shear capacity provided by Eq.(6) is 0 when the reinforcement ratio of FRP bars is 0.
2.1.4 AASHTO-LRFD-2017
The AASHTO-LRFD-2017[84]calculation method for the shear capacity of FRP-reinforced concrete beams without web reinforcement considers the influences of the beam section size,the FRP reinforcement ratio,the shear span-to-depth ratio,and the compressive strength of concrete.The shear capacity calculation method provided by AASHTO-LRFD-2017 is as follows:
(7)
whereAsis the total area of the FRP bar section,mm2.
According to Eq.(7),a linear correlation exists between the FRP reinforcement ratio and shear capacity.Furthermore,Eq.(7) establishes an upper limit value for shear capacity,addressing the problem of excessively high calculated shear capacity due to large FRP reinforcement ratios.However,the influence of the size effect on shear capacity is not considered in the equation.
2.1.5 CNR-DT203-2006
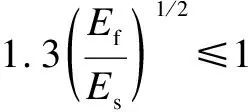
In CNR-DT203-2006[85],the calculation method for the shear capacity of FRP-reinforced concrete beams without web reinforcement considers the influences of the beam section size,the FRP reinforcement ratio,the elastic modulus of FRP bars,the size effect,and the tensile strength of concrete.The shear capacity calculation method provided by CNR-DT203-2006 is as follows:
(8)
τr=0.25ft

ρf≤0.02
According to Eq.(8),the influence of the shear span-to-depth ratio on the shear capacity is not considered in this calculation method.Additionally,the tensile strength of concrete is used as a parameter to reflect the relationship between concrete strength and shear capacity in Eq.(8),which is different from the aforementioned design provisions.Eq.(8) depicts a linear correlation between shear capacity and the reinforcement ratio of FRP bars; however,it also sets an upper limit for the reinforcement ratio to prevent excessive shear capacity due to large FRP reinforcement ratios.
2.1.6 BISE-1999
The BISE-1999[86]calculation method for the shear capacity of FRP-reinforced concrete beams without web reinforcement considers the influences of factors such as the beam section size,the compressive strength of concrete,the elastic modulus of FRP bar,the reinforcement ratio of FRP bars,and the size effect.The shear capacity calculation method provided by BISE-1999 is as follows:
(9)
The influence of the elastic modulus of the steel bar is also considered in Eq.(9),similar to the shear capacity calculation methods proposed in JSCE-1997 and CNR-DT203-2006.However,Eq.(9) does not consider the influence of the shear span-to-depth ratio on shear capacity or the shear resistance of plain concrete.
2.1.7 GB 50608—2020
The calculation method for the shear capacity of FRP-reinforced concrete beams without web reinforcement proposed in GB 50608—2020[87]is similar to that of ACI440.1R-2015.The main factors considered are the section size of the beam,the tensile strength of concrete,the elastic modulus of FRP bars,and the reinforcement ratio of FRP bars.The calculation method of shear capacity provided by GB 50608—2020 is as follows:
Vc=0.86ftbc
(10)
c=kfEd

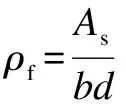

The mechanical properties of concrete are represented by its tensile strength in Eq.(10),similar to the shear capacity calculation method suggested in CNR-DT203-2006.However,Eq.(10) does not consider the impact of the shear span-to-depth ratio and the size effect in the calculation method.Furthermore,it does not address the issue of the calculated shear capacity being 0 when the reinforcement ratio of FRP bars is 0.
2.2 Modified shear capacity calculation methods
In recent years,the calculation methods for the shear capacity of FRP-reinforced concrete beams without web reinforcement have garnered significant attention from both domestic and foreign scholars.During the research process,scholars have addressed the limitations of shear capacity calculation methods proposed by various design provisions and have proposed alternative methods that offer more comprehensive considerations and more accurate predictions.
2.2.1 Ahmed-2021
The calculation method of shear capacity provided by Ahmed et al.[88]is shown depicted as follows:
(11)
2.2.2 Jumaa-2018
The calculation method of shear capacity provided by Jumaa et al.[25]is as follows:
(12)
2.2.3 Baghi-2018
The calculation method of shear capacity provided by Baghi et al.[89]is as follows:
(13)
2.2.4 Frosch-2017
The calculation method of shear capacity provided by Frosch et al.[90]is as follows:
(14)
2.2.5 Mari-2014
The calculation method of shear capacity provided by Mari et al.[91]is as follows:
(15)
2.2.6 Alam-2013
The calculation method of shear capacity provided by Alam et al.[92]is as follows:
(16)
2.2.7 Kara-2011
The calculation method of shear capacity provided by Kara[93]is as follows:
(17)
c0=7.696
c1=7.254
c2=7.718
Statistical analysis revealed that an inconsistency exists among the calculation methods of shear capacity proposed by design provisions from different countries and the models suggested by various scholars regarding the consideration of each influencing factor.The statistical results are presented in Tab.2.The variations in calculation methods primarily involve the inclusion of the shear span-to-depth ratio and the size effect as influencing factors.
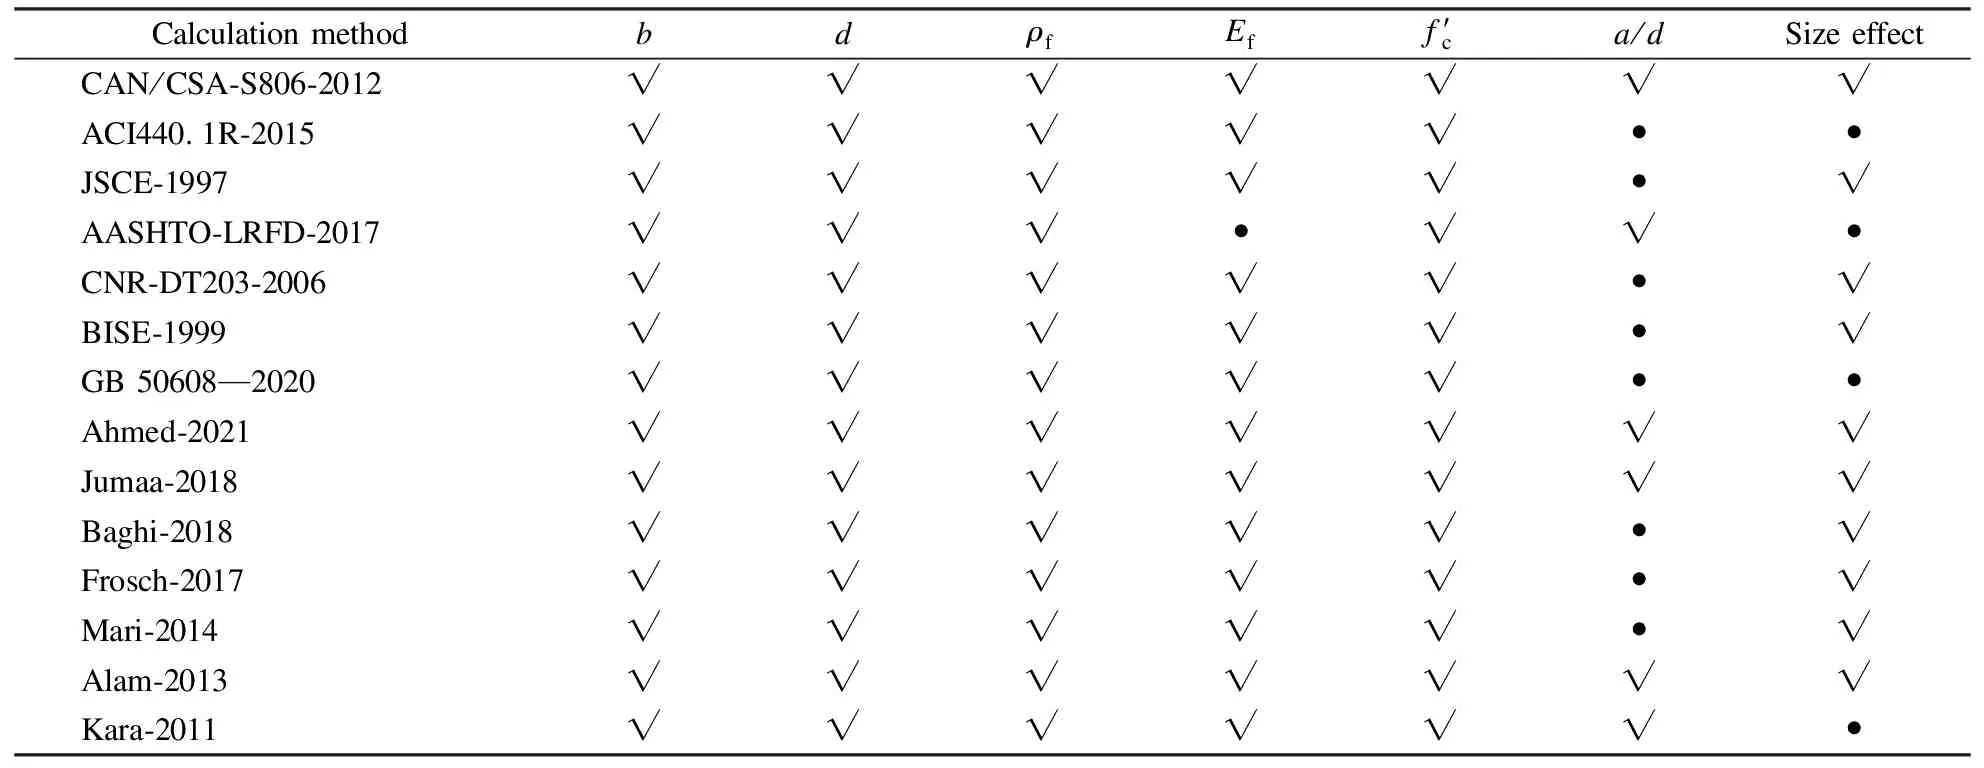
Tab.2 Factors considered in the existing calculation methods
3 Analysis of Factors Based on the Database
3.1 Analysis of calculation coefficients
To further examine the extent to which the shear span-to-depth ratio and the size effect are considered in each calculation method,the calculation coefficients for the shear span-to-depth ratio and the size effect are plotted in Fig.3 and Fig.4,respectively.

Fig.3 Shear span-to-depth ratio for different formulas
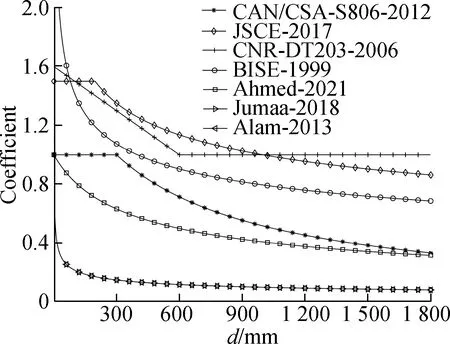
Fig.4 Size effect for different formulas
Fig.3 displays the relationships between the shear span-to-depth ratio and its calculation coefficient in various calculation methods: CSA/CAN-S806-2012,AASHTO-LRFD-2017,Ahmed-2021,Jumaa-2018,Alam-2013,and Kara-2011.The contribution of the shear span-to-depth ratio to shear capacity is considerably greater in CSA/CAN-S806-2012 than in the other calculation methods.Furthermore,each method shows insensitivity to shear span-to-depth ratios greater than 2.5 and exhibits substantial variation for ratios less than 1.
Fig.4 illustrates the relationships between the size effect and its calculation coefficient in different calculation methods,including CSA/CAN-S806-2012,JSCE-1997,CNR-DT203-2006,BISE-1999,Ahmed-2021,Jumaa-2018,and Alam-2013.As observed in Fig.4,CSA/CAN-S806-2012 indicates no size effect for specimens with an effective depth of beam less than 300 mm,while CNR-DT203-2006 suggests no size effect for specimens with an effective beam depth of more them 600 mm.Remarkably,Jumaa-2018 and Alam-2013 feature similar considerations regarding the size effect.
3.2 Correlation analysis
To comprehensively analyze the relationship between each factor and shear capacity in the database,correlation analysis was conducted using Pearson distribution,Spearman distribution,and Kendall distribution.The results are represented in the heat map illustrated in Fig.5.The correlation coefficient ranges from-1 to 1,where values closer to 1 indicate a stronger positive correlation,values closer to-1 indicate a stronger negative correlation,and values closer to 0 indicate a weaker correlation.

(a)
As shown in Fig.5,all factors exhibit varying degrees of correlation with shear capacity.A strong positive correlation exists between section size and shear capacity.The correlation index between the normalized section size and the normalized shear capacity approaches 0,indicating that the normalization method employed in this study is effective.Additionally,a significant negative correlation exists between the shear span ratio and shear capacity,and this negative correlation is further amplified after normalization.These results demonstrate that the correlation analysis method employed is effective in elucidating the relationships between multiple factors and target parameters.
4 Error Analyses of Calculation Methods
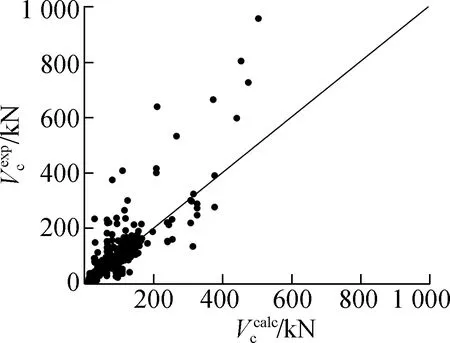
The trends of the test values and calculated values for shear capacity are illustrated in Fig.6,with the test values plotted on the ordinate and the calculated values on the abscissa.Data points above the 45° line correspond to conservative calculated results.Conversely,data points below the 45° line correspond to over-estimations of the calculated results of the shear capacity of the beam,potentially leading to an unsafe structure.
(a)
Fig.6 reveals that the predictions of ACI 440.1R-2015 in various design standards tend to overestimate the shear capacity,suggesting the need for significant reconsideration and revision of the shear capacity evaluation approach.A similar phenomenon is observed in the calculation method proposed by Frosch-2017.This discrepancy is attributable to the fact that the method was originally developed for long shallow beams and may not accurately capture the behavior of typical deep beams,including arching action.This complex behavior is usually converted into an equivalent system of compression and tension rods by more advanced methods,such as compression and tension rod models.
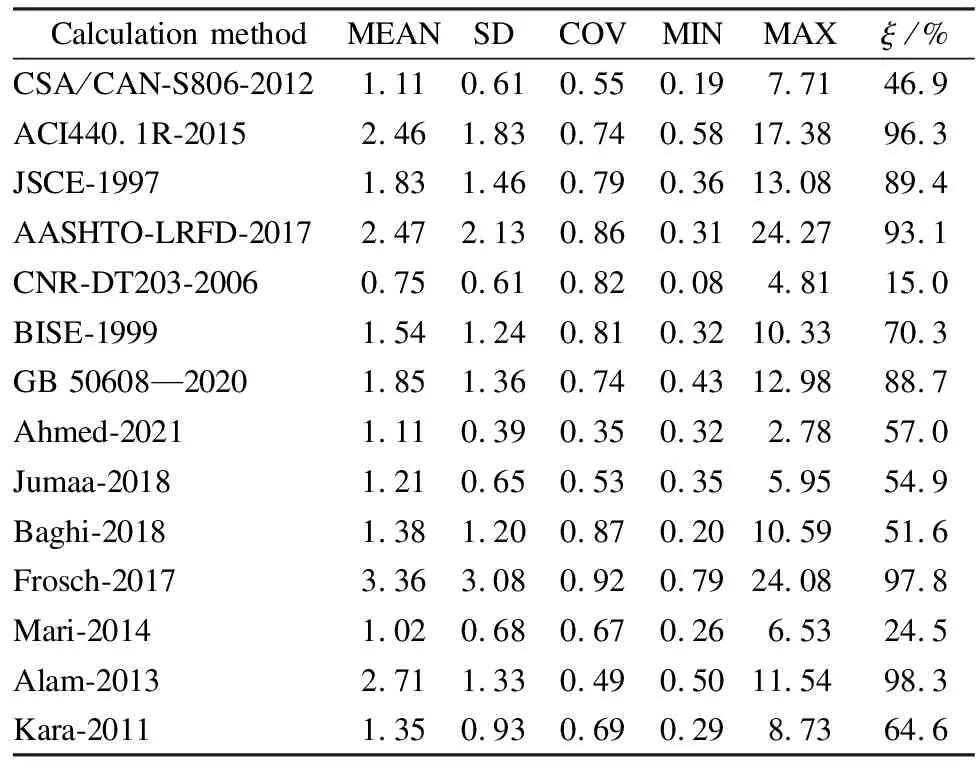
To further evaluate the prediction accuracy of each calculation method,an error analysis is performed by calculating the ratio of the calculated value to the test value.The analysis includes calculating the mean (MEAN),standard deviation (SD),coefficient of variation (COV),minimum (MIN),and maximum (MAX) values.A MEAN value close to 1 indicates higher prediction accuracy,and smaller values of SD and COV indicate better prediction effects of the calculation method.Additionally,the proportion of data points where the test value exceeds the calculated value is considered as the conservative valueξ.The statistical results are presented in Tab.3.
Tab.3 Statistical parameters
According to the findings from Fig.6 and Tab.3,the CSA/CAN-S806-2012 design provision demonstrates higher prediction accuracy,with a MEAN value of 1.11,an SD value of 0.61,and a COV value of 0.55.Among the design provisions of various countries,ACI440.1R-2015,JSCE-1997,AASHTO-LRFD-2017,BISE-1999,and GB 50608—2020 exhibit more conservative predictions,with conservative proportions exceeding 70%.Specifically,ACI440.1R-2015 exhibits a remarkably high conservative proportion of 96.3%.The prediction effect of the CNR-DT203-2006 design provision tends to be unreliable,with a conservative rate of only 15.0%.Among the calculation models proposed by various scholars,Ahmed-2021 demonstrates the best prediction accuracy for shear capacity,with a MEAN value of 1.11,an SD value of 0.39,and a COV value of 0.35.Frosch-2017 and Alam-2013 exhibit more conservative prediction effects among the calculation models proposed by scholars,with conservative proportions exceeding 90%.Notably,Alam-2013 exhibits an exceptionally high conservative proportion of 98.3%.The prediction result of Mari-2014 tends to be unreliable,with a conservative rate of only 24.5%.
5 Conclusions
1) A comprehensive database is established according to experimental data from the literature.The database features a large sample size and encompasses a wide range of factors,making it suitable for studying the shear performance of FRP-reinforced concrete beams without web reinforcement.
2) The calculation methods based on different design provisions and calculation models vary in their considered factors.Furthermore,some methods do not consider the influence of the shear span-to-depth ratio and the size effect on the shear capacity.The analysis of calculation coefficients reveals that the shear span-to-depth ratio significantly influences the shear capacity in CSA/CAN-S806-2012.Additionally,the analysis of the size effect calculation coefficients shows that Jumaa-2018 and Alam-2013 attribute less significance to the size effect.
3) The correlation analysis based on Pearson distribution,Superman distribution,and Kendall distribution demonstrates that certain correlations exist between the factors and the shear capacity in the database.Notably,the strongest positive correlation exists between the effective depth of the beam and the shear capacity,while the strongest negative correlation exists between the shear span-to-depth ratio and the shear capacity.
4) The design provisions proposed by different countries and the calculation models proposed by various scholars exhibit varying levels of conservatism in predicting shear capacity.Moreover,among the various design provisions,CSA/CAN-S806-2012 demonstrates the most accurate prediction,ACI440.1R-2015 is the most conservative,and CNR-DT203-2006 shows the lowest safety level.Among the calculation models proposed by scholars,Ahmed-2021 achieves the most accurate predictions,Alam-2013 is the most conservative,and Mari-2014 exhibits the lowest safety level.
杂志排行
Journal of Southeast University(English Edition)的其它文章
- Vibration analysis of circular Janus MoSSe plates
- Effect of market integration on green economic growth: Evidence from 30 Chinese provinces
- Experimental study on the static load performance of steel-concrete composite external joints after fatigue loading
- Improved complex modal superposition method with inclusion of overdamped modes
- A multilayer network model of the banking system and its evolution
- Influence of consumer information investment on supply chain advertising and pricing strategies
