A super wear-resistant coating for Mg alloys achieved by plasma electrolytic oxidation and discontinuous deposition
2023-11-18XixiDonMinxuXiaFnWanHailinYanGanJiNybrShouxunJi
Xixi Don, Minxu Xia, Fn Wan, Hailin Yan, Gan Ji, E.A. Nybr, Shouxun Ji
a College of Mechanical and Electrical Engineering, Nanjing University of Aeronautics and Astronautics, Nanjing 210016, China
b Brunel Centre for Advanced Solidification Technology (BCAST), Brunel University London, Uxbridge UB8 3PH, UK
c School of Materials Science and Engineering, Shanghai Jiao Tong University, Shanghai 200240, China
d School of Metallurgy and Materials, University of Birmingham, Birmingham B15 2TT, UK
eState Key Laboratory of Powder Metallurgy, Central South University, Changsha 410083, China
fUniv. Lille, CNRS, INRAE, Centrale Lille, UMR 8207 - UMET - Unité Matériaux et Transformations, F-59000 Lille, France
gKaiser Aluminum, Spokane Valley, WA 99216, USA
Received 4 June 2023; received in revised form 21 July 2023; accepted 9 August 2023
Available online 30 August 2023
Abstract Magnesium alloys are lightweight materials with great potential, and plasma electrolytic oxidation (PEO) is effective surface treatment for necessary improvement of corrosion resistance of magnesium alloys. However, the ∼14 μm thick and rough PEO protection layer has inferior wear resistance, which limits magnesium alloys as sliding or reciprocating parts, where magnesium alloys have special advantages by their inherent damping and denoising properties and attractive light-weighting. Here a novel super wear-resistant coating for magnesium alloys was achieved, via the discontinuous sealing (DCS) of a 1.3 μm thick polytetrafluoroethylene (PTFE) polymer layer with an initial area fraction (Af) of 70% on the necessary PEO protection layer by selective spraying, and the wear resistance was exceptionally enhanced by∼5500 times in comparison with the base PEO coating. The initial surface roughness (Sa) under PEO+DCS (1.54 μm) was imperfectly 59%higher than that under PEO and conventional continuous sealing (CS). Interestingly, DCS was surprisingly 20 times superior for enhancing wear resistance in contrast to CS. DCS induced nano-cracks that splitted DCS layer into multilayer nano-blocks, and DCS also provided extra space for the movement of nano-blocks, which resulted in rolling friction and nano lubrication. Further, DCS promoted mixed wear of the PTFE polymer layer and the PEO coating, and the PTFE layer (HV: 6 Kg·mm-2, Af: 92.2%) and the PEO coating (HV: 310 Kg·mm-2, Af:7.8%) served as the soft matrix and the hard point, respectively. Moreover, the dynamic decrease of Sa by 29% during wear also contributed to the super wear resistance. The strategy of depositing a low-frictional discontinuous layer on a rough and hard layer or matrix also opens a window for achieving super wear-resistant coatings in other materials.
Keywords: Magnesium alloy; Coating; Plasma electrolytic oxidation; Discontinuous deposition; Wear resistance; Mechanism.
1. Introduction
Magnesium (Mg) alloys are important lightweight metallic materials (ρ∼1.4–1.9 g·cm-3) [1–5] offering significant potential in aerospace [6], automobile [7], power tools [8],electronics [9], and biomedical [10,11] applications. Inferior corrosion resistance is one of the main concerns of Mg alloys, due to the low standard electrode potential (-2.37 V)of Mg [12–15]. Various surface-treating processes were tried for the necessary improvement of the corrosion resistance of Mg alloys: PEO treatment [16–20], chemical reaction coating[21], laser processing [22], physical vapour deposition (PVD)[23], spray [24], electroplating or electroless plating [25] and ion implantation [26]. PEO is an anodization process consisting of growing a thin ceramic oxide layer on the surface of light magnesium, aluminium or titanium alloys, and it is very attractive and effective among all the processes for enhancing corrosion resistance of Mg alloys, considering its simplicity[17–19]. However, the PEO process inevitably generates a porous and rough [18] layer with poor wear resistance [27].Therefore, Mg alloys are hardly used as sliding or reciprocating parts in industries, where Mg alloys have special advantages due to their inherent damping and denoising properties and attractive light-weighting [28].
Various post-treatments have been proposed to further improve the corrosion [29–36] and/or wear [37–54] resistance of the PEO protection layer on Mg alloys, through the deposition of another thin layer on top of the PEO layer, for sealing the pores and reducing the surface roughness of the PEO layer. Polytetrafluoroethylene (PTFE) polymer is an excellent antifriction material that can work at a wide temperature range of -200–300 °C, and it is also chemically inert and electrically insulating [44]. Therefore, PTFE is a promising sealing material of the PEO layer for enhancing corrosion and/or wear-resistant properties [45]. In recent years, there have been good studies on the deposition of the PTFE polymer on the PEO layer to form the corrosion and/or wearresistant composite coatings [38,46–54]. The method of depositing the PTFE polymer has a key impact on the performance of the composite coating [47]. Various methods including electrophoresis [46], immersion [47–51] and spraying [52–54] were investigated. It was found that the in-situ introduction of the PTFE polymer during the PEO process might be non-ideal, as the high temperature plasma could destroy the PTFE polymer [55–58]. The post introduction of the PTFE polymer after PEO via immersion or spraying was found effective [47–54], and the wear-resistant sliding distance of the composite coating can be enhanced by 3.6–518 folds in comparison with the base PEO coating [44–54].In most of these reports, a super-dispersed PTFE suspension such as Forum® was applied, and the isopropanol was normally acted as the dispersion medium [46–54]. The solvents such as ethyl acetate, pentafluorochlorobenzene and trifluorotrichlorethane (Freon 113) were also studied as the dispersed medium of the PTFE polymer, among which the prepared composite coatings can provide better wear resistance under the solvent of Freon 113 [49]. Most recently, different from the isopropanol suspension of superdispersed polytetrafluoroethylene (SPTFE) with the trademark “Forum®”,an alcohol-free aqueous suspension of SPTFE was developed with 20 wt.% SPTFE powders ranging in size from 300 to 600 nm, which is more friendly for health, safety and environment [47]. In addition, in some studies, a remelting heat treatment at 300–340 °C for 15–30 min was applied after each deposition of the PTFE polymer to enhance the filling of the PTFE polymer into the porous PEO layer [48,49,53].However, previous post-treatments [29–54] were dominated by the deposition of a continuous sealing (CS) layer on the PEO layer. Seldom was attention paid to the discontinuous sealing (DCS) of the porous and rough PEO layer, as it might be easily thought worse than CS by the higher obtaining surface roughness, for the improvement of wear resistance. The preparation of the base PEO layer, the post sealing material of PTFE polymer and the preparation of the super-dispersed PTFE suspension have been well studied, and these are not the focus of this work. The novelty of this work is the introduction of the new post-treatment technique of depositing DCS nano PTFE polymer via selective spraying to significantly enhance the wear resistance of the base PEO layer.
In this work, a super wear resistant coating for Mg alloys was achieved, via the novel strategy of DCS a thin lowfrictional PTFE layer on the necessary PEO protection layer of Mg alloys, and evidence was provided that the deposition of the DCS layer can be surprisingly much superior to the deposition of a conventional CS layer, for enhancing wear resistance, though the initial coating roughness under PEO+DCS was much higher than that under conventional PEO+CS.New insights into the underlying wear-resistant mechanisms of the PEO+DCS coating were proposed by deep microstructure,hardness, wear track and statistical analysis.
2. Experimental
2.1. Preparation of base PEO coating
AE44 Mg alloy with the composition of 4 wt.%Al,4 wt.%(La+Ce), 0.35 wt.%Mn, 0.2 wt.%Zn and balanced Mg was used as the matrix alloy for the deposition of PEO coatings. In advance of the PEO process, all the Mg alloy samples were prepared in three stages: (1) machined into theΦ30 mm × 5 mm discs with the surface polished by 2500# SiC sand paper and drilled with a threaded hole with a diameter of 3 mm at the edge of the discs, (2) degreased in an alkaline solution containing 4 g·L-1Na3PO4and 1.5 g·L-1NaOH at 50 °C for 12 min, and (3) cleaned with ethanol under an ultrasonic bath for 6 min and dried with an electric hot air blower. PEO layers were coated on the surface of the prepared Mg alloy discs in an alkaline electrolyte solution containing 10 g·L-1Na3PO4·12H2O and 1 g·L-1KOH in distilled water. The PEO process was conducted in a twoelectrode unit with the prepared Mg alloy discs as anode and the stainless steel as cathode plus stirring. A Sorensen SGI series power supply was used to provide direct current (DC)during PEO. The Mg alloy discs were connected to the positive pole of the power source via the threaded hole at the edge of the discs. During PEO, the current density was controlled at 20 mA·cm-2by the DC power source, and the duty cycle of the DC pulse was set to 10% withton:toff=2 ms:18 ms.The temperature of the electrolyte solution was maintained at 36±2 °C by a ChillerSmart H150–3000 cooling unit that was made by LabTech Group in UK. The PEO process was sustained up to 12 min, and the PEO coatings with a thickness of ∼14 μm were achieved. All the prepared PEO samples were cleaned with ethanol and dried with an electric hot air blower.
2.2. Post-treatments of PEO coating
The prepared PEO coatings were subjected to three different post sealing process:(1)no sealing,(2)sealed with continuous sealing layer, (3) sealed with discontinuous sealing layer with an overall sealing ratio of 70%. PTFE polymer was used as the sealing material. An aqueous super-dispersed suspension of nano PTFE (3 M Dyneon PTFE TF 5070GZ, USA)was applied,which comprised 54%PTFE,40%deionized water and 6% polyether polymer (in wt.%), and the mean size of the PTFE particles was ∼120 nm. The SEM morphology of the original product of PTFE is provided in Supplementary Fig. S1. The continuous sealing process was conducted through immersing the PEO discs into the super-dispersed PTFE TF 5070GZ suspension. A RDC-21k equipment made by Bungard/Germany was used to control the immersion process. The immersion was conducted at a speed of 1 mm·s-1to a depth of 80 mm, and the holding time in the suspension was 10 min, while the withdrawal speed was 5 mm·s-1.The discontinuous sealing process was carried out through the selective spray of the super-dispersed PTFE TF 5070GZ suspension onto the PEO layer. A computer-controlled IRB 5500-FlexPainter manipulator (ABB, Sweden) was applied to realize the selective spray. The size of the spray nozzle was 0.5 mm, and the distance between the spray nozzle and Mg alloy discs coated with PEO layers was 5 mm.The spray pressure was 0.2 MPa. The intermittent spray at isolated points was applied rather than continuous moving spray. The distance between two adjacent spray points was 3 mm, and the spray time was 2 s at each spray point.Subsequently,both the continuous and discontinuous sealing PTFE layers were dried horizontally at 75 °C for 16 min in a LHT furnace (Carbolite Gero, Germany) with circulated air for temperature homogenization.
2.3. Surface roughness and hardness tests
The initial surface roughness of the coatings was measured using the InfiniteFocus optical 3D surface measurement system made by Bruker Alicona in Austria. Following the standard of ISO 4287 and 4288, the rectangle area of 1 mm × 4 mm was measured to give the 3D morphology and roughness of the surfaces of the three kinds of designed coatings. The surface roughness profile along the 4 mm measurement path length was collected to give the mean surface roughness of the coatings. Vickers microhardness was conducted on a FM-800 tester with an applied load of 10 g for the PEO layer and the CS layer, and the dwelling time during hardness test was 10 s.
2.4. Pin-on-Disc wear test
The wear tests of the coatings were conducted on the Pinon-Disc wear tester made by Teer Coatings Ltd. in UK. TheΦ30 mm × 5 mm Mg alloy discs coated with the three kinds of designed coatings were used for the wear tests. The wear tester rotated the flat Mg alloy discs under the loaded wear pin. The standard 5 mm diameter ball made of chrome steel AISI52100 was applied as the wear pin.During wear tests,the line speed of wear was ∼0.5 m·s-1with the track diameter of 12 mm and the rotation speed of 800 rpm, and the normal load of 5 N was applied. The real-time coefficient of friction was recorded during all wear tests.
2.5. Microstructure characterization
The microstructure of the coatings was characterized using the Zeiss SUPRA 35VP scanning electron microscopy(SEM) equipped with energy dispersive spectroscopy (EDS).The coatings for surface analysis were characterized under SEM without polish. The coatings for cross-section analysis were mounted by resin and mechanically polished before SEM characterization. SEM analysis was performed at a voltage of 20 kV, and secondary electrons were applied for morphology observation, while EDS was used for the mapping of element distribution. X-ray diffraction (XRD) analysis of the coatings was performed on a D8 X–ray diffractometer in the 2 Theta range from 15° to 85°
2.6. Statistics
The pixel images of the SEM-EDS mapping of element P were used for the statistics of the area fraction of the PEO and DCS layers before wear and after wear. The width and height of the SEM-EDS images were 1890 pixel and 1328 pixel,respectively, and the total pixel of one SEM-EDS image was 2,509,920. Three SEM-EDS images were counted to give the statistical area fraction.
3. Results and discussion
3.1. Pin-on-Disc wear test results
Figs. 1a–c present the schematic diagrams showing the cross-section of the coatings fabricated by PEO, PEO+CS and PEO+DCS,sequentially.Figs.1d–f show the Pin-on-Disc wear test curves of the coatings prepared by PEO, PEO+CS and PEO+DCS. The friction coefficient of the PEO coating increases sharply and reaches a high level of ∼1.2 after only 20 m of sliding distance, and the friction coefficient of the PEO+CS coating raises gradually to the sliding distance of 5500 m, while the friction coefficient of the PEO+DCS coating increases slowly to a low level of less than 0.2 after a long sliding distance of ∼100,000 m. Figs. 1g and h display the wear tracks on the surfaces of the PEO and PEO+CS coatings at the sliding distances of 20 m and 5500 m, respectively, and Fig. 1i shows the wear track on the surface of the PEO+DCS coating at the sliding distance of 110,000 m. The PEO coating is fully worn off after a sliding distance of 20 m, and the PEO+CS coating is partially worn off after a sliding distance of 5500 m, while the PEO+DCS coating just starts to wear off at localized points after a sliding distance of 110,000 m.For the PEO coating, the friction coefficient of more than 1 can be related to the complex and rough triple interfaces between the wear pin, PEO coating and Mg matrix by the end of the failure of the coating. For clarity, the wear resistant distance of the PEO, PEO+CS and PEO+DCS coatings are listed in Table 1, and the wear resistant distance was determined by the change in friction coefficient in combination with the visual inspection of the wear track. The wear resistant distance of the PEO+CS coating is ∼275 times greater than that of the PEO coating,while the wear resistant distance of the PEO+DCS coating is surprisingly at least 20 times superior to that of the PEO+CS coating, though the initial surface roughness of the PEO+DCS coating is much higher than that of the PEO+CS coating. In addition, the wear rates of the PEO, PEO+CS and PEO+DCS coatings were calculated as 7.75 × 10⁻⁴, 9.41 × 10⁻⁷and 6.63 × 10⁻⁹mm3·(N·m)-1,respectively.
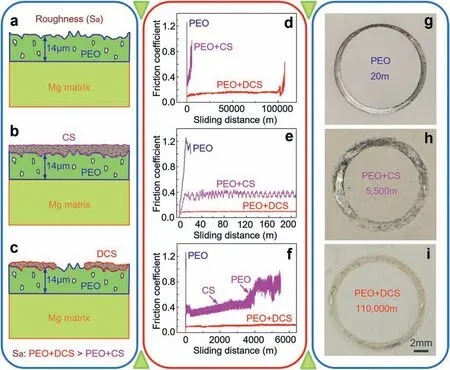
Fig. 1. Pin-on-Disc wear test results of the coatings prepared by PEO, PEO+CS and PEO+DCS. (a–c) Schematic diagrams showing the cross-section of the coatings fabricated by (a) PEO, (b) PEO+CS and (c) PEO+DCS. (d) Evolution of the friction coefficient of PEO, PEO+CS and PEO+DCS coatings versus sliding distance. (e) Expanded view of the early stage of the wear test curves in (d) after a sliding distance of ∼200 m. (f) expanded view of the wear test curve of the PEO+CS coating in (d). (g–i) Optical micrographs showing the wear tracks on the surfaces of (g) PEO coating, (h) PEO+CS coating and (i)PEO+DCS coating after the sliding distances of 20 m, 5500 m and 110,000 m, respectively.

Fig. 2. Comparison of the wear resistance of the present PEO+DCS coating with the various reported[27,37–43]post-treated PEO coatings for Mg alloys.The graph shows the measured coefficient of friction versus sliding distance during Pin-on-Disc wear tests.
The antifriction sliding distance of the present PEO+DCS coating was enhanced by ∼5500 times in comparison with the base PEO coating, while previous studies achieved an enhancement of the antifriction sliding distance by ∼50 times under the same Pin-on-Disc wear test parameters [27,37–43](see Fig. 2) and ∼3.6–518 times [44–54] under the other Pin-on-Disc wear test parameters in comparison with the base PEO coating. Therefore, PEO+DCS can be one effective wayto offer super wear resistant coating for Mg alloys (Figs. 1 and 2).

Table 1 Wear resistant distance (La) of the prepared PEO, PEO+CS and PEO+DCS coatings under the designed Pin-on-Disc wear test condition in this work.

Fig. 3. High resolution SEM images showing the surface microstructure of the coatings fabricated by PEO, PEO+CS and PEO+DCS. (a) Surface SEM morphology of the PEO coating. (b) Surface SEM morphology of the PEO+CS coating, i.e., surface SEM morphology of the upper CS layer. (c)Surface SEM morphology of the PEO+DCS coating. (d) Enlarged view of the DCS layer in (c), and numerous nano cracks present in the DCS layer,which split the matrix of DCS layer into numerous nano blocks.
3.2. Surface microstructure
Fig. 3a–c displays the high-resolution surface SEM morphology of the coatings fabricated by PEO, PEO+CS and PEO+DCS, sequentially. Gas pores are inevitably generated in the PEO coating (Fig. 3a), and this is determined by the PEO process. The PEO layer is fully sealed under CS treatment (Fig. 3b), and the surface of the PEO+CS coating is the surface of the CS layer. Micron-scale cracks are present in the CS layer of the PEO+CS coating by lower magnification observation, as shown in Fig. 4b. The PEO layer is partially sealed under DCS treatment (Fig. 3c), and numerous nanoscale cracks are uniformly distributed in the DCS layer (Fig. 3d), which split the matrix of the DCS layer into numerous nanoscale blocks. Comparing with CS, the disappearance of the large micron-scale cracks in the DCS layer can be attributed to the relief of the shrinkage stress under discontinuous DCS islands.
Fig. 4 shows the EDS mapping of element distribution on the surfaces of the coatings fabricated by PEO, PEO+CS and PEO+DCS. Figs. 4a–c present the SEM images showing the surface mapping areas of the PEO coating, the PEO+CS coating and the PEO+DCS coating, sequentially. Fig. 4d displays the surface EDS mapping results of the PEO coatingshown in Fig. 4a, and the PEO layer is composed of Mg,O and P. Fig. 4e shows the surface EDS mapping results of the PEO+CS coating shown in Fig. 4b, i.e., the surface EDS mapping of the CS layer, and the CS layer contains C and F. Fig. 4f presents the surface EDS mapping results of the PEO+DCS coating shown in Fig. 4c, and C and F were also found in the DCS layer, as the CS layer and the DCS layer are same low-frictional material of PTFE.

Table 2 Mean thickness of the prepared PEO, CS and DCS layers.
3.3. Cross-section microstructure
According to reference [59], the background science that governs the micro-growth of the PEO coating can be expressed by the following equation:
WhereCiis concentration,tis time,Diis diffusion coefficient,Ziis charge number of ionic species,F0is Faraday constant,Rgis universal gas constant,Tis temperature,ϕiis electric potential, u is fluid flow vector, andRiis chemical reaction rate. In this work, the thickness of the base PEO coating was controlled by the PEO reaction time following the logic of Eq. (1), and a ∼14 μm thick PEO coating was precisely prepared by controlling the PEO reaction time at 12 min. Fig. 5a shows the cross-section morphology of the∼14 μm thick base coating fabricated by PEO.
Fig. 5b shows the EDS mapping of the PEO coating in Fig. 5a, which also shows that the PEO coating comprises Mg, O and P. Fig. 5c depicts the cross-section morphology of the PEO+CS coating, and the PEO layer is completely covered by the CS layer that has a mean thickness of∼3.7 μm. Fig. 5e displays the cross-section morphology of the PEO+DCS coating, and the PEO layer is partially covered by the very thin DCS layer that has a mean thickness of 1.3 μm. For clarity, the mean thickness of the prepared PEO,CS and DCS layers are listed in Table 2. Fig. 5d shows the EDS element mapping of the PEO+CS coating in Fig. 5c,and 5f presents the EDS mapping of the PEO+DCS coating in Fig. 5e, which also demonstrate that both the CS and DCS layers contain C and F. Penetrating cracks were observed in the PEO layer in Fig.5a and the CS layer in Fig.5c,however,cracks barely penetrate the cross-section of the PEO layers and the CS layer, as shown in Fig. S2 in the supplementary material. The penetrating cracks observed in the cross-section of the PEO layers and the CS layer can be caused by the grinding and polishing of the mounted cross-section samples.PEO was a violent reaction, and the distribution of pores in the PEO coating can be different in different local areas even in one sample. Fig. 5c looks less porous than Figs. 5a and e because this image was taken from a less porous local area,and porous areas can be found in other areas of the sample,as shown in Supplementary Fig. S2c and d.

Fig. 4. EDS mapping of element distribution on the surfaces of the coatings fabricated by PEO, PEO+CS and PEO+DCS. (a–c) SEM images showing the surface mapping areas of (a) PEO coating, (b) PEO+CS coating and (c) PEO+DCS coating. (d) Mapping of the PEO coating in (a). (e) Mapping of the PEO+CS coating in (b). (f) Mapping of the PEO+DCS coating in (c).
3.4. XRD analysis results
Fig. 6 presents the XRD results of the coatings prepared by PEO,PEO+CS and PEO+DCS.The PEO coating consists of the MgO and Mg3(PO4)2phases (Supplementary Fig. S3),which were formed by the following reactions [59,60]:
The extra diffraction peak of the polytetrafluoroethylene((CF2)n) phase was observed at the 2-Theta degree of 18.1°for the PEO+CS and PEO+DCS coatings, which shows that both the CS and DCS layers comprise the low-frictional PTFE phase (Supplementary Fig. S3). The XRD results are consistent with the EDS mapping results shown in Figs. 4 and 5.
3.5. Microhardness
The Vickers hardness (HV, Kg·mm-2) of the PEO layer and the CS layer were determined by measuring the diagonal length of the hardness indentation:
WhereFis the test load, andDis the average diagonal length of the hardness indentation. The Vickers hardness of the PEO layer and the CS layer was measured as 310 ± 18 Kg·mm-2and 6 ± 1 Kg·mm-2, respectively. The hardness of the DCS layer is difficult to be measured as very thin, however, its hardness should be the same as that of the CS layer because these two layers are same material. Thus,the PEO layer is much harder than the CS and DCS layers. The PEO coatings are mainly fabricated in the silicatebased or phosphate-based electrolyte[40,59,60],and the Vickers hardness of the silicate-based PEO coating (520–1660 HV) [37,61] is generally higher than that of the phosphatebased PEO coating (181–560 HV) [37,62], as the microhardness of the Mg2SiO4phase is higher than that of the Mg3(PO4)2phase [63–65]. The hardness of the PEO coating depends on the composition of the electrolyte and the deposition time [40,61–65], and the Vickers hardness of the present phosphate-based PEO coating is similar to some of the reported (231 HV [40], 300 HV [66], 351 HV [62]) phosphatebased PEO coating.

Fig. 5. Cross-section SEM morphology and EDS mapping of coatings prepared by PEO, PEO+CS and PEO+DCS. (a) Morphology and (b) mapping of PEO coating. (c) Morphology and (d) mapping of PEO+CS coating. (e) Morphology and (f) mapping of PEO+DCS coating.

Fig. 6. X-ray diffraction analysis results of the coatings prepared by PEO,PEO+CS and PEO+DCS. The PEO layer consists of the MgO and Mg3(PO4)2 phases, while both the CS and DCS layers comprise the lowfrictional polytetrafluoroethylene ((CF2)n) phase.
3.6. Surface roughness
Figs. 7a and b depict the 3D surface morphology and the surface roughness profile of the PEO coating, respectively,and the mean surface roughness (Sa) of the PEO coating is determined as 2.01 μm by the arithmetical mean deviation of the assessed profile:
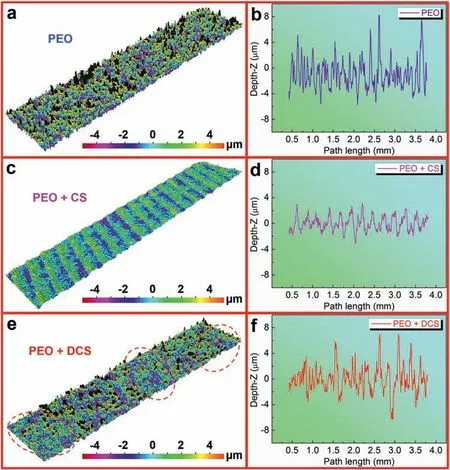
Fig. 7. Initial surface roughness of the coatings fabricated by PEO, PEO+CS and PEO+DCS. (a) 3D surface morphology and (b) surface roughness profile of the PEO coating. (c) 3D surface morphology and (d) surface roughness profile of the PEO+CS coating. (e) 3D surface morphology and (f) surface roughness profile of the PEO+DCS coating. The dashed circles in (e) indicate the difference with (a).

Table 3 Mean surface roughness (Sa) of the prepared PEO, PEO+CS and PEO+DCS coatings.
The roughness of some phosphate-based PEO coatings was reported as 1.95 μm [40] and 2.1 μm [66], which agrees with theSaof the present PEO coating. Fig. 7c shows the 3D surface morphology of the PEO+CS coating, i.e., the 3D surface morphology of the CS layer, and the CS layer is much smoother than the PEO layer, which agrees with the SEM observation.Fig.7d presents the profile of the PEO+CS coating,and theSaof the PEO+CS coating decreases significantly to 0.97 μm, comparing with the PEO coating. Fig. 7e displays the 3D surface morphology of the PEO+DCS coating, and the roughness of the PEO+DCS coating decreases in some areas and remains unaffected in others, when compared with the PEO layer in Fig. 7a, indicating the DCS of the PEO layer. Fig. 7f illustrates the profile of the PEO+DCS coating,and theSaof the PEO+DCS coating decreases slightly to 1.54 μm, comparing with the PEO coating. For clarity, theSaof the prepared PEO, PEO+CS and PEO+DCS coatings are listed in Table 3. Thus, the initial surface roughness of the PEO+DCS coating is ∼23% lower than that of the PEO coating, but ∼59% higher than that of the PEO+CS coating.Note that the "stripey" surface morphology of the CS layer in Fig. 7c should be caused by the circulated air in the furnace during the final drying process of the layer.
3.7. Wear track

Fig. 8. Wear track on the surface of the coating prepared by PEO+DCS. (a,b) SEM micrographs of the wear track on the surface of the PEO+DCS coating after a sliding distance of 2000 m. (c) High magnification surface SEM morphology of the wear track in (a) and (b). (d) EDS mapping of (b) showing the redistribution of elements in the worn area.
Figs. 8a and b show the low magnification surface micrograph of the wear track of the PEO+DCS coating at the sliding distance of 2000 m, and the visible surface roughness of the worn area is much lower than that of the neighbouring unworn area. Fig. 8c presents the high magnification surface micrograph of the wear track in Figs. 8a and b, and the uncovered areas of the PEO layer were worn to flats with similar height to their adjacent covering DCS layer, which results in the decrease of the surface roughness of the worn area after wear. Fig. 8d depicts the surface element distribution map in Fig. 8b, and the ratio of areas enriched in Mg, O and P in the worn area is much less than that in the adjacent unworn area, while the proportion of areas enriched in C and F in the worn area is much higher than that in the adjacent unworn area. The element distribution map in Fig. 8d clearly shows that the C-F-based DCS layer is largely extended to cover the Mg-O-P based PEO layer further during wear. The DCS layer comprises numerous nano cracks that split the matrix of the DCS layer into numerous nano blocks before wear (Fig. 3d),and the friction under wear induces the separation and movement of the nano blocks, which results in the extension of the DCS layer(Fig.8d).The surface roughness of the PEO+DCS coating decreased after wear due to the wear and smoothing of local raised areas of the PEO layer (Fig. 8c). The movement of nano blocks could induce low-frictional rolling friction and nano lubrication, which is beneficial to wear resistance, as discussed in Section 4. The extended covering of the PEO layer by the DCS layer (Fig. 8d) and the wear of the local raised areas of the PEO layer (Fig. 8c) leads to the dynamic decrease in surface roughness of the PEO+DCS coating after wear (Fig. 8b), and this is also helpful to wear resistance, though the initial surface roughness (Sa: 1.54 μm)of the PEO+DCS coating is not perfect.
3.8. Wear resistant mechanisms
The porous (Fig. 3a) and rough (Sa: 2.01 μm, Figs. 7a and b) microstructure of the PEO coating leads to a completely worn off for the coating after a short sliding distance of 20 m(Figs. 1e and g). This is consistent with the previously reported inferior wear resistance of PEO coatings [27,42]. The continuous sealing of the PEO layer by the ∼3.7 μm thick CS layer (Fig. 5c) results in a partially worn off for the PEO+CS coating at the increased sliding distance of 5500 m (Figs. 1f and h). Compared with PEO, the significant decrease of the mean surface roughness by ∼52%and the low-frictional C–Fbased CS layer contribute to the improvement of wear resistance under PEO+CS. The discontinuous sealing of the PEO layer by the ∼1.3 μm thick DCS layer (Fig. 5e) leads to a locally worn off for the PEO+DCS coating at the surprisingly increased long sliding distance of 110,000 m (Figs. 1d and i). It is interesting that the wear resistant distance of the PEO+DCS coating is strikingly at least 20 times superior to that of the PEO+CS coating, despite the fact that the initial mean surface roughness of the PEO+DCS coating (Sa:1.54 μm) is ∼59% higher than that of the PEO+CS coating(Sa: 0.97 μm). Therefore, the lower initial surface roughness achieved under CS does not always mean better wear resistance.

Fig. 9. Pixel image of the EDS mapping of element P on the wear track of the PEO+DCS coating after a sliding distance of 2000 m. The triangles in the lower left corner and the upper right corner are unworn areas, and the worn area is between the two triangles. The green pixel represents the PEO layer containing P, and the black pixel indicates the DCS layer without P.
For CS, the segmentation and transition in the wear test curve of the PEO+CS coating demonstrates the sequential wear from the upper CS layer to the lower PEO layer, as shown in Fig. 1f. It was found that micron-scale cracks present in the CS layer (Fig. 4b), and these micron-scale cracks could propagate and penetrate the whole cross-section of the CS layer during wear, which split the CS layer into large blocks. It was hard for these large blocks to induce rolling friction, and these large blocks can be easily thrown off the wear track once formed, which resulted in the relatively early failure of the CS layer as well as the PEO+CS coating, in comparison to the PEO+DCS coating. Different from CS, the new strategy of DCS could provide mixture wear of the DCS layer and the PEO layer, as verified by the wear track analysis in Fig. 8. Fig. 9 displays the pixel image of the EDS mapping of element P on the wear track of the PEO+DCS coating after a sliding distance of 2000 m, and the area fraction of the DCS layer and the PEO layer can be calculated by the counting of pixel. In the pixel image,the green pixel represents the PEO layer containing P and the black pixel indicates the DCS layer that does not contain P, and the triangles in the lower left corner and the upper right corner are unworn areas, while the worn area is between the two triangles. The area fraction of the PEO layer in the worn area (PPW) of the PEO+DCS coating was determined as 7.8%:
WhereL0is the side length of single pixel,Niis the counting of green pixel in the worn area (N1=29,…,N110=15), as counted in Fig. 9, andSWis the area of the worn area.
WhereNW0andNH0are the number of pixels in the width and height of the pixel image, respectively,NW1andNH1are the number of pixels in the two mutually perpendicular edges of the unworn triangle area in lower left corner, andNW2andNH2are the number of pixels in the two mutually perpendicular edges of the unworn triangle area in upper right corner.
Similarly, the area fraction of the PEO layer in the unworn area (PPU) was counted as 29.5%, and the initial area fraction of the DCS layer on the surface of the PEO+DCS coating (APU) can be calculated as 70.5%, which fitted well with the designed partially sealing of PEO layer by 70% under PEO+DCS:
WhereNjis the counting of green pixel in the unworn triangle area in lower left corner, andNkis the counting of green pixel in the unworn triangle area in upper right corner.For clarity, the counting of the green pixel in the two unworn triangle areas is provided separately in supplementary Fig.S4.
During wear, the area fraction of the PEO layer on the surface of the PEO+DCS coating was assumed as constant,and the surface of the PEO+DCS coating were mixture of 7.8% PEO layer and 92.2% DCS layer, while the average thickness of the DCS layer (ΔDW) was calculated decreasing to 1.0 μm (see Table 4):
WhereΔD0(1.3 μm) was the initial thickness of the DCS layer before wear.
As verified in Figs.3d and 8c,the low-frictional C-F-based PTFE nano blocks in the DCS layer before wear and during wear are below 100 nm, which demonstrates that at least ten layers of nano blocks present along the average 1.0 μm thick cross section of the DCS layer during wear. In addition, the extension of the DCS layer confirmed the movement of the nano blocks during wear. Therefore, the new strategy of DCS could induce low-frictional rolling friction and nano lubrication [67] during wear, instead of the sliding friction under conventional PEO+CS. In addition, the hardness test results show that the PEO layer (HV: 310 Kg·mm-2) is much harder than the CS and DCS layers(HV:6 Kg·mm-2),and the mixed wear of the PEO and DCS layers under the new strategy of DCS fits well with the highly wear resistant soft matrix (DCS layer, area fraction: 92.2%) and hard point (PEO layer, area fraction: 7.8%) model [68–70], other than the sequential wear of the upper CS layer and the lower PEO layer under conventional PEO+CS.
Fig. 10 illustrates the wear mechanisms of the new PEO+DCS coating in a more clear and visual way.Figs.10a–c present the schematic diagrams showing the cross-section of the PEO+DCS coating before wear test, after wearing for a short distance and at the further wearing distance of 2000 m,respectively. Fig. 10d shows the EDS mapping of element F on the surface of the PEO+DCS coating in Fig. 10a, and 10e displays the EDS mapping of element F on the surface of the PEO+DCS coating in Fig. 10c. In Figs. 10d and e,the yellow area shows the DCS layer containing element F,and the dark area shows the PEO layer without element F.Fig. 10f shows the high magnification surface morphology of the PEO+DCS coating in Fig. 10c. The tips of the hard PEO layer in Fig. 10a are worn to flats in Figs. 10c and f, and the DCS layer comprises multilayer nano blocks, while the highly wear resistant mixed wear of the DCS layer (soft ma-trix, area fraction: 92.2%, HV: 6 Kg·mm-2) and PEO layer(hard point, area fraction: 7.8%, HV: 310 Kg·mm-2) dominates the wear process of the new PEO+DCS coating. The evolution of mapping in Figs. 10d and e demonstrates the extension of the low-frictional F-containing DCS layer during wear, i.e., the movement of the multilayer nano blocks under friction, and this could result in low-frictional rolling friction and nano lubrication. The DCS by selective spray and the resulting atomizing dispersion, and the subsequent drying and evaporation process contributed to the formation of the nanoscale cracks and the resulting refined nanoscale blocks(<100 nm) in the DCS layer.

Table 4 Evolution of the area fraction (APU, APW) and thickness (ΔD0, ΔDW) of the DCS layer after wear for a distance of 2000 m.

Fig.10. Wear mechanism of the new coating fabricated by PEO+DCS.(a–c)Schematic diagrams illustrating the cross-section of the PEO+DCS coating(a) before wear test, (b) after wearing for a short distance and (c) at the further wearing distance of 2000 m. (d) EDS mapping of element F on the surface of the PEO+DCS coating in (a). (e) EDS mapping of element F on the surface of the PEO+DCS coating in (c). In (d) and (e), the yellow area shows the DCS layer containing element F, and the dark area shows the PEO layer without element F. (f) high magnification SEM micrograph showing the surface morphology of the PEO+DCS coating in (c), the tips of the hard PEO layer in (a) are worn to flats in (c,f), and the DCS layer comprises multilayer nano blocks.

Where(2.01 μm) is the initial mean surface roughness of the PEO layer.
According to the Buckingham theorem,the wear behaviour of coatings can be expressed by the dimensionless wear factorkHas a function of the input energy and the energy that is dissipated by the wearing material during the wear process[71,72]:
Wherekis the wear rate,His hardness,Cis a factor,μis friction coefficient,Pis normal load,vis sliding velocity,reqis the equivalent contact radius,dis thermal diffusivity,Eis elastic modulus,lis the average debris size,Kcis the fracture toughness, andniare exponents.
The friction coefficient curve of the present PEO+DCS coating was in similar profile to the nano MoS2/Sb2O3/Au lubricated coating for steel [73] that fitted into the Hertzian contact model [74,75], and this also supported the abovementioned nano lubrication during wear of the newly developed PEO+DCS coating.
Whereτ0is the interfacial shear strength between the wear surface of the coating and the counterface of the wear pin,Ris the radius of the counterface of the wear pin, andαis the is the lowest attainableμfor a given friction sample.
It has been reported [76,69] that the critical contact pressure (Pcr) required for the initiation of cracking in the coating during macro or nano wear process can be coupled with the wear parameters as follows:
Whereσis constant,a0can be approximated from the size of wear debris,aandbare exponents, andWis the wear volume. For the PEO+DCS coating, the induced nano lubrication, rolling friction and dynamic decrease of surface roughness resulted in the significant decrease ofμ, which impeded the initiation of cracking via the promotion of requiredPcr, while the coating was more likely to meet thePcrof crack initiation after long term of wear through the accumulation of wear volume, and this might also lead to the super wear resistance.
In short, different from the micron-scale cracks formed in the CS layer, the strategy of DCS induces numerous nano cracks that split the matrix of the DCS layer into multilayer nano blocks (Fig. 3d), and DCS also provides the necessary extra space for the movement of the nano blocks and the mixed wear of the PEO and DCS layers during wear. The dynamic decrease of the surface roughness after wear, the induced low-frictional rolling friction and nano lubrication, and the induced highly wear resistant mixed wear of the DCS(soft matrix) and PEO (hard point) layers result in the super wear resistance of the new PEO+DCS costing for Mg alloys. The strategy introduced in this work can be refined as the methodology of depositing a low-frictional and soft discontinuous layer on a rough and hard layer or matrix, which also opens a window for the achieving of super wear resistant coatings in other materials.
4. Conclusions
A discontinuous coating with superior wear resistance for light metals such as Mg alloys was achieved, via the novel strategy of DCS a thin low-frictional PTFE layer on the necessary PEO protection layer of Mg alloys via selective spraying,and the underlying mechanisms were investigated. The main conclusions are as follows:
(1) The basing PEO layer deposited on Mg alloy shows porous microstructure and rough surface, and it has a thickness of 14 μm and a surface roughness of 2.01 μm.The PEO layer comprises the MgO and Mg3(PO4)2phases,and it bears the high hardness of 310 Kg·mm-2.The single PEO layer exhibits poor wear resistance, and it can be fully worn off at a sliding distance of only 20 m under the present designed Pin-on-Disc wear test.
(2) Based on the PEO layer, in contrast to the conventional CS of a 3.7 μm thick low-frictional PTFE layer that has a perfect initialSaof 0.97 μm, the newly DCS of a 1.3 μm thick PTFE layer with an overall Afof 70% is surprisingly 20 times superior for enhancing wear-resistance, though the initialSaunder PEO+DCS(1.54 μm) is imperfectly 59% higher than that under PEO+CS. The newly fabricated PEO+DCS coating maintains the super low friction coefficient of less than 0.2 and just starts to wear off at localized points after a long sliding distance of 110,000 m, under the present designed Pin-on-Disc wear test.
(3) The strategy of DCS contributes to the formation of numerous nano-cracks that splits the matrix of the DCS layer into multilayer nano-blocks, and DCS also provides extra space for the movement of the nano-blocks during wear, which result in low-frictional rolling friction and nano-lubrication under PEO+DCS, instead of the sliding friction under conventional PEO+CS.
(4) The migration of nano-blocks under the new strategy of DCS leads to an extension of DCS layer to an Afof 92.2% and a tight surface interface between the DCS and PEO layers during wear, which further promotes highly wear-resistant mixed wear of the DCS (soft matrix, Af:92.2%, HV:6 Kg·mm-2) and PEO (hard point,Af:7.8%, HV:310 Kg·mm-2) layers, other than the sequential wear of the CS and PEO layers under conventional PEO+CS.
(5) The strategy of DCS induces the extension of DCS layer and the shrinkage of the rough PEO layer on the surface of the PEO+DCS coating under wear, which results in a remarkably dynamic decrease ofSaby 29%to an idea level of 1.09 μm during wear, and this also contributes to the super wear-resistance of the novel PEO+DCS coating.
(6) The newly fabricated PEO+DCS coating for Mg alloys could deliver a superior wear resistance that is strikingly∼5500 times greater than the base PEO coating, which enables Mg alloys to be used as sliding or reciprocating parts in industries, where Mg alloys have special advantages. The strategy of depositing a low-frictional and soft discontinuous layer on a rough and hard layer or matrix also opens a window for achieving super wear resistant coatings in other materials.
Credit author statement
X. Dong: conceptualization, design of experiments, results analysis, manuscript draft and revision. M. Xia: contribution to experimental design and result discussion. F. Wang, H.Yang and G. Ji: contribution to results analysis and discussion. E. Nyberg: result discussion and manuscript edition.S. Ji: resourcing, conceptualization, results discussion and manuscript edition.
Declaration of competing interest
The authors declare no competing interests for this work.
Acknowledgements
This work was financially supported by the Jiangsu Distinguished Professor Project, the Innovate UK (Project reference: 10004694) and the National Key R&D Program of China 2021YFB3401200. The Experimental Techniques Centre at Brunel University London and Nanjing University of Aeronautics and Astronautics are acknowledged. The authors also acknowledge the characterization facility at Shanghai Jiao Tong University, Central South University, University of Birmingham and University of Lille.
Supplementary materials
Supplementary material associated with this article can be found, in the online version, at doi:10.1016/j.jma.2023.08.003.
杂志排行

Journal of Magnesium and Alloys的其它文章
- Characterizations on the instantaneously formed Ni-containing intermetallics in magnesium alloys
- Corrosion resistance of Mg-Al-LDH steam coating on AZ80 Mg alloy:Effects of citric acid pretreatment and intermetallic compounds
- Gradient structure induced simultaneous enhancement of strength and ductility in AZ31 Mg alloy with twin-twin interactions
- In-depth analysis of the influence of bio-silica filler (Didymosphenia geminata frustules) on the properties of Mg matrix composites
- Effect of Cd on matrix structure ordering and aging precipitation evolution in a Mg-Gd-Cd solid-solution alloy
- A multifunctional osteogenic system of ultrasonically spray deposited bone-active coatings on plasma-activated magnesium