Nitrogen Content Inversion of Corn Leaf Data Based on Deep Neural Network Model
2023-11-14YulinLiMengmengZhangMaofangGaoXiaomingXieWeiLi
Yulin Li, Mengmeng Zhang, Maofang Gao, Xiaoming Xie, Wei Li
Abstract: To obtain excellent regression results under the condition of small sample hyperspectral data, a deep neural network with simulated annealing (SA-DNN) is proposed.According to the characteristics of data, the attention mechanism was applied to make the network pay more attention to effective features, thereby improving the operating efficiency.By introducing an improved activation function, the data correlation was reduced based on increasing the operation rate, and the problem of over-fitting was alleviated.By introducing simulated annealing, the network chose the optimal learning rate by itself, which avoided falling into the local optimum to the greatest extent.To evaluate the performance of the SA-DNN, the coefficient of determination (R2), root mean square error (RMSE), and other metrics were used to evaluate the model.The results show that the performance of the SA-DNN is significantly better than other traditional methods.
Keywords: precision agriculture; deep neural network; nitrogen content detection; regression model
1 Introduction
Nitrogen (N) is a limiting element that affects plant growth and development in most terrestrial ecosystems [1], particularly for crops with high demand such as maize.Not only is corn the main food crop but also it has a wide range of applications in the field of medicine.Corn is rich in unsaturated fatty acids, which work with vitamin E in corn germ to prevent and treat diseases such as coronary heart disease, atherosclerosis, hyperlipidemia, and hypertension.Corn silk can reduce the increase in intraocular pressure caused by systemic or non-systemic hypertension.Cornstarch is widely used in the preparation of pharmaceutical tablets.Therefore, the evaluation of nitrogen content in corn plays a vital role in improving corn yield, ensuring high grain yield, and ensuring important medicinal raw materials.To supplement the N needed for crop growth, synthetic fertilizers have been invented.Fertilizer is indispensable for crop growth, and 30%–50% of the increase in crop yield is due to the use of fertilizer [2].However, excessive fertilizer application can lead to soil hardening, acidification, a rise in greenhouse gas emissions, and a decrease in microbial diversity [3,4].For example,China comprises one of the largest maize-producing areas in the world.China’s maize planting area is more than 37 million hectares and the total production is more than 215 million tons[5].Furthermore, maize production accounts for approximately 55% of the overall annual crop production in the country.However, it needs to grow at an annual rate of more than 2.4% to ensure food security [6].In China, N fertilizers are typically applied at levels that are higher than the demand for crops, not only leading to the decline of maize yield and quality but also causing high production costs, and environmental pollution [7].To fulfill precision agricultural management, the first key step is to monitor crop N accurately and efficiently.To achieve accurate N monitoring, a variety of methods and tools have been investigated.
Traditional methods for N content detection include destructive leaf-tissue sampling, wet laboratory experiments, and leaf gas exchange experiments.These methods can obtain accurate N content values, but they are time-consuming and difficult to process large amounts of data.Since the shape, pigments, biomass, water content, and organic substances of crops are closely related to the spectral wavelength, researchers began to use remote sensing technology with the characteristics of high efficiency, fast, and no damage to detect the N content of crops [8].
However, satellite hyperspectral sensor is not suitable for agricultural inversion due to the mismatch between their coarse pixel resolution(0.1–1.0 km) and field measurements (<5 m).Even with the few wavelengths available from some satellites known for their high spatial resolution, the achievable detection accuracy is still far from satisfactory [9,10].Compared with satellites, aerial hyperspectral technologies represented by Unmanned aerial vehicles (UAV) have the advantages of providing high spatial resolution (<1 m), a large number of wavelengths, and an ideal revisit time.This makes it an ideal tool for agricultural inversion [11].For example, Chen et al.utilized different smoothing filters, including multiplicative scatter correction (MSC), Savitzky-Golay (SG) smoothing, normalization by the mean, standard normal variate transformation (SNV), and first-order derivative (FD) or second-order derivative (SD), to preprocess original reflectance data.Then they applied the successive projection algorithm (SPA), random frog(Rfrog), and partial least squares regression(PLSR) to extract features.Researchers combine different methods to process hyperspectral data.Among them, Rfrog-extreme learning machine (ELM) has the best accuracy [12].In addition, hyperspectral data collected by handheld spectrometers with high spatial resolution are also widely used in agricultural inversion.Wen et al.used a canopy hyperspectral optimized red edge absorption area (OREA) index to estimate the vertically integrated leaf N content in different field trials [13].The stability and performance of the inversion method have been improved.
Currently, few scholars use neural networks for related research.One of the main factors restricting the application of hyperspectral technology is that hyperspectral data contains a huge amount of redundancy with high feature dimension and complexity.With the development of hyperspectral technology, it is foreseeable that the data complexity becomes higher and higher.Although the traditional regression methods can obtain good results at present, with the further improvement of data complexity, their weakness in the face of high-complexity data will further affect their performance.The flexibility of the deep neural network model makes its performance less affected by the complexity of the data structure, and the multi-layer nonlinear mechanism allows it to fully express complex nonlinear relationships.The excellent performance of deep neural networks in the face of large amounts of data can help improve various regression and classification problems.Yu et al.used a model composed of a stacked autoencoder and full connect neural network, called SAE-FNN, to measure the N content of rape leaves.The results are significantly better than the two regression methods PLSR and least square support vector machines (LS-SVM) [14].It can be seen that the combination of various neural networks and hyperspectral technology has great application prospects.
In this study, the overall goal of this study is to propose a deep neural network to invert the N content of leaves.We hope to obtain the mapping relationship between hyperspectral data and N content by establishing an inversion model.This is expected to provide a model reference for efficient detection of N content in corn leaves.The contributions of this study are as follows:
1) Since hyperspectral data has the problems of high data redundancy and high correlation between adjacent bands, this study proposes SA-DNN that can maximize the advantages of hyperspectral data while reducing the impact of adverse factors as much as possible.The model uses an attention mechanism to reduce the burden of data redundancy, especially when dealing with an extremely limited number of samples.
2) Based on the SA-DNN, a new activation function has been designed.The improved activation function can maximize the advantages of hyperspectral data while avoiding the disadvantages of slow running speed and large data correlation.After the improvement, other problems such as the original activation function not activating some features can also be avoided.The acquisition of hyperspectral data is expensive, so regression models are mostly trained with small samples.The SA-DNN has excellent performance even with small samples.
3) In the SA-DNN, a simulated annealing technique is employed, which can choose the optimal learning rate to maximize the performance of the network.Through periodic fluctuations in the learning rate, the model that falls into the local optimum can learn again.The model repeats this process many times to avoid falling into local optimum to the greatest extent,so that the model can get the best performance possible.
4) Through the comparison with the existing regression model, the SA-DNN has great advantages in model performance and operating efficiency.With the development of the application of hyperspectral technology in the agricultural field, the model that can better handle complex data is bound to play a more important role in the agricultural inversion problem.
2 Materials and Methods
2.1 Data Measurement
In this experiment, a FieldSpec4 spectrometer was used to collect the spectral reflectance of corn leaves.The range of the collected spectrum wavelength was 350–2 500 nm, with a sampling interval of 1.4 nm between 350 nm and 1 000 nm,and a sampling interval of 2 nm between 1 001 nm and 2 500 nm.During the hyperspectral measurement of each sample, five spectral reflectance curves are measured, and the average value is taken as the experimental reflectance of the sample.Among them, the wavelength range of hyperspectral data is 350 nm to 2 500 nm, with a total of 2 151 bands.In this study, an N-Pen palm nitrogen meter was used to determine the available nitrogen content of maize leaves.It is a portable instrument suitable for measuring the available nitrogen content of plants during the growing season.The instrument measures the nitrogen content based on the characteristics of light reflected by plant leaves [15].
In the process of measurement in the field,when the flying height of the UAV increases, due to the interference of atmospheric water vapor,instrument noise, and other factors, there are obvious abnormalities in some frequency bands.As shown in Fig.1, there are obvious anomalies in the three bands of 1 331–1 480 nm, 1 791–1 960 nm,and 2 301–2 500 nm.This shows that these three bands have the strongest absorption of environmental anomalies, and the data in this part is meaningless, so these 520 bands are deleted.Finally, 1 631 spectral bands are used for modeling, twenty-eight of the thirty-eight samples are used as the training set and ten are used as the test set.The comparison chart is shown in Fig.1.
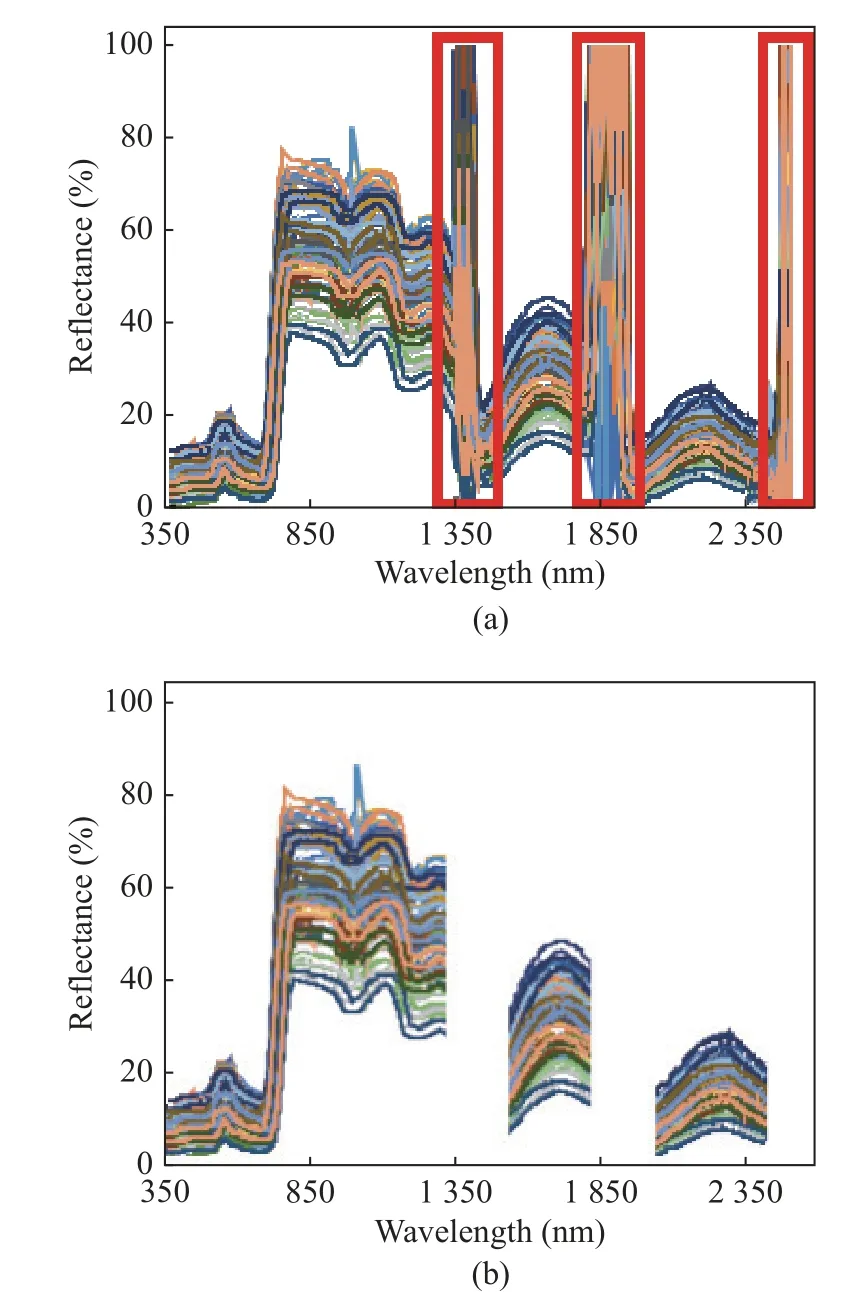
Fig.1 Spectral reflectance curves: (a) all spectral reflectance curves; (b) removed spectral reflectance curves
After removing the abnormal bands, the remaining bands need to be denoised.There are various kinds of noise interference in the acquisition process of hyperspectral data.In the process of data conversion, various errors will occur due to manual operations.These errors have a large impact on the accuracy.Especially when the amount of data is small, the errors in individual data will cause serious interference.Therefore,noise reduction processing is required.In this experiment, the method of wavelet transform is chosen for noise reduction.The wavelet noise reduction method utilizes the ability of time-frequency local decomposition of the orthogonal wavelet.During signal processing, the amplitude of wavelet components is relatively large.After wavelet decomposition, most of the coefficients with larger amplitudes are useful signals, while the coefficients with smaller amplitudes are generally noise.The threshold denoising method is to find a suitable threshold, keep the wavelet coefficients larger than the threshold, process the wavelet coefficients smaller than it accordingly,and then restore the useful signal according to the processed wavelet coefficients [16].In this experiment, the data are divided into four groups.Each group of data is divided into two parts, and each part is subjected to a discrete wavelet transform to on its approximate signal and high-frequency signal.Then a part of the approximate signal is combined with another part of the high-frequency signal for inverse transformation, and the obtained data is the processed data.Here is a set of data as an example,the schematic diagram is shown in Fig.2.
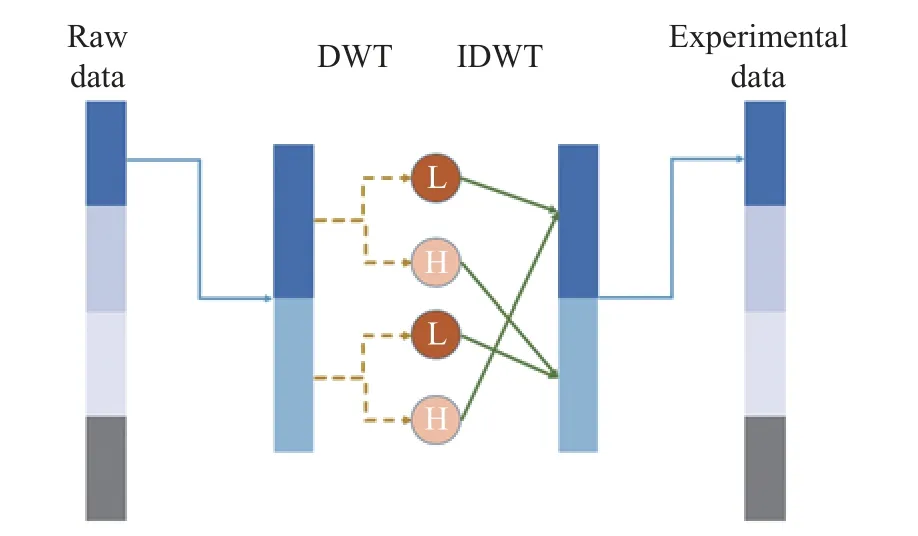
Fig.2 Wavelet transform
2.2 Activation Function Selection
The activation function plays a significant role in the nonlinear mapping representation between the input data and output data for deep neural networks [17].The activation functions used in this experiment are the preset tanh function and a self-built improved function.
The advantage of the tanh function is that the output mean is 0, which has a better convergence speed and reduces the number of iterative updates [18].At the same time, due to the small value of the data features used, using the tanh function as the activation function does not make the derivative close to 0, and the gradient disappearance problem of slow weight update occurs.However, since the value range of the tanh function is the entire real number domain, the parameter correlation is high, which inevitably leads to overfitting when there are many features.Therefore, the activation function is improved in the first few layers of the hidden layer.By changing the negative field, some neurons can be turned into minimum values, reducing the correlation of the network and easing the problem of overfitting.At the same time, since the negative field is not 0, solving the 0 gradient problem can also very well alleviate the problem that some neurons are never activated.The improved activation function can not only make full use of the tanh function to keep the value unchanged, the training is simple, and the operation speed is fast; at the same time, it can also take advantage of leaky relu to reduce parameter correlation and alleviate the dead relu problem.The improved activation function formula is
wherexis an independent variable, andαis the artificially set slope parameter.
2.3 Evaluation Metrics
In this experiment, the regression model utilizes four different evaluation metrics to evaluate the performance of the regression model.They are RMSE, R2, F-test, and mean absolute error(MAE).The combination of different evaluation criteria can more comprehensively reflect the augmentation degree of generated data to a certain set of data.For example, combining MAE and RMSE shows whether the prediction is overall high or low, which can determine the bias of the prediction.
2.4 Designed DNN with Limited Samples
In this study, the experiment uses the corn leaf dataset for network training and testing.The model training environment in this study is as follows.The computer operating system used is a 64-bit Windows 10 system.The processor is an Intel(R) Core (TM) i7-7 700 CPU 4-core processor, and the GPU is an RTX1080 graphics card.GPU can significantly speed up model training.This experiment uses the TensorFlow 2.4 framework for model building and training.The TensorFlow framework has the advantages of ease of use and efficient networking, and can easily build various deep learning models.The CUDA version used is 11.0, and the corresponding CUDNN version is 8.0.The number of training epochs is 8 000 and the batch size is 128.The initial learning rate is 5×10⁻⁴and the minimum learning rate is 1×10⁻⁶.
The biggest problem that limits the wide application of hyperspectral data is that a large amount of band data is difficult to process quickly by traditional methods.The superior performance of DNN in the face of large amounts of data perfectly meets the needs of hyperspectral data.The DNN can be divided into three types:input layer, hidden layer, and output layer.
A soft attention mechanism is used for feature screening in this study.Before dimensionality reduction, the attention distribution weight of each feature is calculated, and the weight is between 0 and 1, indicating the relevance of these features to the target [19].Then the input information is weighted and summed according to the attention distribution.With the help of the attention mechanism, the information that is more critical to the current task is filtered out of the input, and the attention to others is reduced.In this way, limited computing resources can be concentrated on more efficient features, and resource utilization is improved.
The sample data selected in this experiment is less, and after the attention mechanism is introduced, the problem of model overfitting is more serious.Therefore, L1&L2 regularization is added to the neural network.L1 regularization is to add the L1 norm as a penalty term after the loss function, which makes some features turn the parameters into a sparse matrix, which is similar to the working principle of the attention mechanism [20].The L2 regularization principle is the same, except that the penalty term becomes the L2 norm.L2 regularization does not change the coefficient to 0, which can effectively reduce model overfitting [21].
In this experiment, the artificially set fixed learning rate is difficult to meet the needs of the model.The initially set learning rate often causes the model to fall into a locally optimal solution during the training process.This greatly affects the stability of the model.Therefore, simulated annealing is employed for adaptive training of the learning rate.The cosine function is used as the simulated annealing function.The difference between simulated annealing technology and different adaptive learning rate training methods is that it can increase the learning rate again after the model effect is gradually stabilized, rather than continue to decrease to pursue better.By increasing the learning rate, the model can jump out of the current optimal point and try to find other optimal points [22].Then the optimal model is called through the callback function,which can maximize the guarantee that the model is in the global optimum.A schematic diagram of the SA-DNN model is shown in Fig.3.
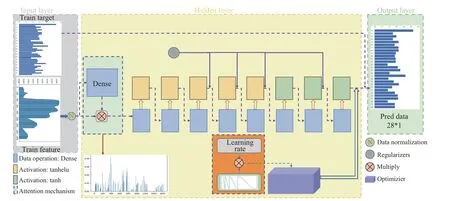
Fig.3 The schematic diagram of the SA-DNN model
3 Experimental Results
3.1 SA-DNN Model Parameters
In the previous part, the schematic diagram of the SA-DNN model is given.To get the best results, we compared the model depth, optimizer,loss function, regularization parameters, attention mechanism, and parameter adaptation of SA-DNN, and obtained the best performance.
3.1.1 Depth of SA-DNN
The complexity of the model is related to its capacity.To enhance the capacity of the model we either increase the width or depth of the network.By increasing the width of the network,each layer can learn richer features.For example,texture features in different directions and frequencies.However, from the perspective of increasing the complexity of the model, it is more effective to enhance the network depth.When the network depth increases, not only the number of basic functions is increased, but also the number of nested layers of functions, so the functional expression ability is stronger.Therefore,increasing the depth of the network becomes the first choice to enhance the model's expression ability.As the depth of the network increases, we can obtain better-fitted features, and learn more complex transformations.However, if there are too many, the gradient of the neural network itself is unstable.As the network deepens, problems such as network degradation affect the performance.At the same time, too-deep network layers lead to serious overfitting problems.The performance of different network depths is provided in Tab.1.
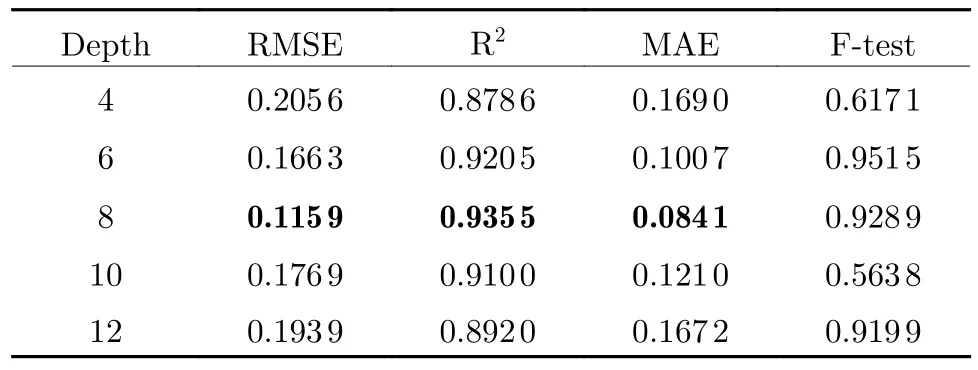
Tab.1 The effect of depth of SA-DNN
3.1.2 Optimizer and Loss Function
The loss function refers to the function used to calculate the difference between the label value and the predicted value.To achieve different purposes, we need to choose a suitable loss function to obtain the optimal result.In this experiment, we chose the most common mean square error (MSE) and MAE as loss functions for comparison.MSE is to calculate the sum of squares of the distance between the predicted value and the true value.Its most direct advantage is that it is simple to calculate and consumes fewer computing resources.However, MSE gives more weight to the outliers, and when the data has anomalies, it will significantly affect the performance.The MAE is the sum of the absolute values of the difference between the target value and the predicted value.MAE only measures the average modulo length of the predicted value error, regardless of direction.Its advantage is better robustness against contaminated data.The optimizer guides each parameter of the objective function to update the appropriate size in the correct direction in the process of deep neural network backpropagation.So that the updated parameters make the objective function value continuously approach the global minimum.We select the RMSProp algorithm and the Adam algorithm for comparative experiments.The RMSProp algorithm can adapt the learning rate of all model parameters independently, scaling each parameter inversely proportional to the square root of the sum of all its gradient history averages.Therefore, when updating the weights,the larger gradient is greatly reduced, and the smaller gradient is reduced slightly.In this way,the swing during the entire gradient descent is made smaller, a larger learning rate is set, and the learning efficiency is accelerated.In the Adam algorithm, the momentum is directly incorporated into the estimation of the first moment of the gradient.In contrast to RMSProp where the lack of a correction factor causes the second moment estimates to be highly biased early in training, Adam includes a bias correction that corrects the first and second moment estimates initialized from the origin.The current mainstream view is that the Adam algorithm is slightly better than the RMSProp algorithm in practical use.The relevant parameters are listed in Tab.2.

Tab.2 The effect of optimizer and loss function
3.1.3 Regularization Performance
Regularization adds penalty terms to the parameters of the layer or the activation value during the optimization process.These penalty terms are combined with the loss function as the final optimization goal of the network, which is an effective method to solve the problem of overfitting.In this way, the advantages of both are fully utilized, and the problem of overfitting is alleviated as much as possible.Taking the fourth layer as an example here, the performance is provided in Tab.3.
3.1.4 Ablation Study
To validate the effect of self-attention and the improved activation function, this study compared the regression results before and after using these modules, and the results are reported in Tab.4.
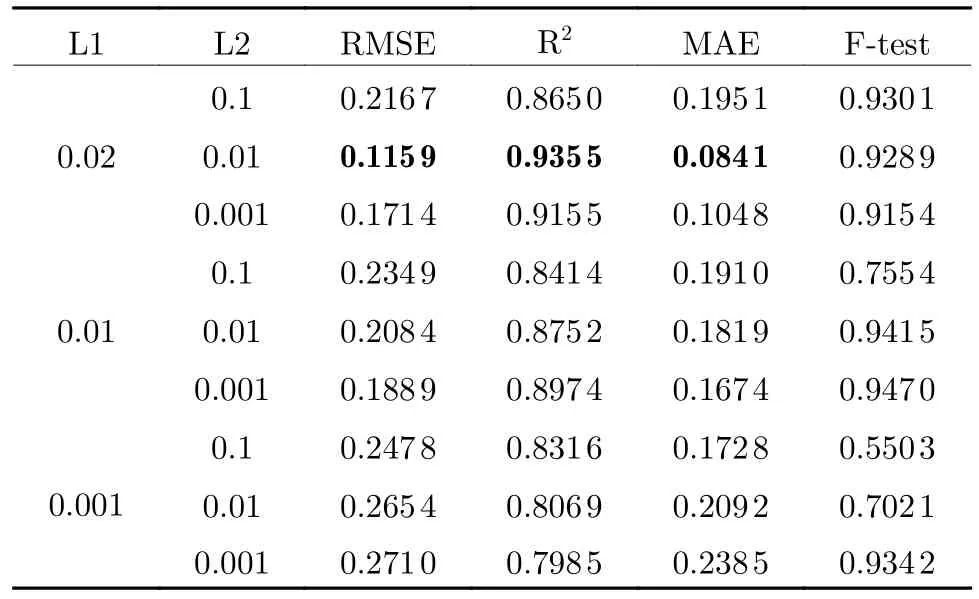
Tab.3 Different regularization strategies
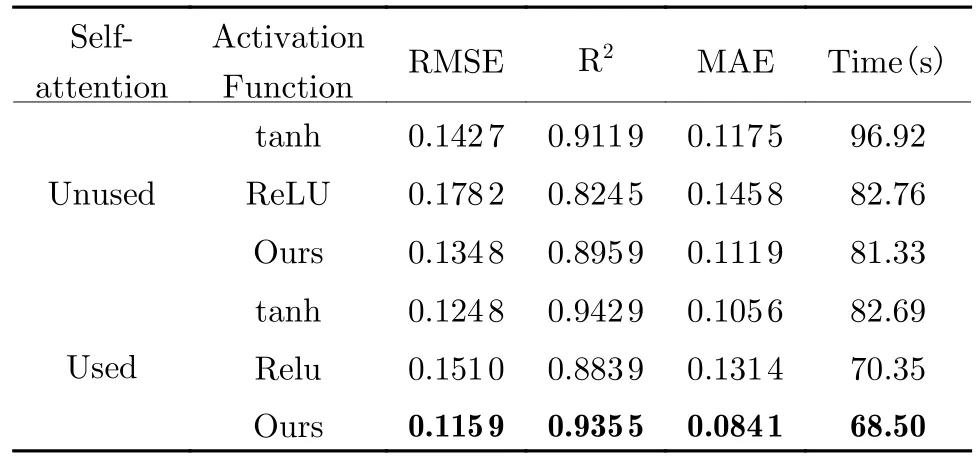
Tab.4 The effect of self-attention and the improved activation function
The model uses simulated annealing and early stopping to control the number of iterations.The performance improvement of the attention mechanism is limited, but it can make the model obtain the optimal solution earlier and improve the operating efficiency of the model.Comparing the activation function, it can be found that tanh can obtain better regression results, while the ReLU function is more efficient.At the same time, the observation results show that the gap between the training set and the test set obtained by the ReLU function is small,which alleviates the overfitting problem.Through the combination of the two, the improved activation function has improved efficiency and performance.
3.2 State-of-the-Art Comparison
3.2.1 Model Performance
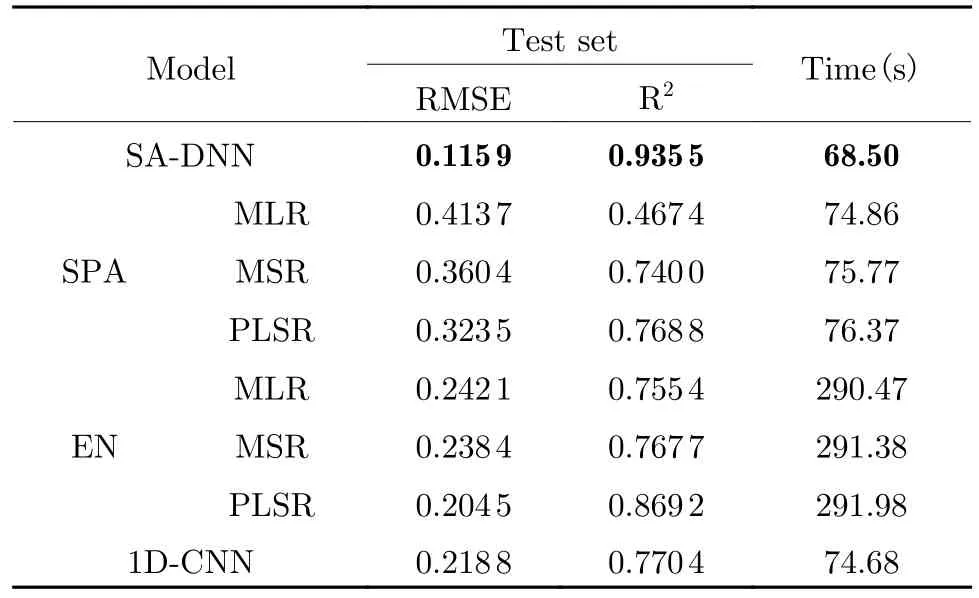
In this study, the DNN model is used for the inversion of hyperspectral data, and the results of it and the other seven models [15, 23] are provided in Tab.5.SA-DNN model (Fig.4(a)) can achieve good results in the face of a small number of samples with a large number of features,and its effect is significantly better than the traditional regression model.The different dimensionality methods are very obviously divided into two groups which shows that the dimensionality reduction method used does not obtain a general feature model.The sensitive bands selected for nitrogen content should be roughly the same.It can be seen that the overall performance of the SPA reduction method is the worst (Fig.4 (b),(c), (d)).The elastic net (EN) algorithm gets the best overall performance (Fig.4(e), (f),(g)).The traditional dimensionality reduction method becomes more and more powerless in the face of the increasingly large amount of hyperspectral data, while the neural network shows superior performance.
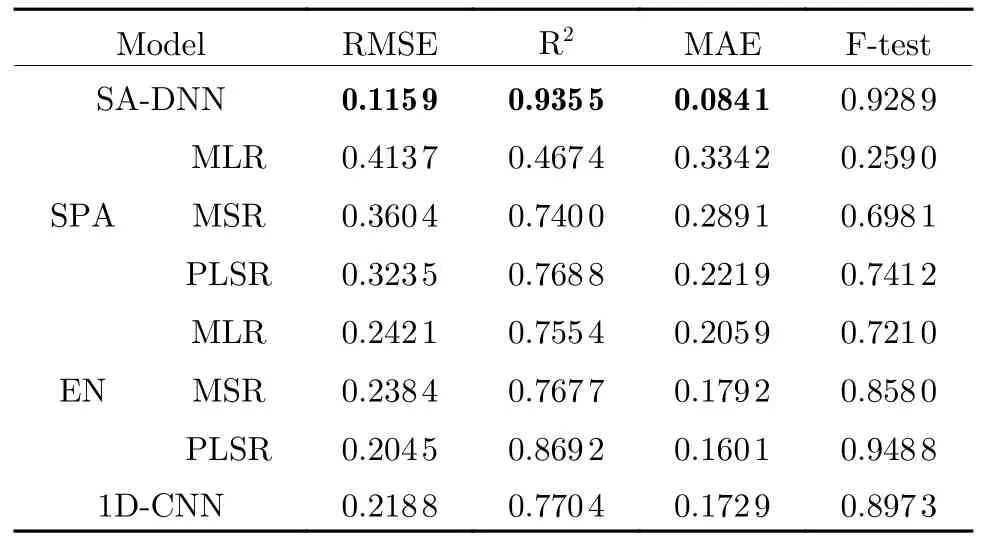
Tab.5 Model performance comparison
In practical applications, it is difficult to process a large amount of redundant data, and labeling samples requires a lot of manpower and material resources.In this case, the traditional linear regression model suffers from serious overfitting problems, while the DNN performs satisfactorily and reflects great development potential.
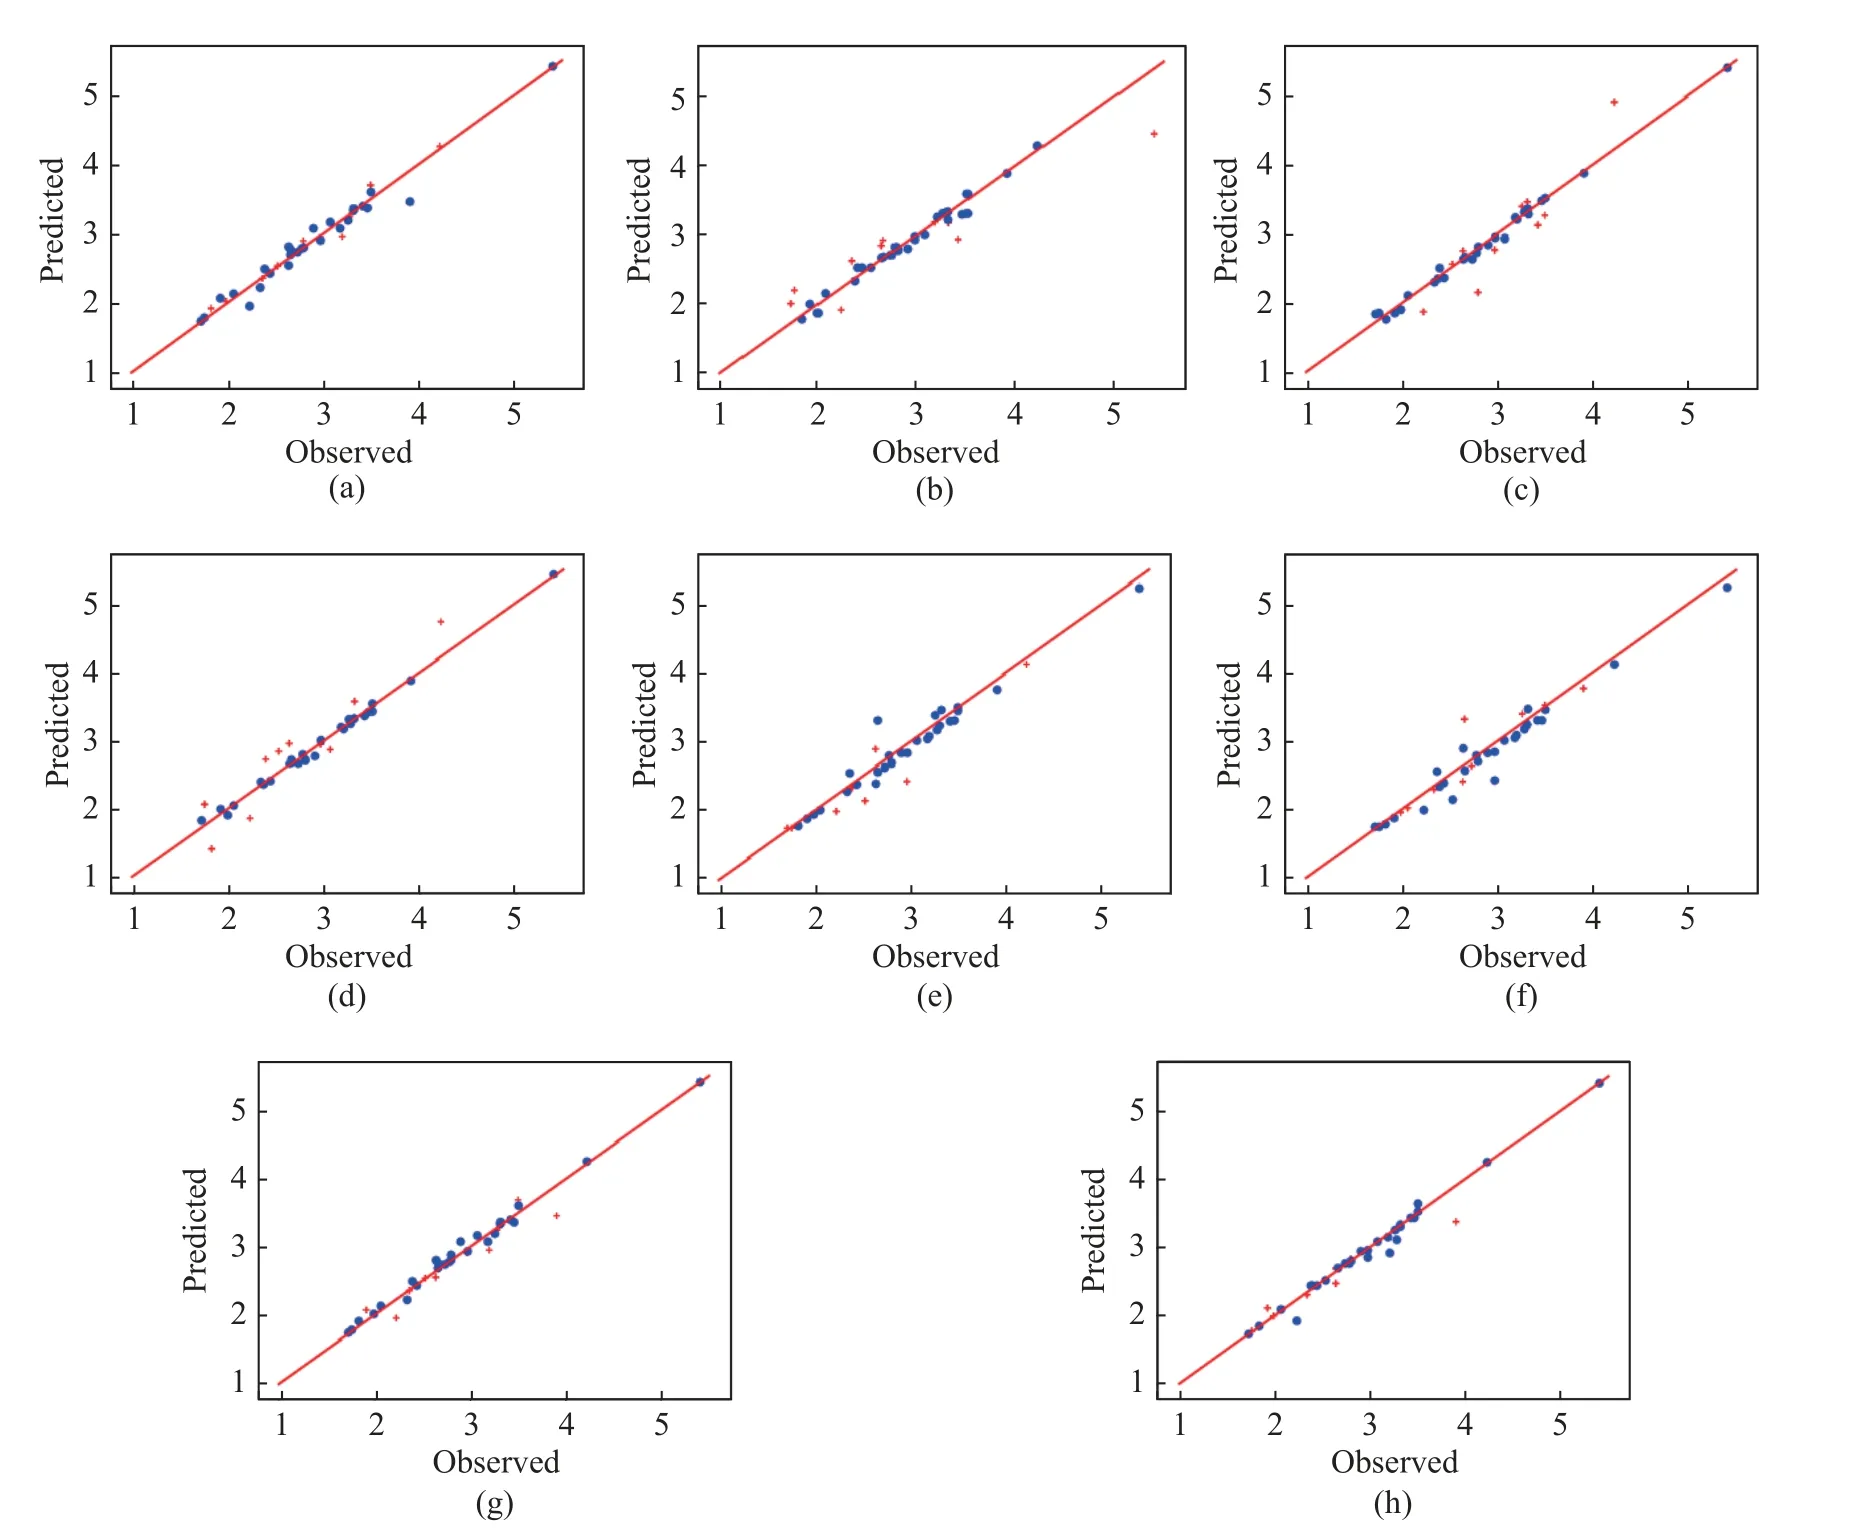
Fig.4 Comparisons of the DNN model with traditional models: (a) SA-DNN; (b) SPA-MLR; (c) SPA-MSR; (d) SPA-PLSR; (e)EN-MLR; (f) EN-MSR; (g) EN-PLSR; (h) 1D-CNN
At present, the research on hyperspectral inversion mainly focuses on the field of machine learning.Among many traditional regression algorithms, the PLSR method is the most comprehensive.It integrates the advantages of multiple linear regression, principal component analysis, and canonical correlation analysis.To be specific, PLSR takes part of the principal components as a new variable set and performs least squares regression on this basis.Therefore, the response variable plays the role of adjusting the parameters of each principal component.When there are many data bands with high correlation,and the sample size is small, the model established by PLSR has advantages that other methods do not have.Multiple linear regression can lead to overfitting due to correlations between independent variables.The principle of PLSR determines that when it faces multi-feature data,the operation time will be much longer than that of traditional algorithms.Therefore, it is necessary to cooperate with dimensionality reduction methods to improve the operation efficiency of the model.It can be seen in previous comparative experiments that the overall effect of PLSR(R2=0.869 2) is significantly better than multiple linear regression (MLR, R2=0.755 4) and multiple stepwise regression (MSR,R2=0.767 7), while SA-DNN outperforms the PLSR.
In the face of hyperspectral data with a large number of features, deep neural network technology can make full use of its excellent feature extraction ability.At present, how to better use the deep neural network model for hyperspectral inversion is still in the exploratory stage, and there is no recognized optimal model.1D convolutional neural network (1D-CNN) (Fig.4 (h))was used to Detect the nitrogen content of rapeseed leaves and obtained the result of R2=0.903.Accordingly, the 1D-CNN is also analyzed in the manuscript.We reproduced the model to run on our data and the result was R2=0.7704.The SADNN achieved a result of R2=0.935 5 in the case of a large spectral range, and the better performance can be attributed to the design of our modified activation function and L1&L2 regularization network, which greatly reduces the overfitting effect that most of the deep models encounter.
3.2.2 Algorithm Efficiency Comparison
Among the seven combination models, there are three distinct groups in terms of time spent depending on the dimensionality reduction method used.The time spent by the seven models is mainly concentrated on the dimension reduction part.Among them, the SPA dimensionality reduction method has the shortest time,but this is traded at the cost of a significant disadvantage in model performance.As an improved algorithm, the EN algorithm has achieved significant advantages in performance.But it takes much more time than other dimensionality reduction methods.The 1D-CNN method has superior performance and efficiency.However, SA-DNN model achieves better performance than the ENPLSR model and takes a little less time than the 1D-CNN, which takes the shortest time.The performance is provided in Tab.6.
Tab.6 Model running speed comparison
4 Conclusion
In this study, 38 sets of maize leaf data in Changping, Beijing were selected for the nitrogen content inversion experiment.In experiments, we build a SA-DNN model to demonstrate the advantages of deep neural networks in the field of hyperspectral data regression.To prove this point of view, three dimensionality reduction methods of SPA and EN and three regression methods of MLR, MSR, and PLSR are selected for combination.Through the comparison between the SA-DNN model and traditional models, the model with the best effect is obtained.The conclusions are summarized as follows.
1) The SA-DNN model outperforms the selected seven models in both performance and efficiency.A major factor restricting the development of hyperspectral technology is that hyperspectral data has a large amount of redundant data, which greatly affects the operation speed and accuracy of the model.This phenomenon can still be obtained even on small datasets where the traditional method ’s performance is relatively poor, proving that deep neural network has broad prospects for development in this field.
2) In this experiment, the features are prescreened by the attention mechanism, which reduces the data redundancy.The SA-DNN uses a regularized network to reduce overfitting and improve the generality of dimensionality reduction.Finally, we employ a simulated annealing mechanism to reduce the possibility of getting stuck in local optima.The combination of the three maximizes the performance of the model in the case of small samples.
杂志排行
Journal of Beijing Institute of Technology的其它文章
- Reduced Imaging Time and Improved Image Quality of 3D Isotropic T2-Weighted Magnetic Resonance Imaging with Compressed Sensing for the Female Pelvis
- Analysis of Dynamic Characteristics of Forced and Free Vibrations of Mill Roll System Based on Fractional Order Theory
- Automated Segmentation of the Brainstem, Cranial Nerves and Vessels for Trigeminal Neuralgia and Hemifacial Spasm
- Application of Opening and Closing Morphology in Deep Learning-Based Brain Image Registration
- Tissue Microstructure Estimation of SANDI Based on Deep Network
- Spatial-Spectral Joint Network for Cholangiocarcinoma Microscopic Hyperspectral Image Classification
