三维Cu-MOF对亚甲蓝的吸附和光催化降解及其机理
2023-10-19鲁雪莹张美丽任宜霞王记江杨晓刚
鲁雪莹 张美丽*, 任宜霞 王记江 杨晓刚
(1延安大学化学与化工学院,新能源与新功能材料实验室,延安 716000)
(2洛阳师范大学化学与化学工程学院,河南省功能多孔材料重点实验室,洛阳 471934)
0 Introduction
During the past decades,a new type of nanoporous crystalline,metal-organic framework (MOF)materials have been used in diverse fields including sorption,sensors,catalysis,drug delivery,magnetism,luminescence,light-harvesting,biomedical imaging,ionic conductivity,etc[1-8].Meanwhile,there has been a surge of interest in the investigation of catalytic degradation and/or adsorption to remove pollutants from water by MOF materials.Because MOFs present many properties that commend them in water treatment: (ⅰ)active sites,where contaminants can be chemisorbed and/or degraded; (ⅱ)large specific surface area and pore volume,associated with high adsorption capacities; (ⅲ)highly stability in water; (ⅳ)easily functionalized cavities;(Ⅴ)large-scale synthesis,and so on[9-10].
Dyes,one of the organic pollutants,have a chemically stable structure (usually aromatic and conjugated)and hence remain chemically inert towards light,heat,and oxidizing agents.These dyes are also nonbiodegradable,toxic,carcinogenic,and mutagenic by nature[11-18].Thus,for environmental remediation,the removal of injurious organic aromatic dyes from the water stream is extremely desirable.Semiconductorbased photocatalysis is a flourishing approach to degrade dyes because it has simplified operation procedures,consumes low energy,does not generate secondary pollution,has high efficiency,and has environmentfriendly features.Such semiconductor-based photocatalytic technique is a heterogeneous catalysis process under light irradiation.It allows the one-pot elimination of contaminants from wastewater and can efficiently mineralize aromatic pollutants,especially dyes to liberate H2O and CO2as the final product[19].Similarly,adsorption to remove dyes in water is simple and convenient,without secondary pollution[20].
So MOFs have been investigated for the removal of dye contaminants in water,not only as selective adsorbent but also as a platform for dye degradation through catalytic processes[21].From the first reported MOF in the adsorptive removal of a dye (methyl orange,MO)from water in 2010,or the first MOF in the catalytic degradation of a dye (MO) in water in 2007,many MOFs and their modified materials have been used to remove dyes from wastewater,such as Fe3O4-ES/ZIF-8(adsorption capacity 64.50 mg·g-1for MO),MOF-5(adsorption capacities 64.50 mg·g-1for MO),[Zn6(IDC)4(OH)2(Hprz)2] (photocatalytic degradation efficiency 96%for methylene blue)and MIL-101(Cr)@GO(photocatalytic degradation efficiency 96% for methylene blue)[22-28].These MOFs not only exhibit high adsorption or photocatalytic degradation efficiencies but can also be used in sustainable recycling.Since MOFs have shown great potential in dye removal from the aquatic environment,it is urgent to synthesize MOFs-based adsorbent/catalyst with other properties.As far as we know,MOF materials for both adsorption and catalytic degradation of dyes have not been reported.
Based on the above situation,we expect new 3D Cu-MOF material with semiconductor properties and permanent porosity to be an advanced catalyst and adsorbent in aqueous solutions (Scheme 1).So,we selected the flexible 1,4-phenylenediacetic acid(H2ppda) and the rigid 1,3,5-tris(1-imidazolyl) benzene(tib) as polytopic bridging organic linkers,and Cu (Ⅱ)ions as metallic nodes,synthesizing one new 3D MOF [Cu3(ppda)3(tib)2(H2O)4]·6H2O (Cu-MOF).Singlecrystal X-ray diffraction analysis reveals that the ppda2-and tib ligands alternately link Cu ions to form 2D polymeric layers,then layers and layers interpenetrate each other by flexible ppda2-to form a 3D supramolecular structure.This Cu-MOF has excellent thermal stability,semiconductor properties,porous,and enormous structures,suggesting the possibility of adsorption and catalyst performance.Commendably,it exhibits a high-performance adsorption rate under dark conditions and a high degradation efficiency of methylene blue (MB) under visible light irradiation,because its surface area can provide high percentages of the exposed active site.The main adsorption and degradation mechanisms were thoroughly analyzed,and the experiment influencing factors,i.e.,reaction time,ionic strength,and reusability were analyzed synthetically.
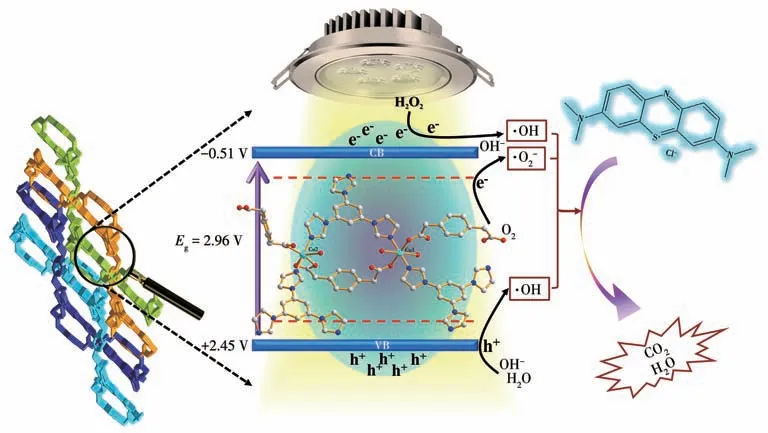
Scheme 1 Schematic diagram of degradation of MB in porous Cu-MOF material
This work introduced syntheses,designing strategies and structures of MOF,and plausible mechanistic pathways adopting which this Cu-MOF displays photocatalytic degradation and adsorption of organic molecules in particular organic dyes which are usually present in wastewater discharge from industries.
1 Experimental
1.1 Materials and general methods
All reagents (AR) are commercially available.The crystal synthesis method was hydrothermal synthesis.Elemental analyses were performed by Flash 2000 organic elemental analyzer.Powder X-ray diffraction(PXRD)patterns were acquired on XRD-7000 Advance X-ray powder diffractometer and the main characterization conditions were an operating voltage of 40 kV,current of 40 mA,CuKαas the radiation source,wavelength of 0.154 nm and scanning range of 5° to 60°.Single crystal diffraction analysis was carried out on a Bruker SMART APEX CCD diffractometer equipped with graphite monochromatic MoKαradiation (λ=0.071 073 nm).UV-Vis absorption and UV-Vis DRS(diffuse reflection spectrometry) spectrum were carried out on a UV-Vis spectrophotometer (UV-2700 and UV-2600).The photocatalytic reaction experiment was performed in the photocatalytic reactor of Nanjing Xujiang Mechanical and Electrical Factory.The THZ-82A water bath thermostatic oscillator of Jiangsu Shenglan Instrument Manufacturing Limited company was used in the adsorption experiment.Thermal gravimetric analysis (TGA) was performed by an instrument TA Q550 thermogravimetric analyzer.ζpotential measurement was undertaken on Malvern Zetasizer Nano ZS90.
1.2 Synthesis of Cu-MOF and single-crystal X-ray diffraction
A mixture of H2ppda (19.4 mg,0.1 mmol),Cu(OAc)2·H2O (19.9 mg,0.1 mmol),tib (27.6 mg,0.1 mmol),buffer solution of pH=5 (HAc/NaAc,4 mL) and isopropanol (1 mL) was put in a 20 mL glass bottle.The mixture was heated for 3 d at 95 ℃,then cooled to room temperature,and filtered to obtain the blue crystals.Elemental analysis Calcd.for C60H68N12O22Cu3(%):C 48.05,H 4.57,N 11.21; Found(%): C 48.21,H 4.63,N 11.30.IR(KBr pellet,cm-1):3 440 m,3 133 w,2 280 w,1 624 s,1 564 s,1 513 m,1 366 s,1 069 m,1 014 w,755 m,658 w.
The crystal structure was solved by SHELXS -2014 direct methods[29-30].Table S1 and S2 (Supporting information) list respectively the structural analysis data and selected bond angles and bond distances.
CCDC:2219373.
2 Results and discussion
2.1 Crystal structure
Single-crystal X-ray diffraction analysis shows that Cu-MOF belongs to the monoclinic crystal system with theP21/nspace group.The Cu1 and Cu2 atoms lie in distorted octahedral coordination geometry,and are coordinated with two nitrogen atoms of two tib ligands and four oxygen atoms from ppda2-ligands and water molecules(Fig.1a).Three Cu(Ⅱ)ions and two tib ligands form a 1D layered arrangement running parallel to the crystallographicbaxis.Two samecis-ppda2-(Fig.S2)and onetrans-ppda2-ligands alternately link Cu(Ⅱ)ions to form an ordered 1D wave chain,and these 1D chains run regularly through the 1D layered arrangement to form 2D polymeric ribbon motifs (Fig.1b).The layer and layer interpenetrate each other bytrans-ppda2-to form a stable 3D structure(Fig.1c).
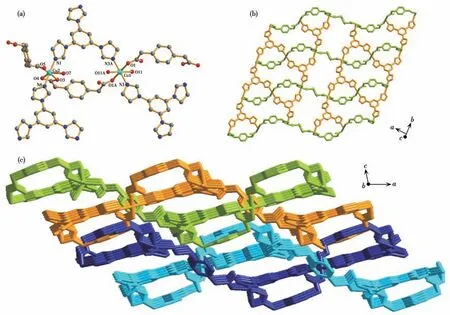
Fig.1 (a)View of local coordination environment of Cu(Ⅱ)ion in Cu-MOF;(b)2D layer formed by linking Cu(Ⅱ)ions,ppda2-and tib ligands together in Cu-MOF(chains and tape show different colors for clarity);(c)View of 3D extended supramolecular network in Cu-MOF(layers show different colors for clarity)
2.2 Structure characterization
PXRD patterns reveal that the dominant diffraction peaks of Cu-MOF fitted well with the simulated diffraction peaks,indicating its successful preparation(Fig.S3a).TGA curve shows that Cu-MOF lost the crystalline and coordinated water molecules during the temperature range of 25 to 100 ℃and the framework could maintain at a temperature of 227 ℃.It shows the thermal stability of Cu-MOF (Fig.S3b).The optical property of Cu-MOF was investigated by the UV-Vis DRS method.The absorption peak of Cu-MOF was at 303 nm (Fig.S4a),and the band gap energy (Eg) of Cu-MOF was 2.96 eV based on the Kubelka-Munk equation(Fig.S4b,Eq.S3),indicating that Cu-MOF has the nature of a semiconductor.
The adsorption and desorption of N2isotherms were measured by the static volume method of the aperture and specific surface area tester.As shown in Fig.S3c,the N2adsorption-desorption isotherm of Cu-MOF was a type Ⅱisotherm.The molecules were adsorbed in a monolayer,saturated at the first inflection point,and then the adsorption layer began to accumulate.Through the Brunauer-Emmett-Teller (BET) method,the specific surface area of Cu-MOF was then obtained as 18 m2·g-1,and the pore size distribution of Cu-MOF was evaluated using nitrogen adsorption - desorption data by Horvath-Kawazoe (HK) methods at 77 K,indicates that there are mesopores and micropores in Cu-MOF (Fig.S3d).These data show that more active reactions or adsorption sites can be used in the material[31-32].
2.3 Photocatalytic activity of Cu-MOF
The photocatalytic degradation of the four cationic dyes MB,rhodamine B (RhB),MO,and basic fuchsin(BF) was studied under visible-light irradiation in the presence of Cu-MOF.Firstly,the mass concentrations of the four dyes (10 mg·L-1)almost did not change with the increase of time when no catalyst was added (Fig.S5a-S5d),so the self-degradation of the dyes was negligible.Secondly,when H2O2(1.0 mL,30%) was added to the four dyes,the degradation efficiency of the dye was slightly higher (Fig.S6a-S6d),because H2O2as an oxidant can provide hydroxyl radical (·OH),which can serve as an active substance for the degradation of the dye[33-34].Thirdly,Cu-MOF (20 mg) was added to the solution of the four dyes (10 mg·L-1),and the dye degradation efficiency was increased obviously (Fig.S7a-S7d).Fourthly,when Cu-MOF (20 mg) and H2O2(1.0 mL,30%) were both added to the reaction systems (20 mL,10 mg·L-1),it showed a better degradation performance compared to the previous no catalyst and no H2O2,only H2O2,and only catalyst situations (Fig.S8a-S8c).We added 20 mg of Cu(OAc)2·H2O into the MB solution (20 mL,10 mg·L-1) and the degradation efficiency was 5.0% after 3 h by photocatalytic degradation.The degradation effect was found to be insignificant by comparison (Fig.S9).These results suggested that Cu-MOF is a promising photocatalyst for organic pollutant degradation.
The relationship between degradation efficiency and time is listed in Fig.2a and S10.In comparison,Cu-MOF exhibited the highest photocatalysis performance toward MB in the presence of H2O2.The equilibrium of adsorption and desorption was reached after the dark reaction for 30 min,then the color of MB gradually faded with the increase of irradiation time.After 180 min of irradiation,the degradation efficiency of MB was 97%,which meant that the synergistic effect between Cu-MOF and H2O2had a significant effect on the degradation of MB (Fig.2b).Because the photocatalytic activity of Cu-MOF helps H2O2to produce more ·OH active substances,and then performs better oxidative degradation of dye molecules.At the same time,the kinetic analysis of the degradation reaction was carried out according to the pseudo-first-order kinetic model,using the equation: -ln(c/c0)=kt(Eq.1),wherecandc0are the instantaneous and initial concentration at the beginning of photocatalytic degradation of dye,tis the irradiation time,and k represents the total reaction rate constant[35].Compared with other dyes,thekof MB was the biggest(Fig.2c,2d),which reached 0.019 7 min-1.
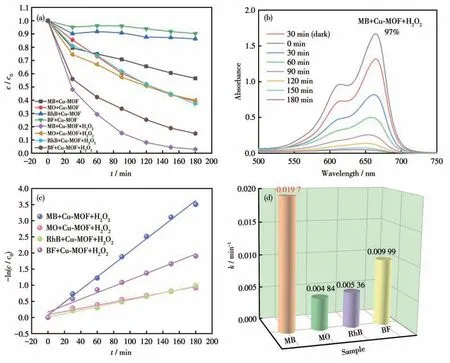
Fig.2 (a)Relationship between dye degradation efficiency and irradiation time for the dyes on Cu-MOF (+H2O2);(b)UV-Vis absorption spectra of the mixed solution of Cu-MOF,H2O2,and MB changed with time;(c)Plots of-ln(c/c0)vs t for the photodegradation of the dyes on Cu-MOF in the presence of H2O2;(d)Reaction rate constants(k)of the photodegradation of the dyes on Cu-MOF in the presence of H2O2
2.4 Photocatalytic degradation mechanism
As shown in Fig.3a,Cu-MOF still had a high degradation efficiency for MB after five cycles,indicating it has good reusability.In addition,the PXRD patterns of Cu-MOF before degradation,after degradation,and after five degradation cycles were compared (Fig.S11),and the diffraction peak positions were largely consistent.It shows that the structure of Cu-MOF has good stability and reusability[36].The electrochemical impedance spectroscopy(EIS)analysis was implemented(Fig.S12).Then the role of electrons and holes in photocatalytic degradation was investigated by a free radical trapping experiment[37].p-Benzoquinone (PBQ,·O2-scavenger),tert-butanol (TBA,·OH scavenger),AgNO3(e-scavenger),and EDTA-2Na(h+scavenger)were added to capture the reaction species.In the presence of scavengers,the degradation efficiency of Cu-MOF on MB decreased from 97% to 82%,34%,74%,and 65%,respectively (Fig.3b).The photocatalytic degradation efficiency was inhibited to different degrees,indicating that these substances made a certain contribution in the catalytic process.
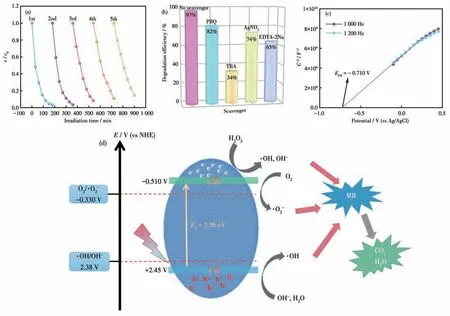
Fig.3 (a)Changes in the degradation efficiency of the photodegradation of the dyes on Cu-MOF in the presence of H2O2 after 1-5 degradation cycles under the Xenon lamp(500 W);(b)Histogram of degradation efficiency of the photodegradation of the dyes on Cu-MOF in the presence of H2O2 after adding the scavengers;(c)EFB obtained by Mott-Schottky measurements(1 000 and 1 200 Hz);(d)Photocatalytic degradation mechanism diagram
Mott-Schottky measurements were used to further investigate the active substances.As shown in Fig.3c,the flat band potential (EFB) of Cu-MOF was -0.71 V(vs Ag/AgCl) by extrapolation.The positive slope of the tangent line indicates that Cu-MOF is an n-type semiconductor and the conduction band potential (ECB) of Cu-MOF is close to the flat band potential (EFB).TheECBof Cu-MOF was-0.51 V(vs NHE),which was higher than O2/·O2-potential (-0.33 V (vs NHE))[38].The results showed that the photogenerated electrons on CB of Cu-MOF may generate superoxide radicals during the photocatalytic degradation of MB.The valence band potential (EVB) of Cu-MOF was calculated to be 2.45 V (vs NHE) from its band gap.This value was higher than the reduction potential of ·OH/OH-(2.38 V (vs NHE))[39].Based on the above experimental results,a possible photocatalytic mechanism was proposed.Under the excitation of visible light,Cu-MOF surface occurs electron transition and generates electron-hole pair (e-reacts with oxygen to generate ·O2-,hydrogen peroxide reacts with e-to generate ·OH,water molecules and OH-react with h+to generate ·OH,respectively).Finally,h+,·OH,and ·O2-are used as active substances in the reaction to degrade the MB molecule(Fig.3d)[40-41].
The main products were presumed to be carbon dioxide and water,and we verified the conjecture through HCO3-detection (Fig.S13).Firstly,1 mol·L-1CaCl2solution was added to the degraded filtrate,and no significant change was observed.Then 0.5 mol·L-1NaOH solution was added,and a white precipitate was found,which confirmed that CO2produced in the degraded solution dissolved in water to form HCO3-.
Combined with the above results,the reaction equation of photocatalytic degradation of MB is as follows:
Cu-MOF+hν→Cu-MOF(e-+h+)
O2+e-→·O2-
H2O2+e-→·OH+OH
H2O+h+→·OH
OH-+h+→·OH
·O2-+MB →other products →CO2+H2O
·OH+MB →other products →CO2+H2O
2.5 Adsorption property analysis
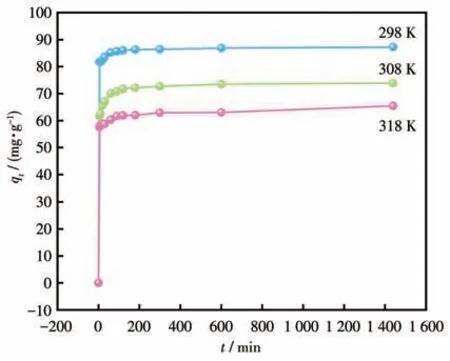
After the photocatalytic degradation experiment,we explored the adsorption effect of Cu-MOF on dyes.As shown in Fig.S14,when Cu-MOF was added to different dyes,the adsorption capacity of Cu-MOF on MB was the largest.However,the adsorption capacity of Cu-MOF was not high.According to theζpotential of Cu-MOF (Fig.S15),the surface presented a positive charge when pH=3-9,and MB belongs to the cationic dye,so the electrostatic interaction between Cu-MOF and MB led to a poor adsorption effect.However,in the influence experiment of strong ions,it was found that the adsorption capacity of Cu-MOF increased after adding NaCl.When NaCl mas concentration was 200 g·L-1,the adsorption capacity of Cu-MOF reached 87.23 mg·g-1.Therefore,the detailed adsorption behavior of Cu-MOF toward MB was studied.As can be seen from Fig.4,the adsorption capacity of Cu-MOF for MB increased with time after adding NaCl at 298 K.When the time reached 300 min,the adsorption capacity of Cu-MOF reached equilibrium[42],the adsorption was in a state of saturation and the adsorption capacity of Cu-MOF didn′t change significantly until 1 440 min[43-44].
Adsorption kinetics can not only estimate the adsorption capacity but also determine the adsorption process.Three dynamic models (Eq.S4-S6) were used to fit the data and study the adsorption reaction type[45].
The fitting conditions of the three dynamic models are shown in Fig.5,and the value ofR2for Eq.S5 was larger compared to Eq.S4.These data fitted Eq.S5,indicating that the adsorption process was mainly chemisorption (Table 1)[46].Then the control step in the adsorption process was explained by fitting the intraparticle diffusion model (Fig.5c).The first segment was the process of MB molecules moving on the surface of Cu-MOF,followed by the entry of MB molecules from the outer surface of Cu-MOF into the inner pore,and the third segment was that MB molecules gradually occupied the active site of Cu-MOF with time increased and the adsorption process reached saturation.The slope of this segment was lower compared to the other two segments,indicating that it is the control step of the whole adsorption process[47-48].
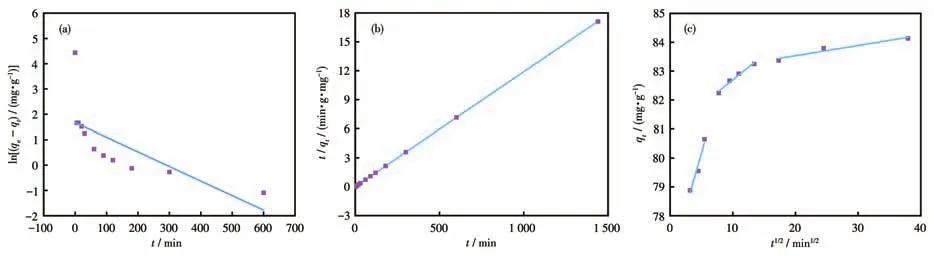
Fig.5 (a)Pseudo-first-order kinetic model,(b)pseudo-second-order kinetic model,and(c)intra-particle diffusion model of MB adsorption by Cu-MOF
Then the effect of different concentrations of MB(5-40 mg·L-1) on the adsorption capacity of Cu-MOF was investigated.The increase in MB concentration provided the driving force for Cu-MOF and the adsorption capacity of Cu-MOF gradually increased(Fig.6)[49-51].
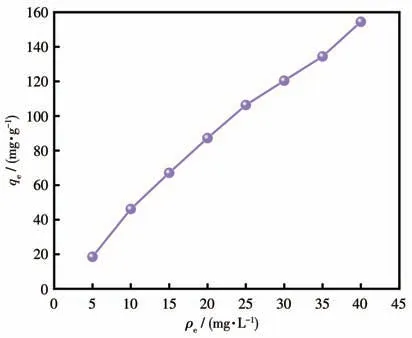
Fig.6 Adsorption properties of Cu-MOF at different MB initial concentrations
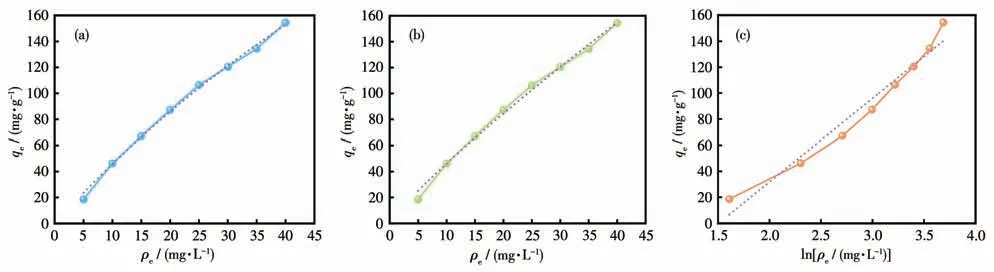
Then we fitted the equilibrium relationship between MB concentration (ρe) and the adsorption capacity of Cu-MOF (qe) using three isotherm models(Eq.S7-S9)[52].
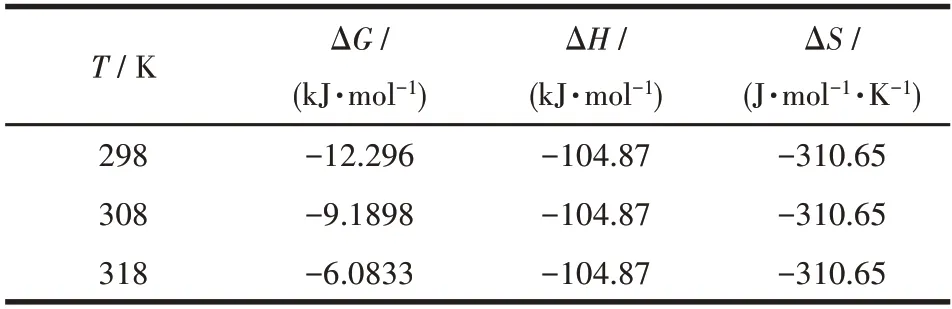
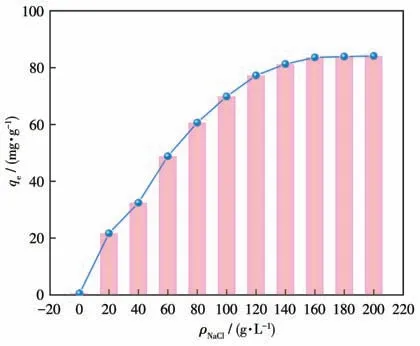
The Langmuir model represented that there was no interaction between the adsorbents,which was monolayer adsorption that occurred on the adsorbent surface.The Freundlich model was used to describe adsorbent surfaces that were non-homogeneous and had adsorption sites of different energies[53].The fitting of the three models is shown in Fig.7.The nonlinear correlation coefficient (R2) of the Langmuir model was closer to 1.00 compared to the other two models,which was the best fit for the data (Table 2).This indicates that the adsorption process is mainly monolayer adsorption.The separation factor (RL) was used to calculate the adsorption capacity of Cu-MOF:whereρ0(mg·L-1) is the initial MB concentration.The value ofRLin this experiment was 0.877,indicating that the adsorption behavior was favorable(0 Table 2 Langmuir,Freundlich,and Temkin isotherms parameters of MB adsorption by Cu-MOF Fig.7 (a)Langmuir model,(b)Freundlich model,and(c)Temkin model for MB adsorption by Cu-MOF We then investigated the effect of temperature on the adsorption process by selecting temperatures of 298,308,and 318 K to observe the change in adsorption capacity(Fig.8).The graph showed that the adsorption capacity of Cu-MOF decreased as the temperature increased,so the adsorption process was further explored using thermodynamic parameters.Gibbs free energy (ΔG),enthalpy change (ΔH),and entropy change (ΔS) could be calculated from the slope and intercept of the plot of lnKdvs 1/T(Fig.S16) by using the Eq.S10-S13[55-59]. Fig.8 Adsorption performance of Cu-MOF in the presence of NaCl for MB at different temperatures As shown in Table 3,the ΔGwas always less than zero,a negative value of ΔHindicates that the adsorption process is exothermic.The ΔSwas negative indicating that the adsorption process became gradually ordered and the whole adsorption process was an exothermic spontaneous process. Table 3 Thermodynamic parameters for adsorption MB adsorption by Cu-MOF The co-existence ions had a certain effect on MB adsorption by Cu-MOF.As shown in Fig.9,MB adsorption was significantly improved when different concentrations of NaCl were added to MB and Cu-MOF solution.This may be due to the salt ion effect[60].After adding the strong electrolyte NaCl to the solution,the concentration of total ions increased,the interaction between ions was enhanced,the degree of dissociation increased,and the adsorption process of MB by Cu-MOF was promoted.When the concentration of NaCl reached a certain value,the MB adsorbed by Cu-MOF were in a saturated state,and their adsorption capacity reached a stable value[61-63]. Fig.9 Effect of ion concentration on MB adsorption byCu-MOF In summary,complex Cu-MOF has been synthesized successfully under hydrothermal conditions by the reaction of Cu(Ⅱ)salt and 1,3,5-tris(1-imidazolyl)benzene(tib)in the presence of flexible phenylenediacetate (H2ppda).In Cu-MOF,Cu(Ⅱ)ions and tib ligands form a 1D belt,two samecis-ppda2-and onetransppda2-ligands alternately link Cu (Ⅱ)ions to form an ordered 1D wave chain,and these 1D chains run regularly through the 1D belt to form the 2D surface.The adjacent 2D surfaces are interpenetrated bytransppda2-to form a stable 3D structure (SBET=18 m2·g-1).The results reveal that Cu-MOF possessed a higher photocatalytic degradation efficiency toward MB for having semiconductor properties.The main photocatalytic degradation mechanism is the separation of the electron and hole pair of the catalyst under the excitation of the xenon lamp,and the redox reaction occurs to produce the active material to degrade the dye and eventually decompose into carbon dioxide and water.Furthermore,the adsorption performance of Cu-MOF to MB was studied.The maximum adsorption capacity was 87.23 mg·g-1(ρNaCl=200 g·L-1,T=298 K).The adsorption isotherms were described accurately by the Langmuir model,indicating a monolayer adsorption process.It′s also a spontaneous process of decreasing entropy.This study expands the number of 3D MOFs available for restoring the safety of water environments. Supporting information is available at http://www.wjhxxb.cn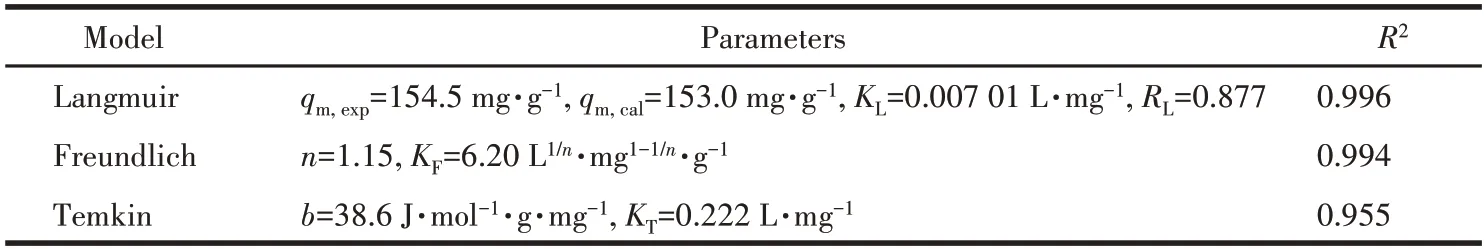
3 Conclusions
