基于傅里叶叠层显微成像术的定量相干传递函数恢复
2023-10-08陈佳铭潘安王爱业马彩文姚保利
陈佳铭,潘安,王爱业,马彩文,姚保利
(1 中国科学院西安光学精密机械研究所 瞬态光学与光子技术国家重点实验室, 西安 710119)
(2 中国科学院大学, 北京 100094)
(3 中国科学院空间精密测量技术重点实验室, 西安 710119)
0 Introduction
The performance of an optical imaging system is typically characterized by the intensity Point Spread Function(PSF) or Optical Transfer Function (OTF)[1]. But the Coherent Transfer Function (CTF) is better for describing the coherent optical imaging system[2]. The autocorrelation of the CTF is the OTF. It is easy to get PSF or OTF if CTF is known, but CTF can not be obtained directly through PSF due to the loss of phase. The CTF can be easily modified to include theoretically known aberrations, such as those induced by index-mismatched mounting media, simply by multiplying the CTF with a calculated aberration function, which can then produce the intensity PSF that contains both these aberrations and the microscope-specific information[3,4]. Though the CTF characterize the complex amplitude transfer properties of the light field, it is hard to measure compared with PSF.
Fourier Ptychographic Microscopy (FPM)[5-9], combining the concept of aperture synthesis[10-12]and phase retrieval[13-15], is a recently developed imaging technique that allows the reconstruction of high-resolution complex images with an extended Field Of View (FOV). By acquiring a series of low-resolution brightfield and darkfield images under inclined illumination and stitching them together in the Fourier domain, FPM can break through the frequency limit of the employed objective determined by its Numerical Aperture (NA).Consequently, the Space-bandwidth Product (SBP) of the optical imaging system can be effectively increased without precise mechanical scanning. The flexibility with low-cost hardware requirements makes FPM a powerful tool particularly potential for imaging biomedical samples in the field of digital pathology. Currently, it has evolved from a simple microscope technique to a general problem-solving framework for diverse research communities, including WSI systems[16], circulating tumor cell analysis[17], drug screening[18-19], label-free(single shot) high-throughput imaging in situ[20-22], retina imaging[23], 3D imaging[24-26], wafer detection[27],high-resolution optical field imaging[28], optical cryptosystem[29-30], and remote sensing[10-11].
However, the performance of FPM reconstruction critically depends on the quality of the original data.The reconstruction suffers a lot from the artifacts caused by various kinds of systematic errors. Recently, a series of correction and optimization algorithms have been invented and complemented to deal with the issue.OU X et al. presented Embedded Pupil Function Recovery Fourier Ptychographic Microscopy (EPRY-FPM )algorithm[31]based on the concept of Alternating Projection (AP), which involves the correction process of CTF in object reconstruction. The effect of aberrations on the reconstruction results is effectively eliminated so that an aberration-free quantitative phase image can be obtained. Positioning Correction Fourier Ptychographic Microscopy (PC-FPM)[32], based on the concept of simulated annealing linear regression, can digitally correct position errors in current FPM platforms. ZUO C et al. proposed an adaptive step-size strategy[33], which utilizes a decreasing step-size for the iterative update and showed great potential for noise removal. PAN A et al. analyzed the interaction between multiple systematic errors and invented System Calibration Method for Fourier Ptychographic Microscopy (SC-FPM)[34-35]algorithm to deal with mixed errors from a global perspective. The above-mentioned methods only focus on the improvement of object function caused by error correction. Whether these systematic errors will shift to CTF has not received enough attention. If CTF can be quantitatively obtained, coherent optical systems can be systematically characterized, which goes beyond the purpose of traditional FPM.
In this article, we proved the robustness of CTF based on error correction simulations, which provides a theoretical foundation for quantitative calculation. Based on this conclusion, we proposed a sub-region translation strategy of FPM, termed Sub-region Translation Fourier Ptychographic Microscopy (ST-FPM)method, which allows higher-quality pupil reconstruction within a finite number of iterations even when the number of captured images is limited. It has been proved that the method is well suited for grid noise removal generally existing in the reconstruction of transparent samples. And it can realize image refocusing without adjusting the aberration correction term when the defocus distance is changed. Additionally, images deconvoluted by the reconstructed pupil functions present a significant improvement of contrast compared with the originally collected incoherent images because ST-FPM obtains extra redundant information from adjacent sub-fields when reconstructing pupil function. In addition, we explored the spatial and spectrum data redundancy of FPM to retrieve CTF and found at least approximately 40% overlap rate is required for accuracy reconstructions of CTF, which is 10% higher than aberration-free condition. And 25 raw images are required at least for the stability of CTF. Finally, we discussed the conditions required for stable CTF reconstruction and validated the conclusions in simulations and experiments.
1 Methods
1.1 FPM principles
The LED array of a typical FPM system is utilized for multiple-angle illumination. Assuming that a sufficiently thin sample with transmittanceo(x,y) is illuminated by a monochromatic plane wave,the resulting exit wave from the sample is given byo(x,y), where(x,y),(kx,m,n,ky,m,n) denote two-dimensional spatial coordinates in the sample and illumination wave vector corresponding to the LED in rowm, columnnrespectively. After passing through the objective lens, the exit wave is Fourier transformed to the frequency domain and then confined by the pupil functionP(kx,ky),where (kx,ky) is the transformed frequency coordinates inx,ydirections. The CTF is the conversion of coordinates of pupil function. The intensity image captured by the sensor is thus given by
Information contained in images acquired under different illumination angles can be synthesized through an iterative phase retrieval process to generate high-resolution object images including both amplitude and phase properties.
We built an experimental FPM platform composed of a programmable 32×32 LED array with 4 mm adjacent distance, a 4×/0.1 NA objective lens, and a 16-bits digital camera(1 280×960 pixels, 3.75 μm).All high-resolution complex images are reconstructed using the sequential Gauss-Newton algorithm[32]invented by Tian et al. The initial guess is the starting value of the object function at the beginning of the iterative algorithm.The closer the initial guess is to the real object function, the faster the iterative algorithm will achieve convergence.The initial guess does not affect the final results when data redundancy is sufficient. To improve the convergence speed and reduce the number of iterations, the image sampled from the low-resolution image under normal incidence is used as the initial intensity guess of the object. NA order is selected as the update sequence of sub-pupils in the Fourier domain, which starts at the center of the Fourier space and then gradually expands outwards.
1.2 Influence of systematic error on CTF
Although FPM shows great prospects for high-resolution image reconstruction with large FOV, some systematic errors will inevitably cause artifacts in images, posing a great challenge to the quality of reconstruction. Fig. 1 shows the reconstruction results when various systematic errors are added to the simulation, including aberrations, brightness fluctuation, parameter imperfection, noise, and mixed error.Here, brightness fluctuation is reflected in the uneven intensity of captured images, and parameter imperfection refers to the mismatch of model parameters at the ideal position of LED array due to measurement error or limited measurement accuracy. System noise mainly includes Gaussian white noise and Poisson noise. Gaussian noise obeys normal distribution and Poisson noise obeys random distribution. The noise in the images we collected is mainly the reading noise during photoelectric signal conversion, which can be modeled as Gaussian noise. To our knowledge, Poisson distribution can be approximated to Gaussian distribution when the arrival rate of photons is high enough. Therefore, only the results after adding Gaussian noise are shown here. RMSE and SSIM are selected as the quantitative criterion to evaluate the reconstruction performance. RMSE is defined by

Fig.1 Simulation results of FPM reconstruction with several systematic errors added in
wheref(x,y) is reconstructed image,g(x,y) is referenced image,X×Yis the pixels of image. The closer RMSE is to 0, the closer the reconstruction quality of the image is to the true value, and the better the reconstruction quality is[33]. Structural Similarity (SSIM) measures the extent to which the spatial structural information is close between two images, which is widely used in digital image processing and analysis. The SSIM index is given by
wherexandyare two virtual nonnegative images, which have been aligned with each other,uxandσxdenote the mean intensity and standard deviation (the square root of variance), respectively, of the image vectorx,andσxyrepresents the correlation coefficient between two image vectors,xandy. ConstantsC1andC2are included to avoid instability when these statistics are very close to zero. The SSIM index ranges from 0 to 1 and higher value indicates that two images are of more similar structural information. The lower right corner of the simulation result is RMSE and the upper right corner is SSIM.
It can be seen that both the reconstructed images and pupil functions are contaminated with irregular artifacts to varying degrees compared with ground truth. Existing optimization methods are generally designed for improving the reconstruction quality of object functions. We wonder whether the process will produce undesirable influence on pupil reconstruction. Therefore, we then utilize multiple optimization and correction methods to deal with these systematic errors. As shown in Fig.2, EPRY-FPM[31], modified intensity correction method[34], PC-FPM[32], adaptive step-size strategy[33]and SC-FPM[34-35]are respectively chosen. It is obvious that artifacts introduced by all kinds of systematic errors are effectively suppressed. The quality of reconstructed pupils is also improved instead of deteriorated, while the optimization targeted at object function is not directly involved in the update of pupil function. This indicates that the pupil function is robust enough and can be used for quantitative calculation.

Fig.2 Simulation results of systematic error correction with multiple algorithms
1.3 Sub-region translation FPM
Periodic LED illumination often results in grid noise in FPM reconstruction, especially for transparent samples[34]. One typical solution is to modify the distance between adjacent LEDs, which eliminates the spatial periodicity of LED array. However, the modification of LED structure costs are high. According to the robustness of pupil function, we propose a sub-region translation scheme of FPM to address the interference of grid noise without adjustment to the illumination setup.
As shown in Fig.3, the full FOV is firstly divided into several sub-regions. According to the order ①~⑤, each sub-region is translated with a fixed number of pixels in four directions. After each translation, an iterative reconstruction procedure is performed on the sub-region. The reconstructed pupil phase of the former subregion serves as the initial phase guess of the latter sub-region, while the pupil amplitude remains unchanged. In section 1.2, we proved the robustness of pupil function, thus the pupil functions of neighboring sub-regions are of high similarity. Constraints between neighboring sub-regions decrease the error of pupil reconstruction during the iterations.

Fig.3 Diagram of sub-region translation FPM for pupil reconstruction
It should be emphasized that block processing is almost a compulsory option to be performed. On the one hand, LED illumination strictly belongs to spherical wave illumination due to its large divergence. When the sample is not placed far away from the light source, the illumination cannot be approximated to plane wave illumination. However, the approximation is established for a sub-region after block processing, thus the limitation of illumination distance can be relaxed. On the other hand, hundreds of captured images produce large data amounts and calculation burdens. Block processing helps to improve computation efficiency and can be used for parallel operation. The influence of coherence and vignetting effect is also non-negligible.
2 Results
When imaging transparent samples, phase information can be obtained quantitatively through traditional FPM. However, the periodic LED array used in lighting will cause obvious grid noise artifacts in phase image and pipul, which greatly affects the quantitative phase acquisition ability of FPM. At present, an existing solution is to use a non-uniform LED illumination array to solve the grid noise artifact by deviating the translational symmetry of sampling. However, this scheme needs to design a special LED array, which is expensive and not universal. In this part, ST-FPM algorithm is used to eliminate grid noise artifacts. In order to examine the grid noise removal performance of ST-FPM method, we compared the reconstruction results of a transparent Sigma Star sample using the traditional method and ST-FPM method in Fig.4. It is hard to identify the details of the transparent sample from the reconstructed amplitude images. According to the magnified images of the reconstructed phase, obvious grid noise can be found in the result obtained from traditional method reconstruction due to the illumination of periodically arranged LED array. Also in terms of pupil function, both the amplitude and phase express clear grid noise. After the use of ST-FPM method, grid noise in object function and pupil function is effectively eliminated because the deviation of sub-region translation dilutes the periodic grid. The results conform to our theoretical analysis that more redundant information can be obtained through iterations of adjacent sub-regions after translation, and finally a better pupil function can be reconstructed.

Fig.4 Comparison of grid noise removal from sigma star transparent sample
Different from coma or astigmatism, defocus is very unique among all kinds of aberrations because it is not caused by inherent physical defects in optical imaging systems. In a “perfect” optical system, defocus aberration can still appear as long as the target sample deviates from the original focal plane of the optical system. At present, an existing method is to “digitally refocus” the image by numerically zeroing the defocus aberration[36].This is done by multiplying the defocus phase term by the pupil function and the spectrum of the sample in each iteration of FPM reconstruction. This means that the aberration correction term needs to be adjusted when the defocus distance is changed and the digital focal plane is placed in a different position. Also, the whole original dataset needs to be reprocessed and updated during FPM phase recovery iterations.
Here, we proved that ST-FPM can realize image refocusing without the tedious adjustment. To examine the refocus ability of ST-FPM method, We compared the reconstruction results of a label-free U2OS sample using the traditional method and ST-FPM method in Fig.5 with only 25 images (the number of images required will be discussed in section 3.1). A quantitative phase image of the observed biological sample is obtained during the initial few iterations, which features an improved resolution compared with the raw data. The selected subregion is then translated successively according to the scheme in section 1.3. As the iterations run, the reconstructed pupil phase gradually recovers from defocus and finally comes to a stable result. The first picture in Fig.5 shows the defocused phase reconstructed by traditional FPM and the corresponding defocus aberration with a wrong defocus distance. And we can find that the defocus aberration overrides other aberrations. The final picture in Fig.5 shows the real defocus aberration using ST-FPM and the corresponding focused phase. The video 1 in supplementary visualizes the complete process of our proposed ST-FPM method.

Fig.5 Comparison of focusing from U2OS sample
Another intriguing application of ST-FPM method is to improve the contrast of images after performing a deconvolution operation on the obtained pupil function. We collected the images of the USAF target for pupil reconstruction using the illumination of central 5×5 LEDs. Figure 10 compares the images obtained after deconvolution with the original image collected with all LEDs lit up. Fig.6 plot the grayscale value curves along the green dotted line section in the 200×200 pixels magnified images. Wider-range fluctuation indicates higher contrast of images. Fringe visibilityVMis selected as the quantitative criterion to evaluate the contrast and defined by
whereImaxis the maximum intensity of the grayscale value,Iminis the minimum intensity of the grayscale value.
Both pupil functions reconstructed by traditional method and ST-FPM method enhance the contrast of images after deconvolution, with a larger improvement by ST-FPM. Traditional FPM obtains redundant information by synthesizing NA, which improves the contrast of the image. On this basis, ST-FPM can obtain extra redundant information from adjacent sub-fields when reconstructing pupil function, which results in higher contrast.
3 Discussions
3.1 Conditions required to reconstruct a stable CTF
FPM reconstruction requires a series of low-resolution intensity images whose corresponding sub-apertures are overlapping in the frequency domain. Spectral overlapping rate is defined by the ratio of the overlapping area of two adjacent CTFs to the area of a single aperture and can be calculated by
where NAobjis the NA of objective,Stis the increasing step size of NA illumination. It is proved that at least 30% spectral overlapping rate is required for stable reconstruction of object function without downsampling[37]. IfRoverlapis smaller than 30%, the spectrum redundancy would be insufficient for accurately recovering the intensity and phase information simultaneously. In the simulation, we attempted to explore appropriate values of spectral overlapping rate for stable CTF reconstruction. Fig.7(a) show the CTF reconstruction results of different spectral overlapping rates when the spatial sampling rate is set as 0.97 and 1.94 respectively. The curves in Fig.7(b) describe the effect of spectral overlapping rate on CTF reconstruction for five typical values of the spatial sampling rate. Here, the spatial sampling rate is defined as

Fig.7 Simulation results of the influence of spatial sampling rate and spectral overlapping rate on CTF reconstruction
whereλis the wavelength of the illumination,Mis the magnification of objective, and Δxis the pixel size of the camera. Higher spectral overlapping rates provide better CTF reconstruction quality, and increasing the spatial sampling rate can reduce the spectral overlapping rate required for stable CTF reconstruction. Overall,reconstruct a stable CTF requires at least approximately 40% spectral overlapping rate.
The captured data amount and convergence performance of reconstruction algorithms also have influence on reconstruction quality. Fig. 8 clearly shows how the two factors act on CTF reconstruction in simulations,where two typical values of overlapping rate are chosen both with a 4×/0.1 NA objective for data acquisition.The results reveal that CTF phase can be better reconstructed with more images collected when the number of iteration is fixed. Increasing the number of iterations can compensate for the impact of using fewer images to some extent. When the spectral overlapping rate is higher, less additional redundant information can be obtained, thus larger number of images and iterations are required to achieve desirable performance of CTF reconstruction. At least approximately 40% spectral overlapping rate and 25 captured low-resolution intensity images are required to achieve desirable reconstruction.

Fig.8 Simulation results of the influence of captured image number and iteration number on CTF reconstruction
In the experiment, central 17×17 LEDs of the array provide an illumination of 518 nm wavelength. Since the interval between adjacent LEDs is fixed, the illumination height should be adjusted to obtain different values of spectral overlapping rate. Fig. 9 gives the experimental verification results following the simulations as shown in Fig. 8. Because the background truth value of CTF is unknown, we are only concerned about its trend. The varying trend of reconstructed pupil with spectral overlapping rate, the number of iterations, and the number of acquired images is approximately consistent with that in the simulations.
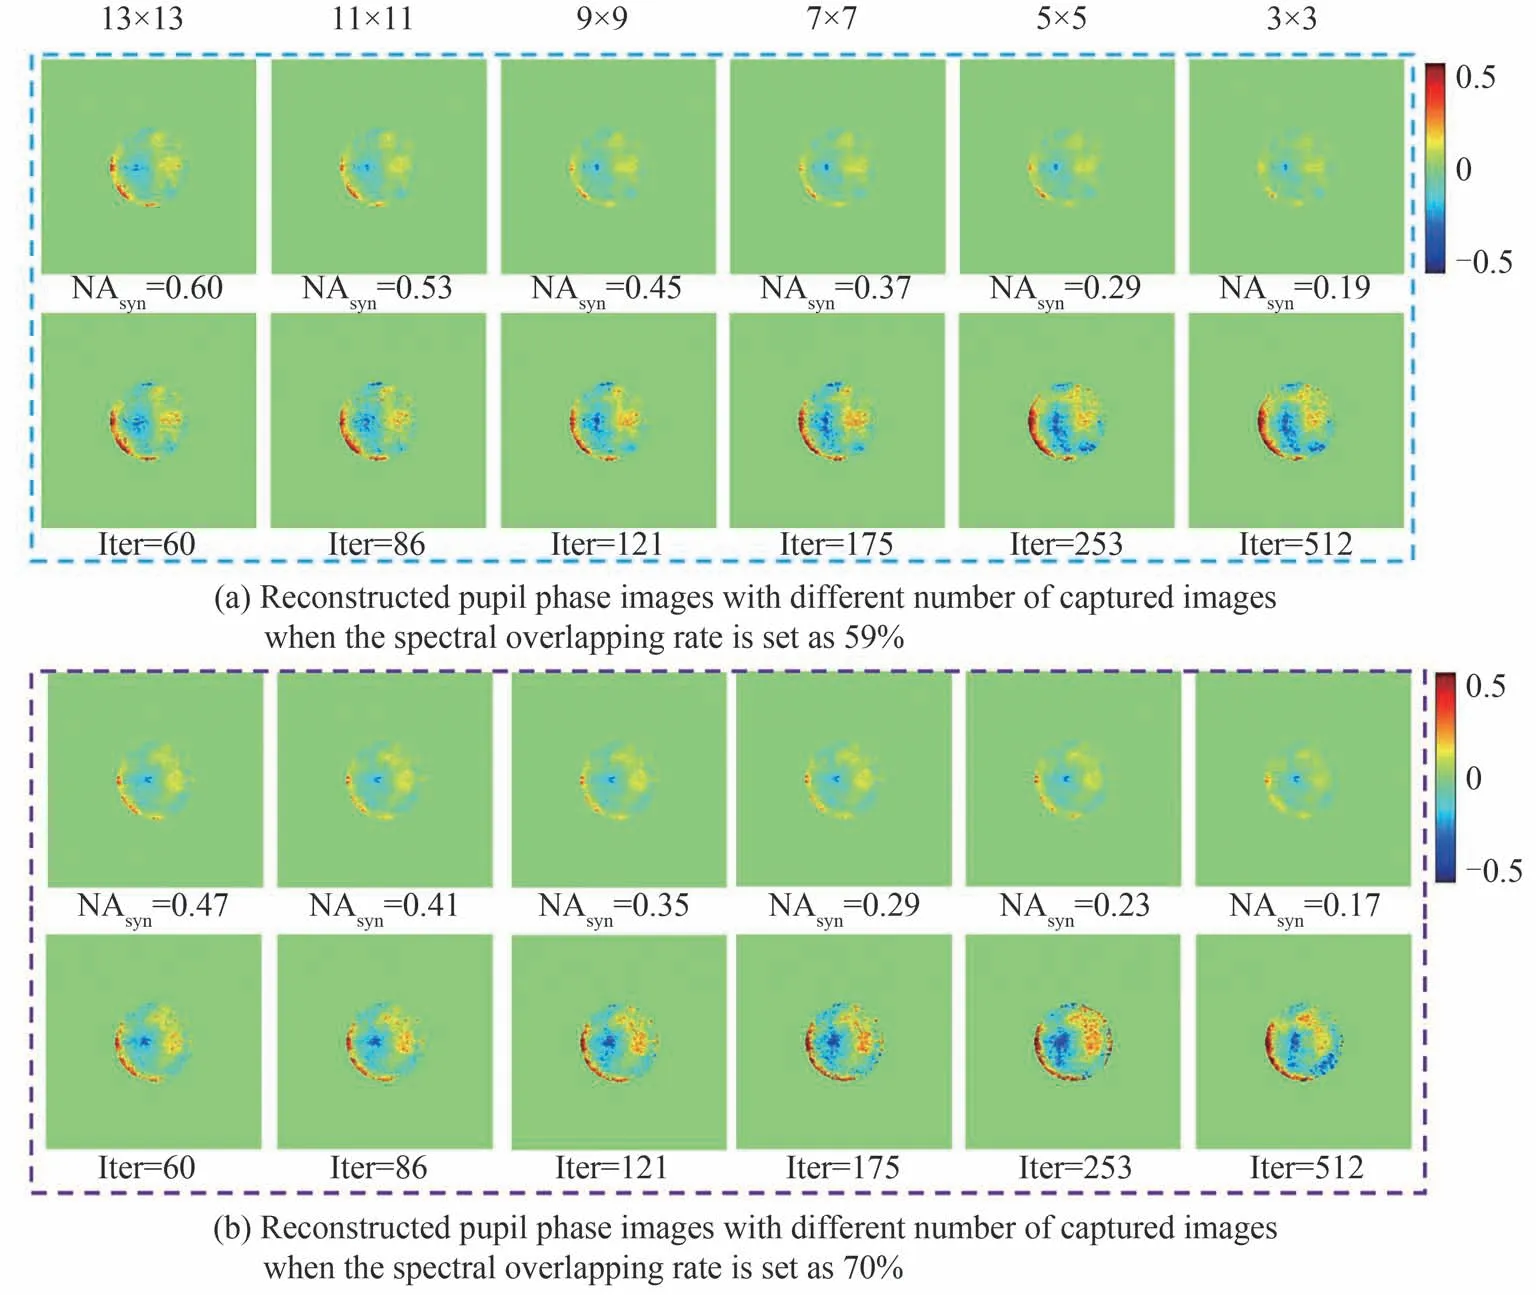
Fig.9 Experimental results of the influence of captured image number and iteration number on CTF reconstruction
3.2 Preferences of ST-FPM method
We originally designed three translation schemes for ST-FPM method: 2-direction translation, 4-direction translation, and 8-direction translation. With more translation directions, the time required for reconstruction is longer. The order of different directions has almost no effect on the result. We choose to uniformly select the translation order in Fig3. We simulated to determine the optimal choice of translation direction and distance so that a good balance can be achieved between reconstruction quality and cost of time.For each translation scheme, we set the translation distance ranging from 5%~50% pixels of the sub-region size. The central 5×5 LEDs are utilized for data acquisition and the iterative reconstruction algorithm runs for a fixed number of 120 times. Fig. 10 compares the pupil functions reconstructed from three schemes of ST-FPM method. In general, more translation directions result in better reconstruction performance, while the translation distance is not an influencing factor. The improvement from 4-direction to 8-direction is relatively limited compared with that shifting from 2-direction to 4-direction. As the third reconstruction result of Fig.10(b) achieves the lowest value of RMSE in 4-direction simulations, we select 4-direction translation with 15% pixels distance as the optimal scheme in the experimental verification.

Fig.10 Pupil images reconstructed by three schemes of ST-FPM with 5%~50% pixels translation distances in simulations
4 Conclusion
In this work, the influence of systematic errors on FPM pupil recovery is investigated. Although currently available correction and optimization algorithms targeted at object reconstruction do not directly involve the update of pupil function, the quality of reconstructed pupil is still improved. Therefore, pupil function is robust during iterations and can be used for quantitative calculation. Based on this conclusion, we proposed a subregion translation strategy of FPM, termed ST-FPM method, which allows higher-quality pupil reconstruction within a finite number of iterations even when the number of captured images is limited. It has been proved that the method is well suited for grid noise removal generally existing in the reconstruction of transparent samples.And it can focus the defocused image without adjusting the aberration correction term every time the defocus distance is changed. Additionally, images deconvoluted by the reconstructed pupil functions present a significant improvement of contrast compared with the originally collected incoherent images. Compared with traditional FPM, ST-FPM can obtain extra redundant information from adjacent sub-fields when reconstructing pupil function, which results in higher contrast.
We also studied the conditions required for stable CTF reconstruction in FPM. In terms of information redundancy, at least approximately 40% spectral overlapping rate achieves desirable reconstruction results without oversampling. And 25 raw images are required at least for the stability of CTF. Three factors, including spectral overlapping rate, the number of captured images, and iteration number, produce mutual trade-offs for CTF reconstruction. CTF can be better reconstructed with more images collected when the iteration number is fixed. Increasing the iteration number compensates for the shortcoming caused by using fewer images. When the spectral overlapping rate is higher, less information redundancy can be obtained, thus larger number of images and iterations are required to reconstruct CTF stably.
It should be noted that we obtained a higher contrast image by deconvolution of pupil function, which only indirectly proved that ST-FPM quantitatively recovered the correct CTF. The CTF still needs to be measured directly by the traditional wavefront detection method for comparison.
