Twin model-based fault detection and tolerance approach for in-core self-powered neutron detectors
2023-09-18JingChenYanZhenLuHaoJiangWeiQingLinYongXu
Jing Chen · Yan-Zhen Lu · Hao Jiang · Wei-Qing Lin · Yong Xu
Abstract The in-core self-powered neutron detector (SPND) acts as a key measuring device for the monitoring of parameters and evaluation of the operating conditions of nuclear reactors.Prompt detection and tolerance of faulty SPNDs are indispensable for reliable reactor management.To completely extract the correlated state information of SPNDs, we constructed a twin model based on a generalized regression neural network (GRNN) that represents the common relationships among overall signals.Faulty SPNDs were determined because of the functional concordance of the twin model and real monitoring systems, which calculated the error probability distribution between the model outputs and real values.Fault detection follows a tolerance phase to reinforce the stability of the twin model in the case of massive failures.A weighted K-nearest neighbor model was employed to reasonably reconstruct the values of the faulty signals and guarantee data purity.The experimental evaluation of the proposed method showed promising results, with excellent output consistency and high detection accuracy for both single- and multiple-point faulty SPNDs.For unexpected excessive failures, the proposed tolerance approach can efficiently repair fault behaviors and enhance the prediction performance of the twin model.
Keywords Self-powered neutron detector · Twin model · Fault detection · Fault tolerance · Generalized regression neural network · Nuclear power plant
1 Introduction
Neutron flux is an important variable in nuclear reactors.Monitoring the variation and distribution of the neutron flux is essential to maintain the power stability of nuclear reactors [1].At present, self-powered neutron detectors(SPNDs) are widely employed in-core neutron flux measurement systems (CNFMS) of nuclear power plants (NPPs) to accurately measure neutron flux and provide highly reliable three-dimensional (3D) power distribution information.However, the risk of failure has increased with the increasing scale and complexity of the control of modern nuclear reactors [2].
Faulty SPNDs that either completely or partially fail provide incorrect monitoring information, which may negatively affect both the simple and more advanced functionalities of the system, resulting in degradation of the overall system performance and an increased risk level [3].Techniques to address these problems can be classified as hardware redundancy methods, model-based methods, and data-driven methods [4, 5].Generally, hardware redundancy measures in which more than three SPNDs are installed to observe the neutron flux within a range of space are employed for NPPs to improve the reliability of CNFMS.Assuming that any one SPND in a neutron measurement channel fails, the additional SPNDs still function and maintain high-accuracy measurements.Although this measure can prevent occasional intermittent failures from negatively affecting the system, the inability to implement fault tolerance can lead to false perceptions of the performance of the CNFMS when redundant SPNDs fail simultaneously.Moreover, redundant SPNDs continue to incur high installation and maintenance costs, which adversely affect the economics of NPPs [6].
Popular model-based methods (such as Kalman filtering[7], mixed Kullback-Leibler divergence and exponential weighted moving average [8], high-gain observer [9], the Monte Carlo method [10], and extended state observer[11]) handle fault detection using simple mathematical models that formulate fault signatures.The results of these methods for specific nonlinear systems have been developed under various restrictive assumptions.Recently, datadriven methods [12-14] have been used to perform fault detection for kernel equipment in NPPs; the main principle is to establish an object model based on data analyses and realize accurate detection using model outputs with constraints of the evaluation criteria [15].Peng et al.[3]constructed mathematical models for various detectors using principal component analysis (PCA) and achieved fault detection and isolation for SPNDs through the square prediction error of linear models and the detector validity index based on the reconstruction.Yellapu et al.[16]developed a method based on multiscale PCA with wavelet transform to reduce the modeling cost and improve the sensor fault diagnosis results by calculating the wavelet approximation coefficient.An online multiscale data reconciliation scheme for detecting and isolating sensor faults in advanced heavy-water reactors was proposed in[17]; the scheme achieved high accuracy under different scenarios.Li et al.[18] employed two different fault identification methods to locate faults more accurately.One was an improved weighted contribution analysis method based on the traditional contribution analysis of sensors toQstatistics.The second method was based on the sensor validity index obtained using the iterative reconstruction method.However, static linear models are typically unable to detect long-term SPND faults.To improve the detection efficiency of practical time-varying faults, Chatterjee et al.[19] proposed the use of instantaneous cluster statistics to normalize the measurements of each SPND in clusters and update the PCA model using normalized values.This approach resulted in lower false alarm rates and higher detection rates for real-time fault changes than traditional static models.Experimental results show that these approaches are useful in identifying faulty instruments.Yu et al.[20] proposed improvements to the traditional PCA model through a new corrected reconstruction algorithm to reconstruct the principal component and the residual space.A cyclic PCA monitoring model was established to accurately detect different types of faults and reconstruct fault data.Nageswara et al.[21] performed information fusion by combining the ensemble of trees and the support vector machine (SVM) algorithm to evaluate the calculation error of multiple sensors and the influence of complementary and redundant sensors.Most studies have failed to focus on the inherent correlation among all SPND signals in the overall detector assemblies.For the dozens of SPNDs existing in neutron flux measurement channels, challenges in information integration and correlation analysis remain because of difficulties in handling large amounts of data simultaneously.
As a new enabling technology, digital twin (DT) can act as a mirror of the real world by providing an integrated environment for simulating, decision-making, and optimizing physical system operations [22, 23].Because of the powerful computing capabilities and cognitive intelligence of DT, developing more refined and scalable models for fault detection has become possible.Lin et al.[24] developed a nearly autonomous management and control (NAMAC) system for advanced nuclear reactors with DT technology.Cai et al.[25] proposed analytical techniques based on data and information fusion for modeling and developing DT virtual machine tools.DT applications in the context of NPPs have proliferated recently [26-28].The development of DT combined with advanced technologies for detection, control, and optimization can significantly improve system performance,reliability, availability, maintainability, and operational flexibility.Therefore, efficient in-core SPND fault detection and the maintenance of monitoring systems using twin technologies are our major objectives.To continue such interesting exploration of research on SPND signals, a twin model using DT technology was constructed for the parameter analysis of an in-core nuclear reactor with large monitoring data and complex and changeable operating conditions.In this case,the established twin model can extract rich values from isolated time-varying data without disturbing the equipment on the real physical layer and can simulate the real-time state and dynamic characteristics of SPND entities through interactive data, overcoming the problem that traditional mathematical models [29] cannot effectively deduce the fault state of multidimensional signals in real time.In addition, several researchers have devoted their attention to state analysis and to the design of DT models of key nuclear reactor components.Hu et al.[30] comprehensively described the research status and development directions of DT technology in the field of advanced nuclear energy, proposed a multidimensional evaluation digital model suitable for application in nuclear reactors, and preliminarily established the fault diagnosis process.Wang et al.[31] proposed a DT system of the out-of-core detector assisted with an installation robot to perform real-time visualization monitoring of the detector installation and replacement process.Gong et al.[32]combined reduced-order models with machine learning to create physics-based DTs using parameters input in real time to rapidly reconstruct the neutron field in the core.Cancemi et al.[33] generated primary nuclear components through numerical simulation of different plant conditions, which may support the predictive maintenance optimization based on plant condition and the development of a DT model for improving plant safety and availability.
Because the implementation of the twin model significantly depends on the information transferred from valid data [34], the frequent and unexpected fault behaviors of SPNDs only provide unrepresentative data, leading to serious distortions in the outcomes and even the unprecedented collapse of the twin model.The decision made after calculations based on a large amount of incorrect information fails to realize the entire purpose of maintaining normal system function.Most recent research methods have focused on fault detection, and only a limited amount of research has been conducted to simultaneously achieve fault tolerance in critical detectors at NPPs.This is one of the principal motivations for this work.Designing a reasonable faulttolerance strategy that would work uninterruptedly with sufficient information-processing capabilities is practically challenging.Li et al.[35] suggested an active fault-tolerance control method based on the improved BP neural network,which controls fault sensors by reconstruction.Kim et al.[36] developed a method of evaluating the fault detection coverage of a fault-tolerant technique using a fault injection experiment in a safety-critical digital I &C system for NPPs.They also proposed a probabilistic safety assessment model to observe the effect of the fault detection coverage of faulttolerant techniques.To enhance the stability of a modular high-temperature gas-cooled reactor system and the control rod drive mechanism, Hui et al.[37] proposed an adaptive fault-tolerant control scheme based on a radial basis function neural network, which has a higher load tracking accuracy and better fault tolerance to systems.Li et al.[38] proposed an active fault-tolerant control scheme based on the deep Q-network algorithm of reinforcement learning to maintain the stability of the once-through steam generator control system.Rangegowda et al.[39] introduced a fault-tolerance control framework to arrest the performance degradation of conventional controllers in the presence of sensor bias.Clearly, appropriate fault-tolerance operations are required to handle the incorrect information provided by failed equipment, which can ensure data purity and no interference for the normal performance of the twin model.Therefore, introducing an appropriate fault-tolerance strategy to SPND fault detection is advantageous to maintain a healthy interaction of data information and pave the way for reliable outputs of the twin model in the long term.
In this study, we propose an effective fault detection and tolerance approach for in-core SPNDs based on a twin model.The SPNDs are uniformly distributed in the reactor core; a generalized regression neural network (GRNN) [40]is employed to construct the twin model, which is consistent with the real system and represents the common relationship between the overall signals.In this manner, the state correlation between the SPND signals is completely considered, and the output characteristics of specific SPND individuals can be described using the joint feature information of the surrounding SPNDs.Then, state analysis and fault detection of the SPNDs were realized by analyzing the probability distribution of errors between the outputs of the twin model and the real value.To achieve fault tolerance for unexpected faulty SPNDs, we used a weighted k-nearest neighbor (WKNN) [41] to recover and reconstruct faulty signals.Through troubleshooting, data substitution, and data verification of faulty SPNDs, the accuracy and rationality of the detection results can be significantly improved.Compared with the traditional single-signal analysis model, the proposed approach can detect multi-point faults more simply and efficiently.
The remainder of this paper is organized as follows:Sect.2 provides a brief description of the measurement channel distribution of the neutron flux and the composition of the SPND.Section 3 describes the construction scheme of the twin model and the specific framework for fault detection and tolerance.The experimental results and discussion are presented in Sect.4.Finally, the conclusions of the proposed framework are provided in Sect.5.
2 Brief description of SPND
An in-core neutron instrument is one of the most important types of nuclear power equipment.SPNDs provide a crucial basis for neutron flux measurement for safe operation,treatment of abnormal working conditions, and post-accident monitoring of NPPs.In this study, an integrated core instrument casing assembly was used in a pressurized water reactor for third-generation NPPs.As shown in Fig.1, the core contains 44 radially distributed measurement channels.In each channel, a core detector assembly that is installed in the instrument tube of the fuel assembly contains seven axially distributed SPNDs in equidistant layers.
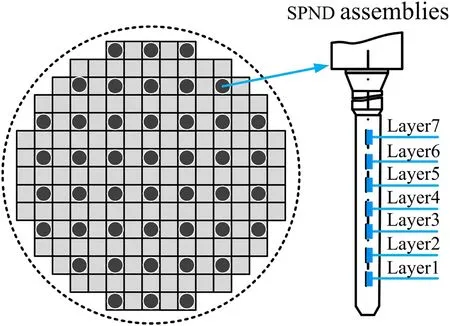
Fig.1 Distribution of the neutron flux measurement channels
SPNDs have been developed to meet the requirements of small size, long life, and high tolerance to harsh environments.The composition of SPNDs is shown in Fig.2,which mainly consists of an emitter, an insulator, and a collector.The communication line is constructed using a twocore cable in the form of armor and measures the currents generated by the emitter and noise currents caused by the background core.The currents are then transmitted to the processing cabinets through the connector and transmission cable.Because the noise currents are very small, they can be ignored.Generally, rhodium SPNDs are used in pressurized water reactor NPPs.The main generation process of SPND currents is determined by the radiation capture reaction, which proceeds in the emitter material45Rh103with the generation and subsequent disintegration of the induced beta-active isotope45Rh104.Then, the beta particles induced by disintegration escape from the emitter with a certain probability and are collected by the collector, leading to the emitter becoming positively charged.Thus, the currents are proportional to the neutron flux absorbed at the location of the SPND emitter in the reactor.
3 Methodology
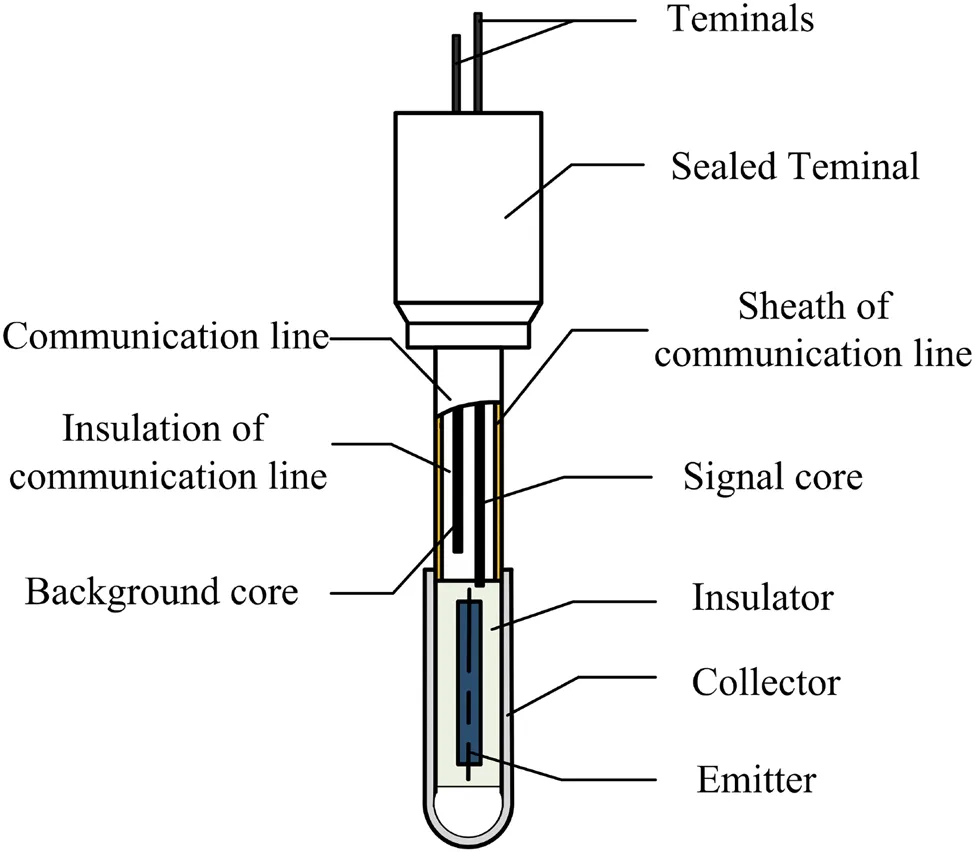
Fig.2 Composition of SPND
The purpose of this study is to use the twin model to enhance SPND detection performance.The main goal of the DT model is to create a mirror image of the physical entities in the digital realm by observing the data features and intrinsic correlation information among real SPND signals.In this study, we conducted a further state analysis of the current signals generated by radially distributed SPNDs on the plane of the reactor core of a specific NPP.As shown in Fig.3,nSPNDs are uniformly arranged on the cross section of the in-core vessel.Each SPND is responsible for the neutron radiation capture reaction in the relevant space range, which results inngroups of recorded current signals.Each datatwinning procedure for an SPND requires signal analysis of a particular SPND by observing the signal values of the othern-1 SPNDs.Therefore, the remainingn-1 SPND signals are used as model input characteristic variables, including a particular SPND label variable, prior to model training.We can obtainnsets of data patterns with related feature and label variables for each SPND.Subsequently, a GRNN is employed to train and learn the input variables in the data patterns, and the internal correlation among the SPNDs can be explained through the adaptivity of the neural network.We can obtainnsets of submodels, where the features of the label SPND variable are related to the features of the neighboring SPNDs.By integratingnsubmodels, we obtain an organic whole, which is an SPND twin model.Using the twin model, the errors between the model outputs and actual signals are calculated to achieve SPND fault detection.The model identifies outliers in the error sequence in combination with the generalized extreme studentized deviate (ESD)statistical test [42], which provides rapid SPND fault detection results.A fault-tolerance strategy should be introduced,the foundation of which is data recovery for fault variables in response to excessive fault variables that result in the failure of fault detection.Fault signals are replaced with normal values through constant troubleshooting, data substitution,and data validation, and the performance of the twin model is recovered.When all faulty SPNDs are successfully identified, the detection results can assist in diagnostic decisions that can be made to maintain real detector assemblies.
3.1 Generalized regression neural network
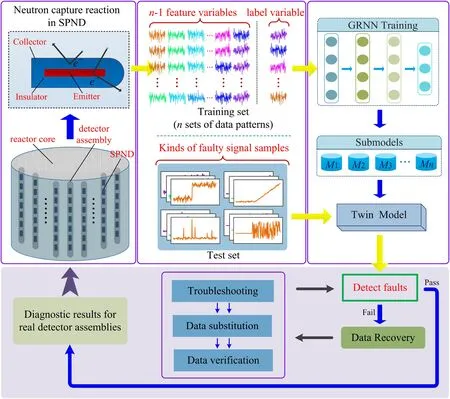
Fig.3 (Color online) The framework of the proposed SPND fault detection and tolerance method
To deal with sample data comprising complicated multidimensional variables, prior research concentrated on PCA,clustering, and Kalman filter methods to perform signal analysis of the SPND unit.These techniques can be used to rapidly establish models for axial SPNDs in the same detector assembly.In this study, we aimed to analyze the spatial correlation between the radially distributed SPND variables simultaneously in the plane of the reactor core.The aforementioned technique is not appropriate for largescale and nonlinear data feature mining; however, the latest neural network algorithms that an distribute information among neurons have significant robustness and can quickly analyze complex nonlinear relationships.As a typical radial basis neural network model based on nonlinear regression theory, GRNN can process high-dimensional data and mine the mutual effects among multiple SPND current features because of its capabilities of nonlinear mapping and high learning speed.Unlike other types of artificial neural networks, GRNN has straightforward structures and training processes.Therefore, we used GRNN as the constituent architecture of the SPND twin model.As shown in Fig.4,the GRNN is composed of the input, pattern, summation, and output layers.The input and output vectors of the corresponding network areX=[x1,x2,…,xn-1]TandY=[y1,y2,…,yk]T,n-1 andkare the dimensions ofXandY, respectively.The number of neurons in the input layer is equal to the dimensions of the input vector, and each neuron is a simple distribution unit that directly transmits the input to the pattern layer.The pattern layer is a radial base layer,whose number of neurons is equal to the number of learning samples,n-1.The neuron transfer functionPiis typically a Gaussian function and can be written as follows:
whereXiis the training sample corresponding to thei-th neuron,Tis the transpose of the matrix, andσis a smoothing factor.The smallerσis, the stronger is the approximation ability ofPifor the samples.
There are two types of neuronal calculation formulas in the summation layer.One is to sum the outputs of all the neurons in the pattern layer.The connection weight between each neuron and the pattern layer is set to one.The transfer function can be expressed as follows:
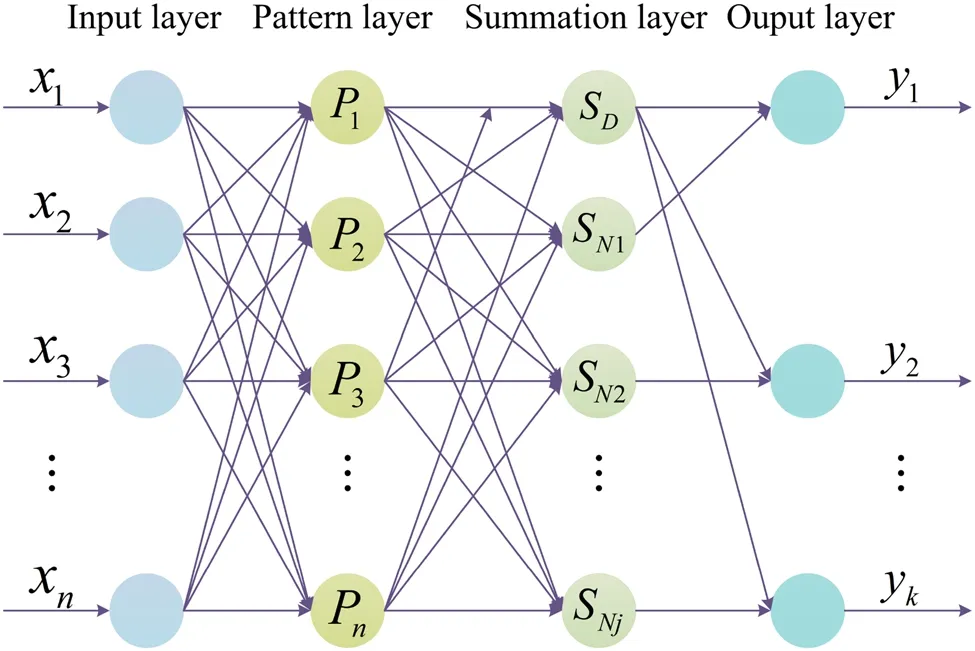
Fig.4 Structure of the GRNN
The other type of calculation formula is to sum the outputs of all neurons in the pattern layer by weight.The transfer function can be described as
wherewijrepresents the weight of thei-th neuron in the pattern layer connected to thej-th neuron element in the summation layer, andSMjrepresents the summation value of thej-th neuron in the summation layer.
The output layer is calculated by dividing the values obtained using the two formulas in the summation layer based on the following equation:
whereyjis the output of thej-th output-layer neuron.
GRNN can be applied to construct different SPND regression submodels that are integrated to form a twin model that outputs twin data.
3.2 Construction of the twin model

Fig.5 Network of relationship Ui(S)
The state analysis of SPND signals with the application of DT can provide a more efficient and intelligent service for monitoring the neutron flux distribution and its rate.The premise of constructing a twin model is to extract sufficient and effective feature information from physical entities.The reactor core containsnsets of symmetrically distributed neutron flux measurement detector assemblies.Although SPNDs operate independently of each other, the multidimensional currents they produce reveal a strong cooperative link in a shared environment.The features of the nearby signals reflect the characteristics of a specific SPND signal.The relationship between SPND signals can be explained by the following equations:
whereSis the set of all SPND individuals at the same height in the reactor core,Dis the set of sample values for each variable inS, andUis the set used to denote the correlations between the variables.Ui(S) describes how the signal characteristics of any variable inSare collectively represented by the remanent surrounding variables.As seen in Fig.5,the reference networkUi(S) is expressed as the connectivity between the label variable and other variables.The data of the label variable can be twinned by analyzing the network of relationships among the variables.By studying the characteristics of the associated {s1,s2,…,sn-1} , the inherent information of the label variables can be obtained.Thus,each variable inScan also be collectively described by the others.The twin model is built based on relationship networks, and GRNN is used to construct specific submodels to form a twin body.By dividing the setD, then-1-dimensional variables are the featuresIiand the remaining single variable is the training labelTi.After an alternate division ofngroups, the data patterns betweenIiandTiare expressed as follows.
The division result containsnrows of data patterns, and each dimensional variable of SPND signals in setDis designated as a label for its corresponding data pattern.For instance, SPNDsnis identified as the label of the first data pattern.Similarly, SPNDsiis considered as the label of the(n+1-i)-th data pattern.To thoroughly explore the correlation between any target variable and the remaining variables in each pattern, GRNN was utilized to train the submodels to learn the state relationships between SPND features and labels.Subsequently,ngroups of submodels were built after repeated training.An integrated organismMis combined as follows:
whereMirepresents the trained GRNN submodels for different data patterns.After learning the algorithm, each GRNN submodel outputs the predicted value of the target SPND when its inputs are (n-1)-dimensional feature vectors.All submodels are combined intoM, which producesngroups of estimated data and explains the commonality of signal changes in all SPND components.The real SPND signals can be twinned using these virtual values.The residual between the output results of the twin model and the real values can be calculated in the given operating scenario to determine the faulty SPNDs, and the following status assessment and potential fault tolerance can then be performed.
3.3 Fault detection and tolerance
Measuring the residual between the outputs of the twin model and the actual values allows us to ascertain whether faults exist in the detector assemblies.Statistical tests can generally be used to determine the deviation points in a residual sequence.Traditional statistical techniques are sensitive to the presence of outliers because inaccurate data points can distort the mean and standard deviation of a data sequence.In this section, ESD was employed to detect possible outliers in the residual sequence and discriminate the fault from the original signals.ESD can maintain a good elimination effect when several anomalies exist concurrently in the data.We assumed that outliers exist in the residual sequence.The maximum number of outliers was predetermined asr, andrrounds of separate tests were performed by calculating the variable of the statistical test, the formula of which is as follows:
whereEiis an observed point, and^Eandzdenote the sample mean and standard deviation, respectively.The observed point that maximizesEi-^Eand deviates the most from the mean should be located and eliminated during the calculation.The aforementioned statistic is then recalculated using the remainingn-1 observed points.The process is repeated untilrobserved points have been removed, resulting in the obtainedrtest statisticsR1,R2, … ,Rr.Corresponding to thertest statistics,rcritical values are calculated as follows:
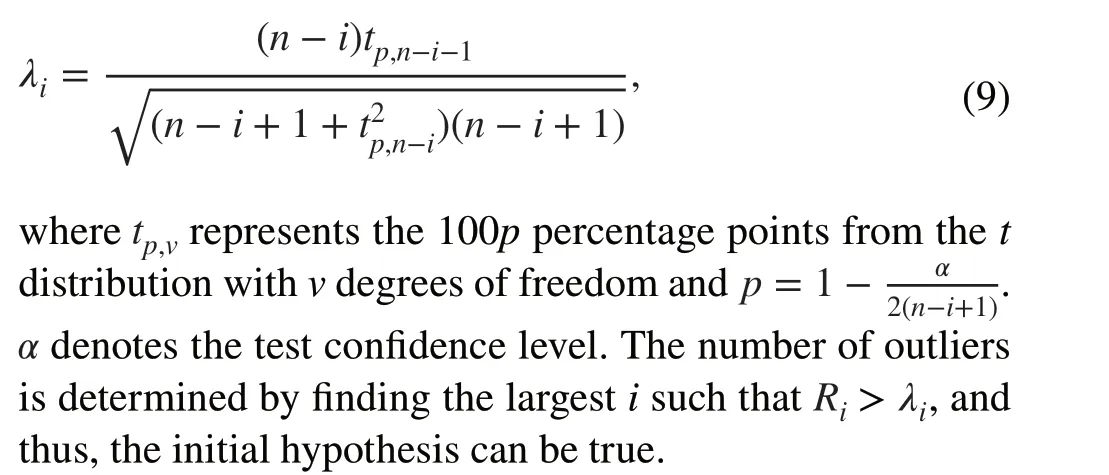
As mentioned above, the simultaneous failures of excessive SPNDs in detector assemblies can lead to anomalously measured data, which cannot accurately represent the actual operational status of the system.A judgment based on fault signals will cause the system to fail to reach its normal operating condition and even cause personnel to misoperate.The capacity of the twin model to perform an effective analysis suffers because of the disordered input, and the reliability and validity of the detection results cannot be demonstrated by the residual information calculated from a broken model.For the CNFMS to be dependable and secure, the fault detection function must be rehabilitated.In this case, we introduce an efficient fault-tolerant strategy, which is implemented before multi-fault detection.The most important factor to consider when designing a fault-tolerance solution is that the information that should be available to the entire system after an unexpected failure must be identical to the information that would have been obtained if the SPNDs were not faulty.The main objective was to achieve data recovery, including troubleshooting, data substitution, and data verification.
In the presence of multiple unknown fault sources, fault troubleshooting must be performed using multidimensional data.A possible selection approach involves selecting the vector with the largest calculated residual and performing data recovery first.When executing data substitution, the values of the faulty variables should be replaced with normal signals.To improve the accuracy of the replaced data, the KNN classifier was first used to selectKinstance points from the historical database in the nearest neighbor of the feature variable of the fault points to form a new signal sample.The operating condition ofKnearest neighbor points was the closest to that of the fault signals, and their variable characteristics were in a division range similar to the original signal characteristics.The weighted average operation was utilized for the values of theseKpoints, which produced the corrected signal values.Finally, the fault signal values were entirely replaced by the revised values.
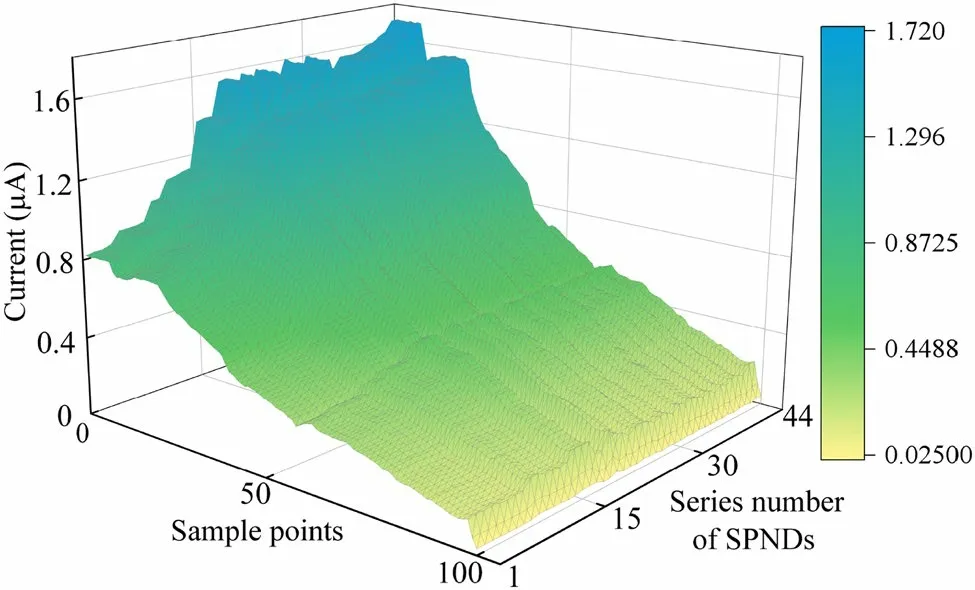
Fig.6 (Color online) SPND signals during shutdown
After data substitution, the Jensen-Shannon (JS) divergence [43] was employed to confirm the modified data and guarantee the consistency of the replacement.It can describe the differences between the probability distributions of variables, which perform well in the similarity measurement.For the two probability distributions, the interval value of the JS divergence is [0,1].The two distributions are more similar and vice versa as the value decreases.The degree of JS divergence can be used to fully evaluate the suitability of the modified data.Repeating the preceding steps for a multifault sample can reduce the number of faulty SPNDs after recovery until the detection results are satisfactory.When the satisfied sample is input into the twin model, the output is stable and controlled within a small error.In this case,the previous fault detection approach is adequate and fault tolerance is no longer required.
4 Results and Discussion
In this section, the proposed method was evaluated using historical monitoring data collected from in-core detector assemblies in a third-generation pressurized water reactor.To build a reliable SPND twin model, a sufficient number of measurement datasets must be known in advance.The variables of the 44-dimensional SPND signals, which were distributed radially in a certain layer, were considered as experimental objects in this study.To improve the generalization of the twin model, training data for the twin model were derived from the reactor shutdown stage.As shown in Fig.6, with the insertion of control rods, the power of the reactor core gradually decreased from 100% FP to 0% FP,and all the currents of SPNDs decreased.The data for the test set were derived from SPNDs during steady operation.
4.1 Performance of the twin model
With the continuous reduction in neutron flux during shutdown, the number of neutrons captured by the emitter decreased, resulting in a proportional decrease in the currents generated by the 44 SPNDs.To extract valuable information from physical SPNDs under different power levels and build a twin model based on it, submodels for 44-dimensional signal variables were executed.First, the training set was segmented round after round, and 44 groups of data patterns with several feature variablesIiand label variableTiwere obtained as follows:
Each data pattern in (IiTi) was input into GRNN for the model to learn the correlation between signal variables,and the 44 submodels were well-trained.The superiority of GRNN over the other models is ascribed to the convenience of its parameter setting.The performance of GRNN can only be changed by setting the smoothness factorσin the kernel function.To improve the accuracy of the model,the root mean square error (RMSE) was employed as the loss function to optimize the value ofσfor the submodels.Twenty percent of the training set was selected as the verification set, and a cross-verification approach was used to obtain accurate parameter optimization results.As shown in Table 1, each submodel obtained the minimum RMSE with the corresponding setting of the optimalσ.The optimized parameters helped improve the performance of the twin model in the verification set.
To demonstrate the superiority of GRNN in modeling more clearly, we compared the proposed method with several typical approaches, including convolutional neural networks (CNN),multilayer perceptron (MLP), extreme gradient boosting(XGB), decision tree (DT), SVM, and Bayesian ridge (BR).All methods were implemented using the same data samples from the test set to compare the output accuracies.As shown in Fig.7, the twin model formed by GRNN had the lowest RMSE between the model outputs and actual signal values.DT and XGBoost-based models, as common tree regression algorithms, had slightly larger errors than the GRNN-based model,which can easily overfit SPND signals and reduce precision.The learning abilities of the CNN and MLP models for SPND signal features were poorer than that of the GRNN model.These models are suitable for dominant feature extraction but tend to ignore the correlation between the part and whole.SVR- and BR-based models are appropriate for handling small samples instead of analyzing larger multidimensional signals.Compared to typical machine learning algorithms, the twin model established based on GRNN can extract rich feature information from isolated time-varying data with lower errors and higher prediction ability.In the subsequent fault detection phase, the errors between the model outputs and actual signals can be used to determine the fault location.The estimated values of the twin model can help improve the in-core power measurement by avoiding interference from fault information.

Table 1 Parameter optimization results of the 44 submodels
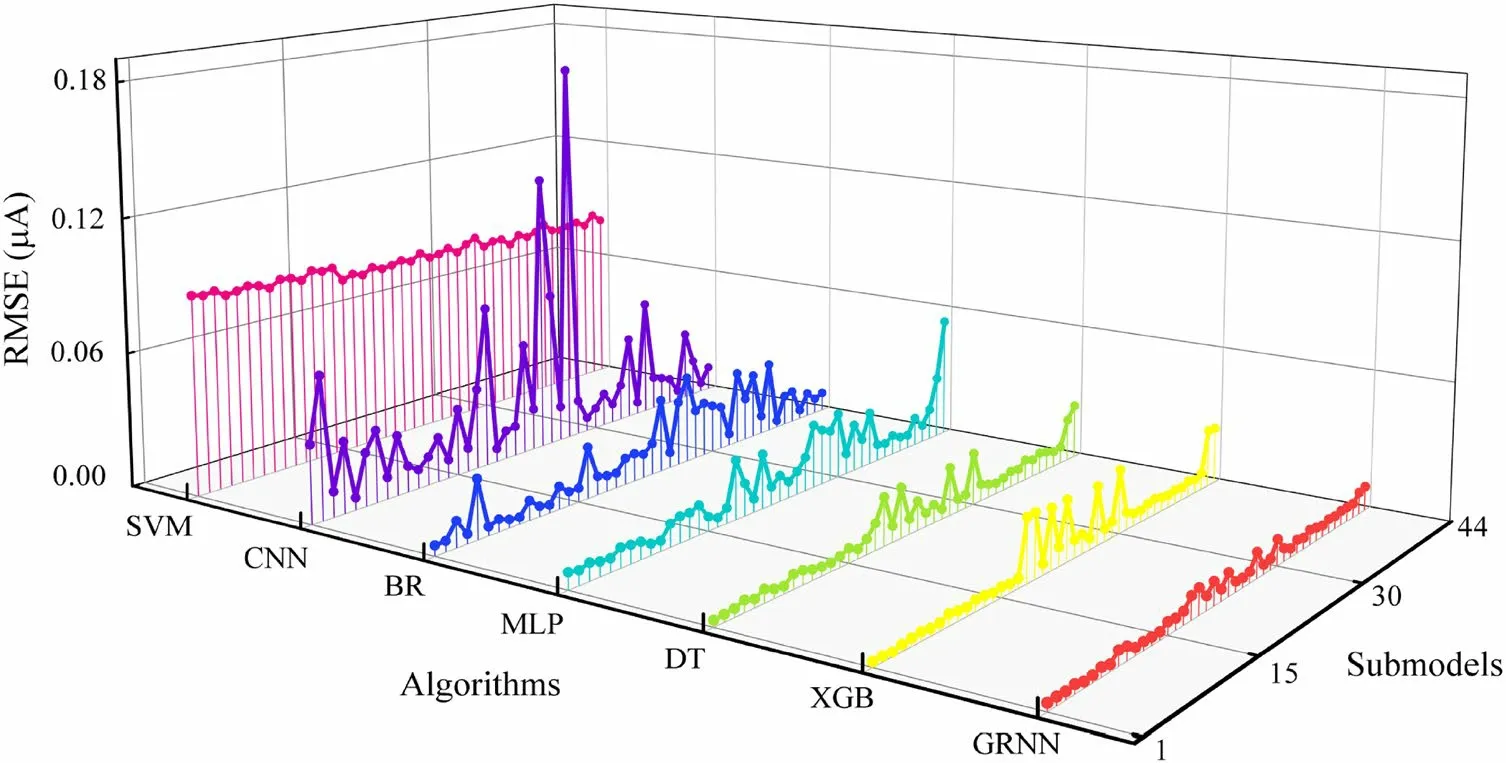
Fig.7 (Color online) Prediction errors of different algorithmbased models
4.2 Fault detection results under different conditions
The novel contribution of this study is the accurate identification of faulty SPNDs in numerous assemblies using a twin model.The signal characteristics analyzed by the twin model can help examine the fault characteristics.In this section, single- and multi-point SPND fault signals were simulated through experiments to determine the effectiveness of fault detection under different conditions.The faulty SPND signals of diverse measurement channels were simulated by adding different percentages of bias to the normal signals based on the original operating conditions.
For single-point fault detection, as shown in Fig.8, the deviation between the output of the twin model and the actual normal value is very small before introducing faults into the test set, and the data fit well.In the simulation, a bias of 50% of the normal signal value was introduced into SPND#12 at a time point after the normal signal.In this case, the twin model could maintain a normal output, but the failure of SPND#12 caused the calculated RMSE to fluctuate significantly at this point.The results of the ESD test show that the RMSE of the 12 point deviates the most, which confirms the existence of a faulty SPND#12.

Fig.8 Comparison of the output values of the twin model with the actual values and the RMSE of the models in the two cases

Table 2 Fault detection accuracy in various fault conditions
In reality, complex and changeable interference factors usually cause fault signals to vary.Different types of common fault behaviors mainly include bias, precision degradation, and complete failure, the states of which are abnormal owing to the influence of external environmental factors.The deviation in the signals also varies at the same power level that is used to measure the extent of the magnitude of failures.Experiments (15 groups × 130 rounds) were conducted to compare the fault detection efficiency under different fault types and deviation rates.The mean accuracy,an evaluation index, is the proportion of the number of successful detections in each group of experiments to the total number of experiments.Table 2 provides the calculation results for fault detection accuracy.Except for the detection accuracy of 99.23% in "5% drifting", the mean accuracies of other cases were 100%, indicating that the fault variables identified by the ESD test from errors are consistent with the actual faulty SPNDs.Therefore, the proposed method can maintain an extremely high correct detection rate for singlepoint SPND faults under various conditions.
Similarly, it is possible for multiple SPNDs to fail simultaneously.The method for detecting multi-point faults is the same as that for detecting single-point faults.However,this is still a challenge because multiple faulty signals can contaminate the input of the twin model, leading to rising nondeterminacy of the outputs.In this study, we analyzed the impact of the number of faulty SPNDs on the output of a twin model and the fault detection accuracy.Because the type and deviation rate of the failure size had little influence on the detection accuracy, the added simulated fault signals were random in the multi-point fault experiment (44 groups× 150 rounds).The experimental results and comparisons are shown in Fig.9.

Fig.9 (Color online) Influence of the number of faults on the detection accuracy of different algorithm-based models
It was observed that the accuracy of multi-point fault detection remained at 100% when the number of faulty SPNDs was less than 26.In other words, the proposed method can perform a relatively efficient detection when approximately half of the 44 SPNDs fail.As the number of failures continues to increase, the accuracy begins to gradually decrease and approaches 50%, which means that approximately half of the faulty SPNDs detected by ESD are true.Unacceptable data deviating from the normal range are the reason for the occurrence of a sharp fall.Excessive abnormal inputs strongly affect the original function of the twin model and cause it to collapse, hindering the realization of subsequent detection.With ESD test calculation, the multipoint fault detection accuracy of the models based on other algorithms declined earlier than that of GRNN-based models under identical conditions.Their accuracies decreased and slowed to different degrees with the further expansion of failure.Finally, they became more reposeful along their tails.The method proposed in this study performs well for both single- and multi-point SPND fault detection.

Fig.10 (Color online) Optimization of K in KNN and WKNN
4.3 Evaluation of fault tolerance
The previous analysis proved the superiority of using the twin model to detect multiple faults.However, there is still a deficiency in dealing with excessive failures, that is, the detection accuracy decreases significantly when the number of faulty signals exceeds the upper limit.Therefore, efficient fault-tolerant solution is required to restore abnormal data.For multidimensional fault data points, the KNN algorithm can help search forKoperating points that are closest to the faulty signal features in the historical database.On this basis,WKNN regression was employed to obtain more accurate values by assigning a greater weight to the nearest neighbors.The selection of the value ofKhas a significant impact on the results of the regression analysis.This is because an approximation error with a smallerKcan make the model more complicated and can likely lead to overfitting, resulting in a larger estimation error.According to Fig.10, WKNN has a lower error than KNN without weighting.WhenK=8,WKNN has the smallest RMSE (2.2217 μA).Hence, the hyperparameterKin WKNN used in this study was set to eight.

Fig.11 (Color online) Signal value of SPND#27 after data recovery
To verify the feasibility of the fault-tolerance scheme mentioned above, we selected 100 points of a continuous time sequence under the full-power platform from the test set, and random faults were introduced into SPNDs from the 25 point to the 100 point in the example.In fault-tolerant processing, data recovery is first performed for the SPND variable whose RMSE is the largest.Taking SPND#27 as an example, Fig.11 shows that the deviation between the fault and original values is distinct (RMSE=0.0387 μA ), which significantly affects normal system monitoring.From the perspective of the twin model, the deviation between the predicted and original values was high (RMSE=0.0488 μA ),making it incapable of meeting the requirements of high-precision control.In the implementation of WKNN, the deviation distance between the regression value and the original values was the shortest (RMSE=0.0044 μA ), and the data recovery accuracy was enhanced compared with that of the twin model.Through data recovery, WKNN can perform more reliable correction and can maintain stable operation of the system.
For data verification, the JS divergence was employed to prove the similarity of the probability distribution of the values.After the calculation, the divergence values of the fault values, predicted values of the twin model, and regression values of WKNN with the original values were 4.3409× 10⁻⁵, 7.5058 × 10⁻⁷, and 5.6829 × 10⁻⁷, respectively.The regression values of WKNN have advantages in terms of similarity measurement which verifies the remarkably similar probability distribution and high recovery performance.
We further evaluated the performance of the fault-tolerant method on a sample filled with faulty signals.The impact of the number of recovered variables on the average RMSE of the model outputs and fault detection accuracy is illustrated in Fig.12.In multi-point fault detection, the obtained detection accuracy with no measures for recovering data was 52.18%, which is the same as before.This is mainly attributed to the fact that the output error of the twin model is much larger than the normal range,which provides completely false knowledge and leads to the inability of the ESD test to determine that all SPND variables have failed.As the data recovery progresses, the faulty variables are substituted by the recovered data.Subsequently, the average RMSE decreases, and the detection accuracy increases gradually.When the number of recovered variables reaches approximately 18, the accuracy increases to approximately 100%.In addition, there is no additional need to recover from other failures in this case.
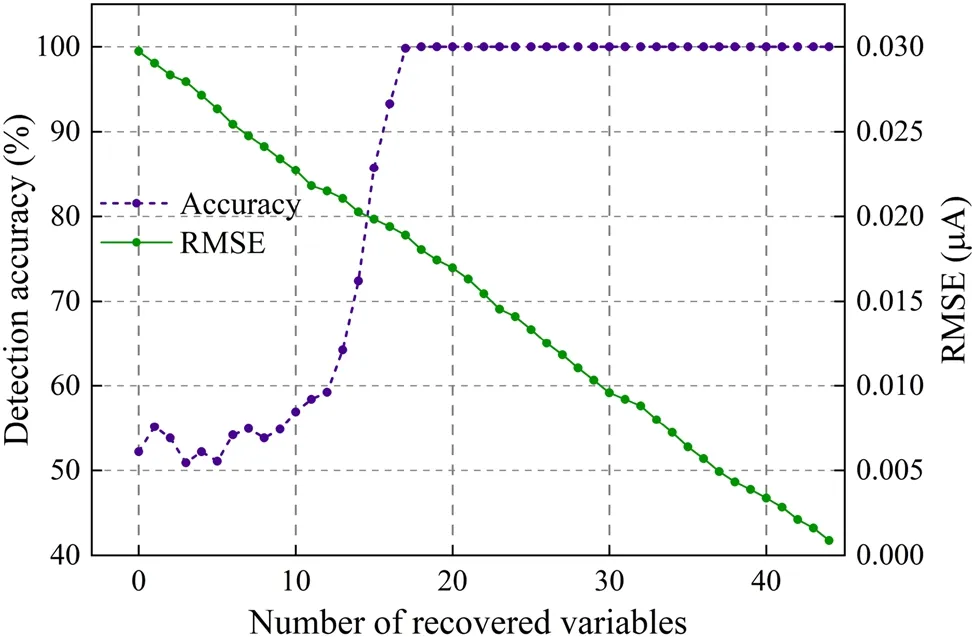
Fig.12 Performance of fault tolerance

Table 3 Improvement of the fault detection accuracy with fault tolerance
Finally, the effects of the fault-tolerance strategy on the improvement of twin model-based fault detection for SPNDs are discussed.As shown in Table 3, the number of faulty SPNDs was divided into five intervals in the multi-point fault detection experiment (150 groups): less than 25, 25-30, 30-35, 35-40, and more than 40.Without the introduction of fault tolerance, the mean fault detection accuracies in the five intervals were 100%, 72.23%,53.29%, 52.91% and 53.88%.After recovering the faulty data, the number of successfully detected faulty SPNDs increased, resulting in accuracies of 100%.This change confirms that the provision of subsequent fault-tolerant measures to the twin model can efficiently enhance the detection accuracy and improve the capacity to parse the signal correlation for the model, which is sufficient for maintaining healthy monitoring of the system.
5 Conclusion
In this study, we proposed a twin model-based fault detection method along with a tolerance strategy for in-core SPNDs.The twin model consists of a combination of submodels built by GRNN, which can extract the inner correlation of multidimensional data through deep learning from historical SPND signals.Compared with other methods,the twin model can obtain a higher prediction precision and help improve CNFMS measurements.The fault detection phase is based on calculating the error probability distribution of the model outputs that can determine the existence of single-and multi-point faults.This technique can maintain a detection accuracy of nearly 100%.To address the problem of decreased efficiency caused by excessive failures,a fault-tolerant phase was developed with WKNN, which could search for normal signal values with the same operating conditions to replace faulty signals.Comprehensive steps, including troubleshooting, data substitution, and data verification, were conducted to achieve superior the faulttolerance performance.The experimental results show that the tolerance strategy is promising for delivering high detection quality with an accuracy of more than 99%, suggesting that the proposed method can be considered adoptable.Furthermore, our work can be extended to other layers of in-core detector assemblies to achieve holistic conditionbased maintenance of the monitoring system.
Author contributionsAll authors contributed to the study conception and design.Material preparation, data collection and analysis were performed by Jing Chen, Hao Jiang and Yan-Zhen Lu.The first draft of the manuscript was written by Yan-Zhen Lu, and all authors commented on previous versions of the manuscript.All authors read and approved the final manuscript.
Declarations
Conflict of interestThe authors declare that they have no competing interests.
杂志排行
Nuclear Science and Techniques的其它文章
- Heuristic techniques for maximum likelihood localization of radioactive sources via a sensor network
- Deep learning for estimation of Kirkpatrick-Baez mirror alignment errors
- Reference device for calibration of radon exhalation rate measuring instruments and its performance
- Measurement of the cavity-loaded quality factor in superconducting radio-frequency systems with mismatched source impedance
- Establishment and study of a polarized X-ray radiation facility
- Development and preliminary results of a large-pixel two-layer LaBr3 Compton camera prototype
