Measurement of the cavity-loaded quality factor in superconducting radio-frequency systems with mismatched source impedance
2023-09-18JinYingMaChengYeXuAnDongWuGuoDongJiangYueTaoZongHengXueLongBoShiTianCaiJiangZhengLongZhuZiQinYangZhengGaoLiePengSunGuiRongHuangFengQiuYuanHe
Jin-Ying Ma · Cheng-Ye Xu · An-Dong Wu,2 · Guo-Dong Jiang · Yue Tao · Zong-Heng Xue · Long-Bo Shi ·Tian-Cai Jiang · Zheng-Long Zhu · Zi-Qin Yang,2 · Zheng Gao,2 · Lie-Peng Sun,2 · Gui-Rong Huang,2 ·Feng Qiu,2 · Yuan He,2
Abstract The accurate measurement of parameters such as the cavity-loaded quality factor ( QL ) and half bandwidth ( f0.5 ) is essential for monitoring the performance of superconducting radio-frequency cavities.However, the conventional “field decay method"employed to calibrate these values requires the cavity to satisfy a “zero-input" condition.This can be challenging when the source impedance is mismatched and produce nonzero forward signals ( Vf ) that significantly affect the measurement accuracy.To address this limitation, we developed a modified version of the “field decay method" based on the cavity differential equation.The proposed approach enables the precise calibration of f0.5 even under mismatch conditions.We tested the proposed approach on the SRF cavities of the Chinese Accelerator-Driven System Front-End Demo Superconducting Linac and compared the results with those obtained from a network analyzer.The two sets of results were consistent, indicating the usefulness of the proposed approach.
Keywords Loaded quality factor · Field decay method · Superconducting cavity · Mismatch · Calibration · Cavity differential equation · Measurement · Accelerator-driven system
1 Introduction
Driven by the growing demand for safe nuclear fuel posttreatment processes, the China initiative Accelerator-Driven System (CiADS) is being constructed as a clean solution for nuclear fission power sources [1-3].To showcase the potential of a high-power continuous wave(CW) proton beam for this project, the China ADS Front-End Demo Linac (CAFe) was built.This Linac is a 162.5 MHz superconducting (SC) radio-frequency (RF) machine operating in the CW mode and consists of both normal conducting (NC) and SC sections (Fig.1).The NC section includes an ion source, low-energy beam transport line, RF quadrupole accelerator, and medium-energy beam transport line.Conversely, the SC section comprises SC accelerating units, including 23 SC half-wave resonator cavities assembled into four cryomodules (CM1-CM4) [4-7].The commissioning tests conducted on CAFe in the CW mode with a current of 10 mA and energy of 20 MeV successfully demonstrated its ability to accelerate and transmit highintensity beams.

Fig.1 (Color online) Layout of the CAFe facility.Two types of halfwave resonator superconducting cavities (HWR010 and HWR015)are implemented.The cavity CM3-3 is marked by a red triangle.Note that for a cavity CMm-n , the subscripts m and n represent the mth cryomodule and nth cavity, respectively
For an SC cavity, the loaded quality factor (QL) reflects the consumption of the stored electromagnetic energy inside the cavity.In an ideal situation, in the absence of a beam passing through the cavity,QLindicates the power dissipation from the cavity wall owing to the surface resistance (termedQ0[8, 9]) and the power leakage from the coupler ports (termedQe) [10].Thus,QLis a critical parameter that must be carefully selected to match the impedance of the RF generator with the particle beam load during operation [11].Furthermore, dark current loading can negatively affectQL, making it an important figure of merit for identifying such effects [12, 13].In addition,QL(or the cavity half-bandwidth (f0.5)) plays a crucial role in the design of model-based controllers [14-16].To satisfy the aforementioned application requirements, the measurement error forQLshould not exceed 5%.The value ofQLcan be calibrated using the cavity resonant frequency (f0) andf0.5,where.Therefore, the precise measurement off0.5is a prerequisite for calibratingQL.The decay curves of the cavity amplitude and phase (after the RF power is turned off)obtained from the cavity differential equation contain information onf0.5and the cavity detuning parameter ( Δf),respectively.Many laboratories, including DESY, KEK, and CSNS, employ the “field decay method" to measure the aforementioned physical quantities [17-21].
We tracked the long-term changing regularity off0.5based on the data obtained when the RF power was turned offand accumulated while the CAFe facility was operated.Occasionally, we found that the cavity half-bandwidth calculated using the amplitude decay curve (i.e.,f0.5,decay)and the cavity detuning parameter calculated using the phase decay curve (i.e., Δfdecay) appeared to be correlated.However, in principle, they should be independent.To better understand the above issue, we thoroughly examined the“field decay method”.Our findings revealed that this method is based on the zero-input response of the cavity differential equation, which indicates that the RF system must satisfy the“zero-input” condition.Thus, the cavity incident power must drop to zero after the RF power is turned off.However, if this condition is not met (i.e., owing to impedance mismatch),the remaining incident power may influence the decay process and render the “field decay method” ineffective.We constructed an equivalent circuit that included RF power sources, transmission lines, input couplers, and SRF cavities and derived a solution for the cavity differential equation when a source impedance mismatch occurred.Finally, we modified the formula in the “field decay method” to explain the aforementioned correlation.
The “field decay method” is always employed to calibrateQL.If the aforementioned “zero-input” condition is not satisfied owing to impedance mismatch, considerable errors may occur in the measurement ofQL.To improve measurement accuracy, this study focuses on a modified calibration algorithm based on an equivalent circuit.
2 Phenomena and possible interpretation
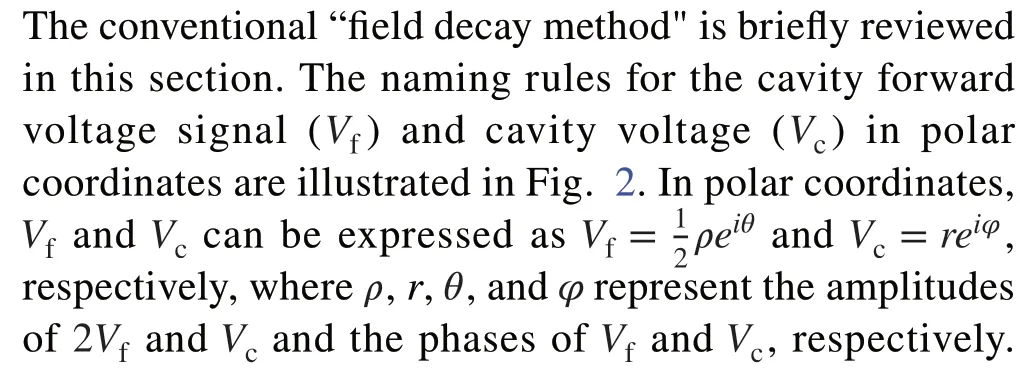

Fig.2 Schematic interpreting the notations of the cavity differential equation in polar coordinates
When the RF power is turned off,ρimmediately decreases to zero in the ideal case.Under this condition, according to the SC cavity differential equation without the beam in polar coordinates [22-24],f0.5and Δfcan be expressed as

Fig.3 (Color online) Cavity amplitude (a and b) and phase (c) decay curves before and after the RF power is turned offfor various Δf on the cavity CM3-3.The parameter f0.5,decay is obtained by calculating the slope of the decay curve between 0.95 and 0.75 of the steady-state Vc (see the middle plot)
We refer to the various methods used in this study to calculatef0.5and Δf.For clarity, we first provide their detailed definitions in Table 1.
For the cavity CM3-3(marked by a red triangle in Fig.1) at CAFe, we measured the cavity-field decay curves for different values of Δfdecay(Fig.3).f0was tuned using a frequency tuner.After the RF power was turned off, the slope of the cavity phase varied with the detuning parameter (Fig.3c) because the phase decay curves are directly associated with the detuning parameter according to Eq.(1).Because the cavityQLis independent of the detuning parameter, the field decay curves of the cavity are expected to overlap under different detuning conditions;however, they appear to be affected by the detuning parameter (Fig.3a and b).We conducted several studies to address this perplexing phenomenon.
First, we calibratedf0.5,decayand Δfdecaywith four different values ofVcfor the cavity CM3-3(Fig.4a).The value ofVcis less than the onset gradient of the field emission (approximately 1.2 MV).All four curves show the dependencies betweenf0.5,decayand Δfdecay.A similar dependence appears in another cavity ( CM3-4) (Fig.4b).
Initially, we suspected that the frequency tuner might have disturbed the input coupler, causing variations in the coupling coefficients (β) andQL(orf0.5,decay).Consequently, we turn offthe tuner and achieve cavity detuning by scanning the frequency of the signal generator at the same CM3-3.However, a similar dependence was observed in both cases (Fig.4c.The deviation in Fig.4c is primarily because of the slight differences in the cavity field levels.

Fig.4 a f0.5,decay and Δfdecay have dependency relations for different cavity voltages on CM3-3 , particularly when Vc is greater than 0.4 MV.b The dependency relations can also be observed in CM3-4 (red triangles).c Comparison of the dependency relationships at CM3-3 when Δfdecay is scanned by the signal source (red triangles) and tuner(gray dots).The two curves exhibit the same tendency

Table 1 Definitions of the cavity-related notations

Fig.5 (Color online) Voltage and phase of Vc , XV*f , and YV*r before and after turning offthe RF power

Fig.6 Two causes of ≠0 (RF off): crosstalk between the measurement channels (green line) and source impedance mismatch(red line)
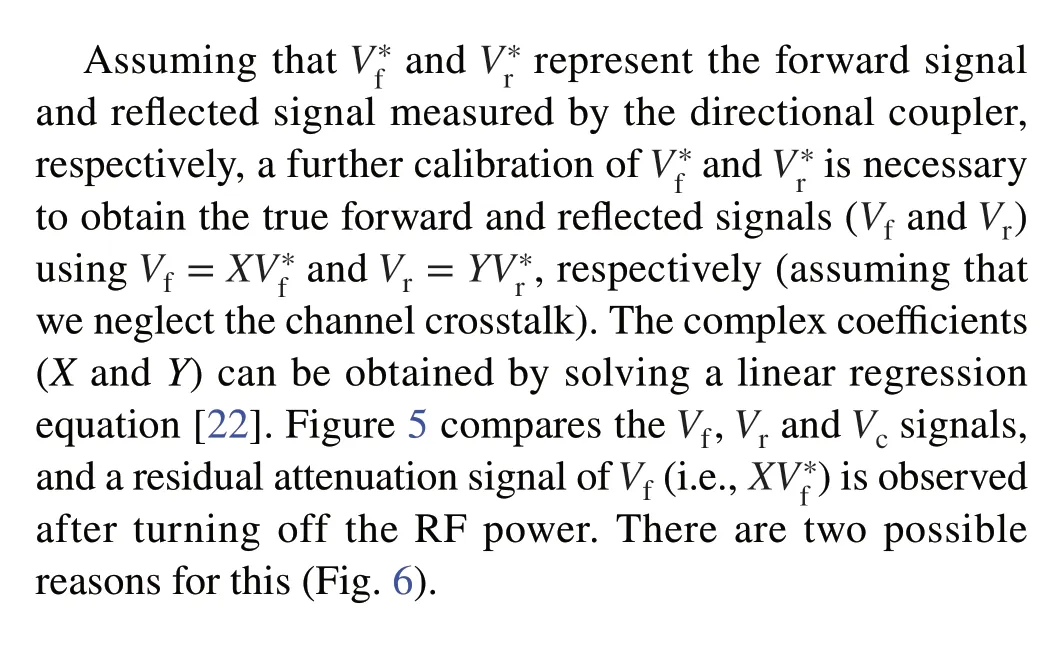
1.The first reason is the crosstalk between the measurement channels, that is, the residual signal ofVfis coupled with the signalVr[22].In this case, the residual signal is a false measurement signal.
2.The second reason is the source impedance mismatch,where theVrsignal is reflected from the generator side and mixed with theVfsignal.In this case, the residual signal is a true signal.
Before 2021, directional couplers with poor directivity(approximately 20 dB) were commonly used in our RF system, at CAFe facility.Previous studies have suggested that the limited directivity of these couplers was primarily responsible for the residual signals [24].In 2022, we replaced all the old directional couplers with new ones exhibiting high directivity (40 dB).This resulted in almost negligible channel crosstalk; however, we decided not to install a high-power circulator in CAFe because of cost constraints.Based on these factors, we conclude that the residualVfsignal in Fig.5 could be attributed to impedance mismatch rather than crosstalk.
The algorithm in Eq.(1) must be modified because the “zero-input" condition is not satisfied.The specific calibration algorithms are described in Sect.3.
3 Theory and algorithm
In this section, we establish cavity differential equations for the mismatched source impedance condition and use them to derive new formulas for calibratingf0.5and Δf.
3.1 Radio-frequency and cavity circuit under the mismatched source impedance condition
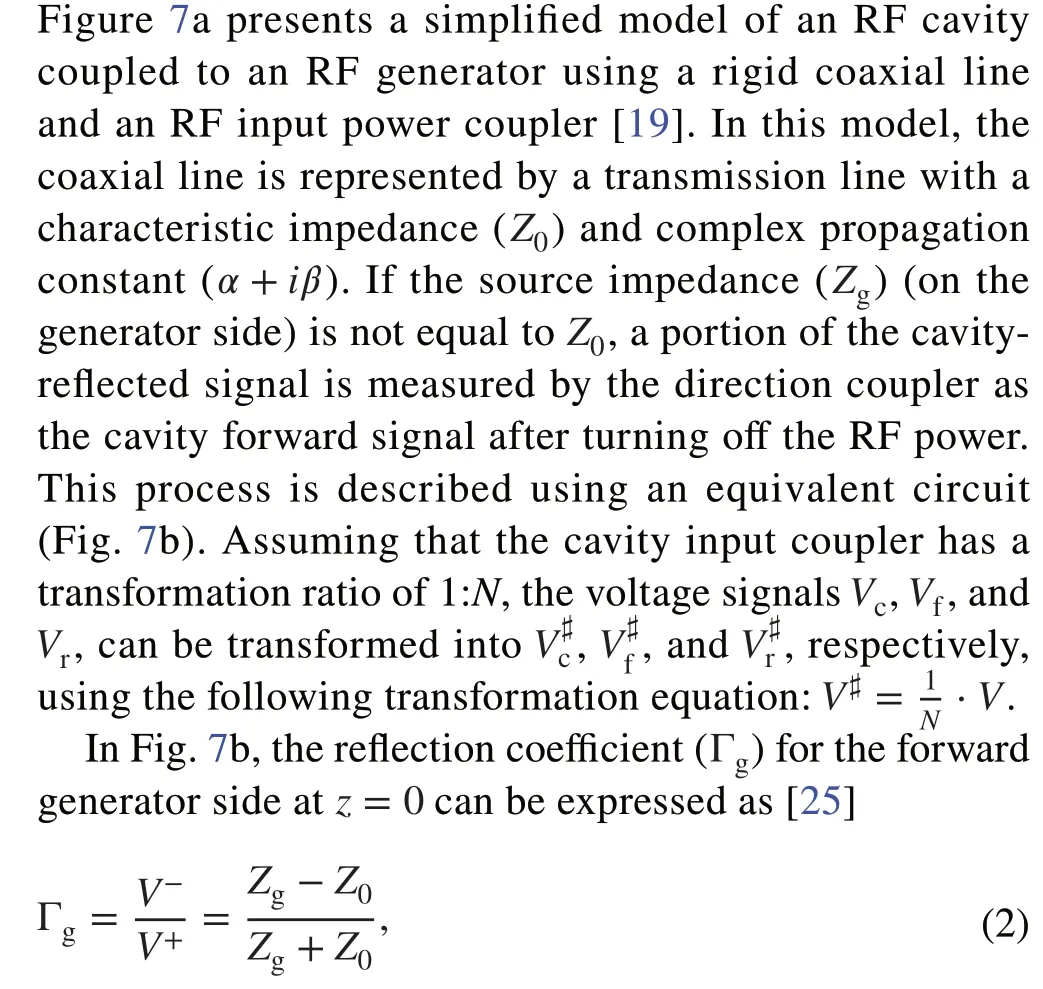
whereV+andV-represent the voltages of the incident and reflected waves atz=0 , respectively.After the RF power is turned off, the reflection coefficient atz=-L(Lis the length of the transmission line) is given by

Here, the parameterβcis the coupling factor, which is generally considerably larger than 1 (i.e.,βc>>1 ).Thus,ucan be simplified asu=2Vf.By substitutingVfwith Eq.(6)into Eq.(7), we obtain

Fig.7 a Simplified model of a cavity coupled to an RF generator by a rigid coaxial line and an RF input power coupler.b Equivalent circuit diagram of (a) after the RF power is turned off.The cavity voltage ( Vc ) is transformed into V♯c on the left side of the input coupler

3.2 New calibration algorithm for f0.5 and △f
It is more convenient to normalize the steady state (Vc(t) )to one, that is,Vc(0)=1 if we assume that the RF power is turned offatt=0 and the signalVc(t) is in steady state att≤0.Under the aforementioned restrictions, the solution to Eq.(10) att≥0 is given by:
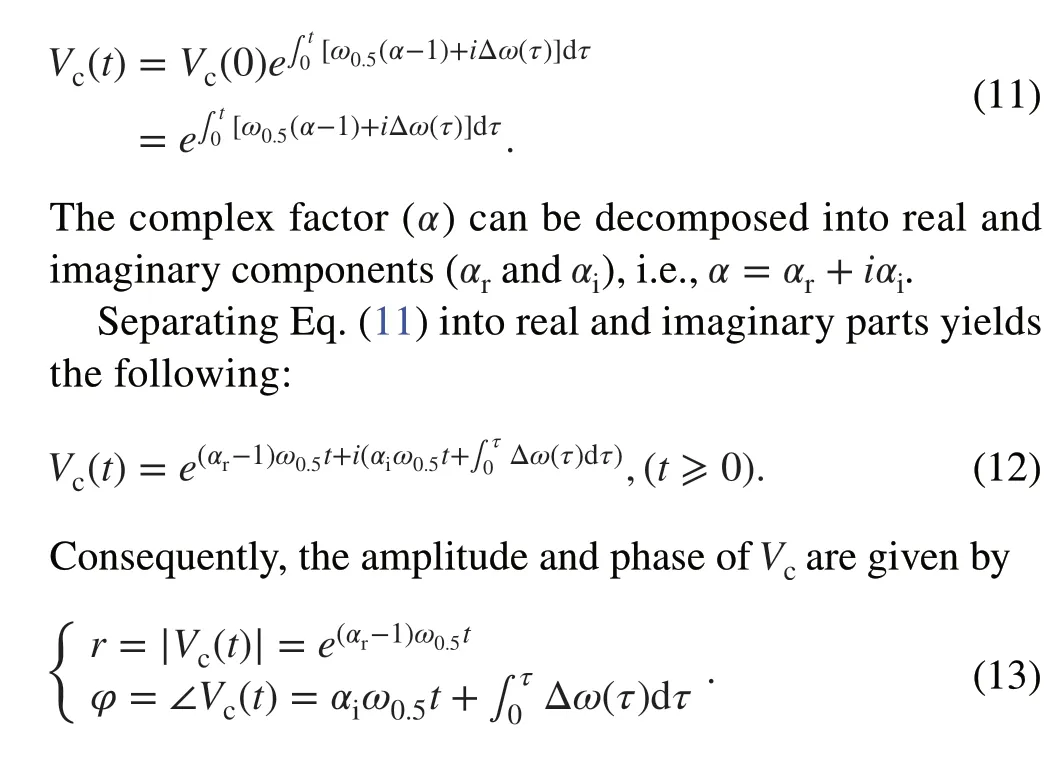
Equation (13) provides some insights.If the source impedance (Zg) perfectly matches the transmission line impedance (Z0), then Γg=0 , ΓL=0 , andα=0.In this scenario, according to the field decay algorithm, the cavity half bandwidth (ω0.5) and cavity detuning parameter ( Δω)can be easily obtained by fitting the slope of the cavity amplitude and phase, i.e.,ω0.5=-r′∕rand Δω=φ′.However, if the source impedance is not correctly matched to the transmission line ( Γg≠0 ), the waves reflected from the cavity side will reflect again, resulting in nonzero forward power even after the RF power is turned off.This significantly affects the shape of the field curves, rendering the original algorithm inapplicable.
Using the original field decay method, the cavity halfbandwidth (ω0.5,decay) and detuning parameter ( Δωdecay)were calibrated using

The accuracy of the original field-decay algorithm depends on the parameterα, where the real (αr) and imaginary (αi)parts ofαdetermine the accuracies off0.5,decayand Δfdecay,respectively.Figure 8a and b illustrates the calibration errors off0.5,decayand Δfdecay, respectively, as functions of ΓL.To ensure that the accuracies off0.5,decayand Δfdecay∕f0.5,calilie within the ±5% band, the coefficient ΓLmust be located inside the red circle (that is,ΓL<0.024 ≈ -32 dB) in Fig.8c.Figure 8d illustrates the specific relationship between the accuracies off0.5,decay, Δfdecay∕f0.5,caliand ΓL.
4 Modeling and simulation
The state-space formalism in Eq.(7) is given by [19, 26,27]:
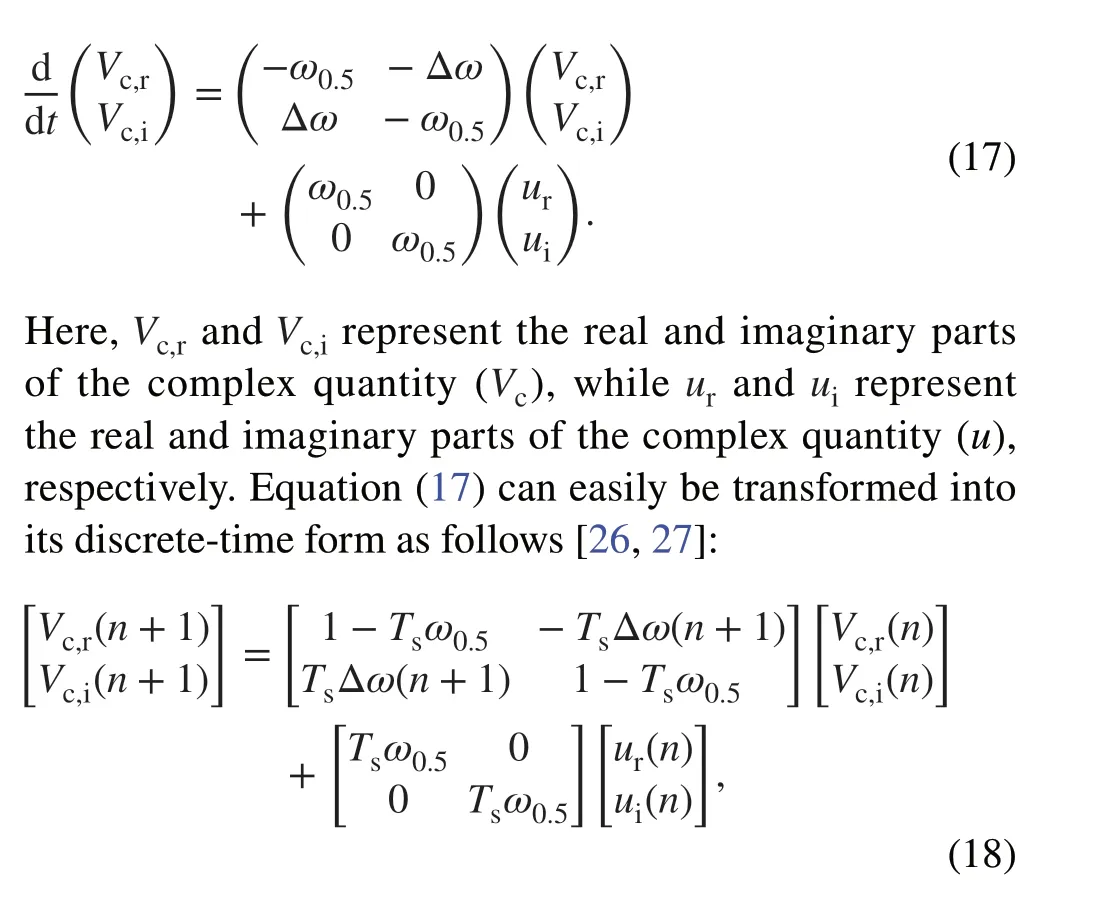

Fig.8 (Color online) Calibration error of the cavity half bandwidth(a) and detuning parameter (b) as a function of the reflection coefficient ( ΓL ), where ΓL ranges from 0 to 0.18.The cavity bandwidth ( f0.5,decay ) and Δfdecay are calibrated based on the field decay curves.To ensure that the accuracies of f0.5,decay and Δfdecay∕f0.5,cali lie within the ±5% band, ΓL should be located inside the red circle (i.e.,ΓL<0.024 ≈ -32 dB), as illustrated in (c).The results in (d) show that the calibration error of f0.5,decay and Δfdecay increases withΓL , particularly whenΓLexceeds -32 dB
whereTsrepresents the sampling period.According to Eq.(9), the drive signalucan be expressed as
Other equations related to the dynamic behavior of the cavity are derived in Appendix A.The simulation parameters are presented in Table 2.After steady-state operation is achieved for 0.4 ms, the RF power is turned off.The signal reflected from the cavity is also reflected as Γgis not zero.Figure 9 compares the signalsVc,Vf, andVrbased on the cavity model(red dash line) and real SC cavity (thick solid gray line).The red dash lines and thick solid gray lines showed good consistency.In addition, the simulation results for the perfect impedance matching case ( Γg=0 , indicated in green) are included for comparison.
According to Appendix A, the Lorentz force detuning(LFD) dynamics are assumed to be determined by a firstorder differential equation.Consequently, the cavity phasesignal presents curved trajectories (red dashed lines in Fig.9) rather than linear trajectories.However, without the LFD dynamics, the cavity phase curve is linear, as indicated by the blue dotted lines in Fig.9a.The slope of the linear phase curve represents the cavity detuning parameter( Δωdecay).The cavity phase curves overlap in the first 80 μs after the RF power is turned off, regardless of whether the LFD is included (Fig.9a).For clarity, the LFD dynamics during the field decay process were examined (Fig.10).For the subsequent 80 μs after the RF power is turned off,the LFD-induced phase error and maximum LFD value are less than 0.01 deg and approximately 0.8 Hz, respectively.Consequently, it is reasonable to fit the 80 μs cavity phase data to obtain Δf.

Table 2 RF and LFD parameters for the simulations
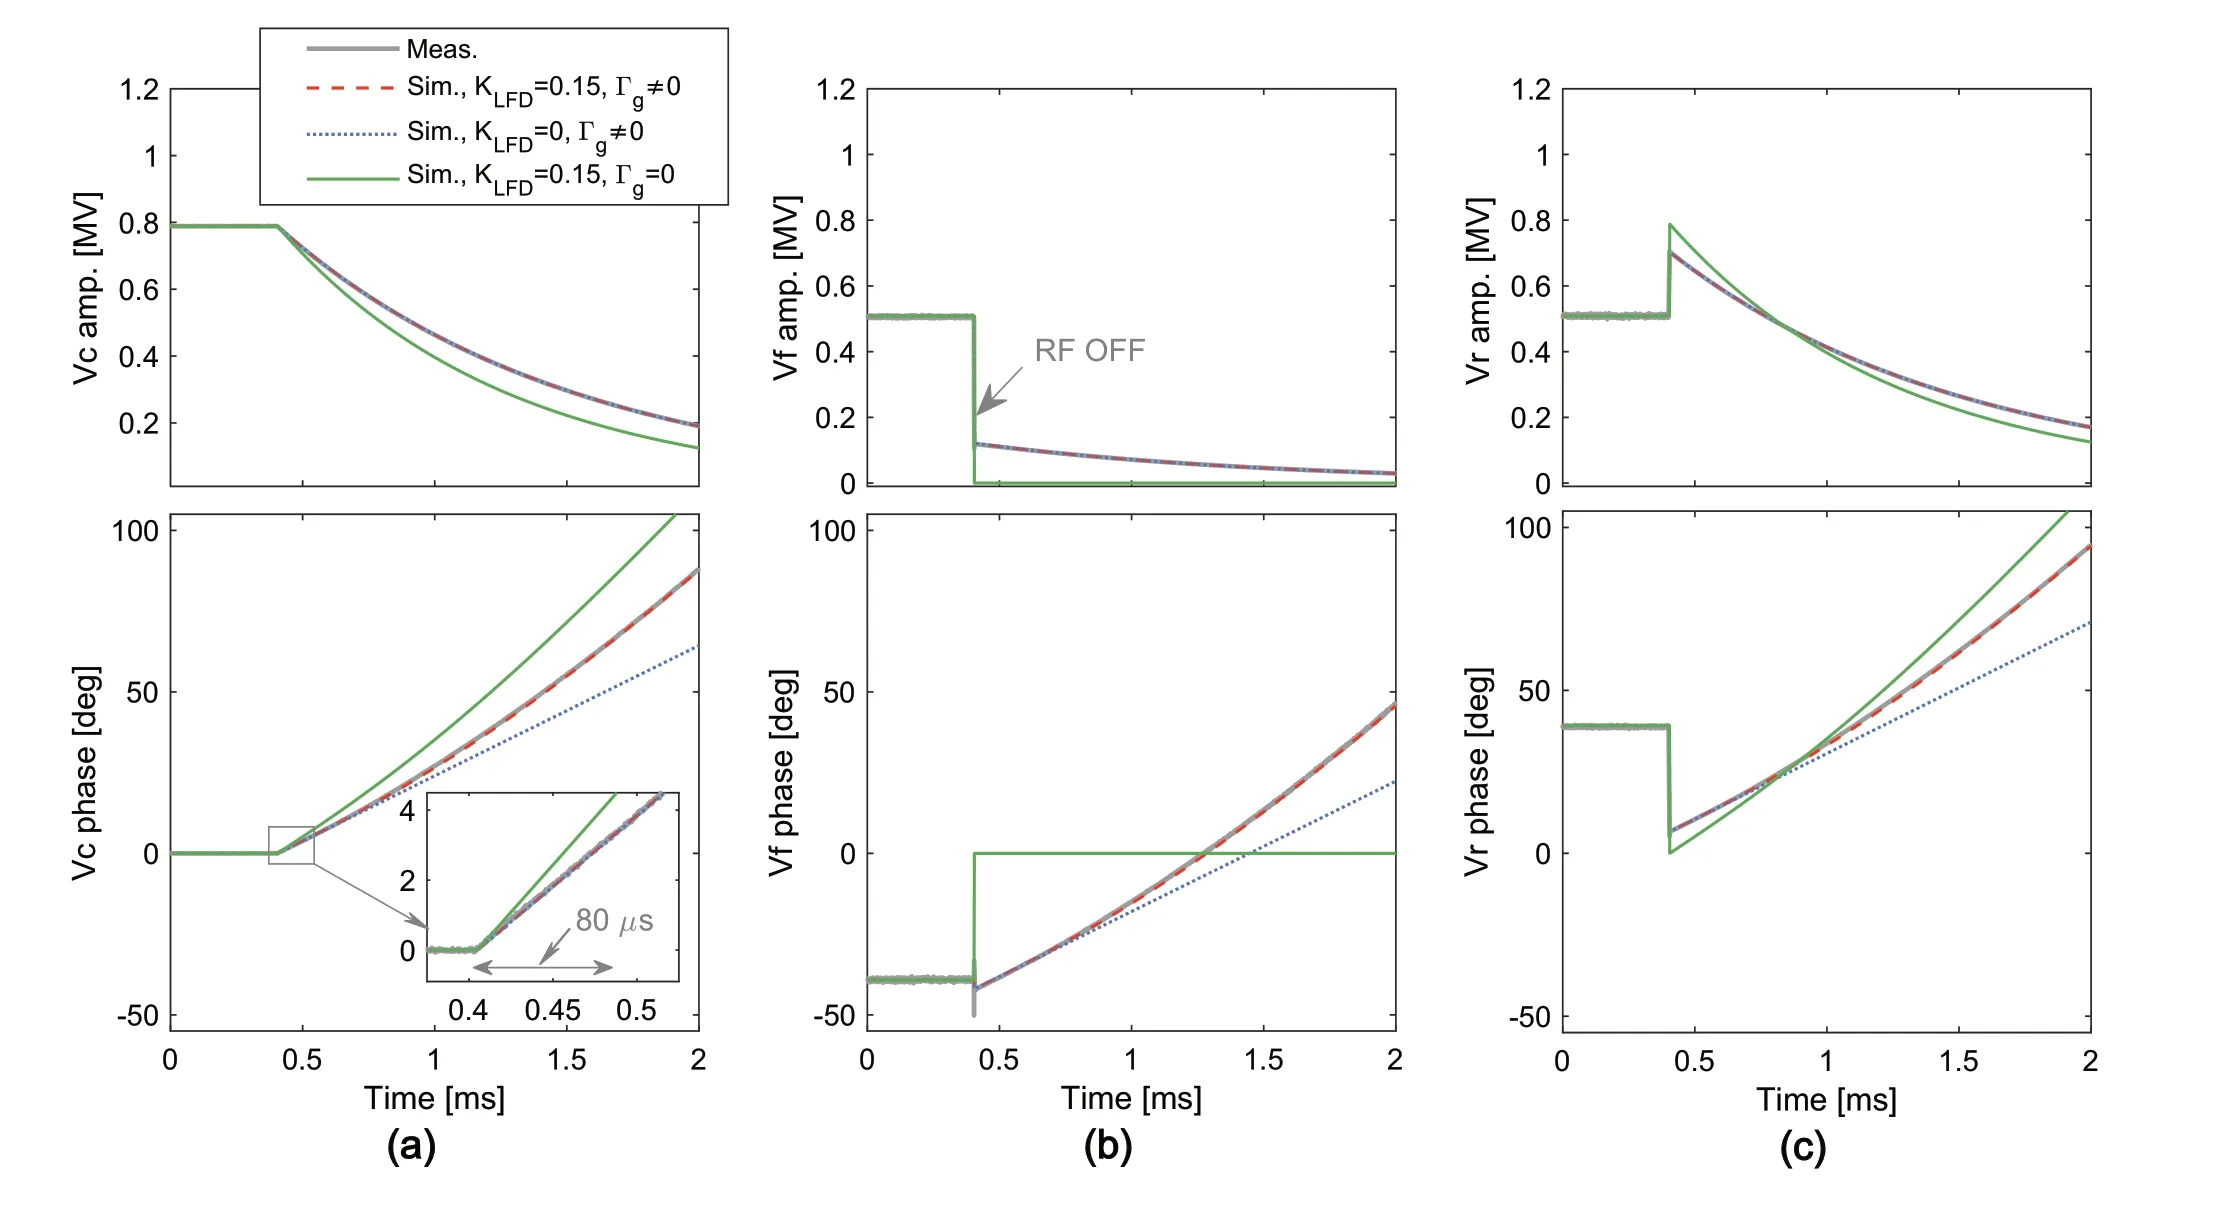
Fig.9 (Color online) Comparison of the cavity voltage (a), cavity forward (b), and reflected signal (c) measurements based on the cavity model (red) and real SC cavity (gray).A stable operation is maintained for 0.4 ms before the RF power is turned offto create a field decay event.In the cavity model, the LFD dynamics is assumed to be determined by a first-order differential equation, resulting in curved trajectories in the cavity phase signal (red dashed lines)instead of linear ones.When the LFD effect is neglected, the cavity phase curve is linear (blue dotted lines), as shown in (a).In addition,the simulation results for the perfect impedance match case ( Γg =0 ,indicated by green solid line) are also included for comparison
5 Experimental verification
Based on the algorithm in (15), we recalibrated the measurement results shown in Fig.4a.The details of the process are described below.
1.Calibrating the actual forward and reflected signals usingVf=XV*fandVr=XV*r, respectively: The complex factors (XandY) were determined by solving a linear regression equation [22].
2.Determining the factorα: According to (6), we calculatedαas twice the ratio ofVftoVcafter turning offthe RF power.Here, we averagedαover a time interval of 50 μs (e.g., from 0.45 ms to 0.5 ms in Fig.11) to reduce uncertainty.
3.Calibratingf0.5,decayand Δfdecayusing the traditional“field decay method": To ensure a sufficient signal-tonoise ratio, we determinedf0.5,decayby calculating the slope of the decay curve between 0.95 and 0.75 in the steady-state (Vc)( Fig.3b).To avoid the LFD effect, we determined the derivative of the cavity phase within an 80 μs interval after the RF power was turned offto obtain Δfdecay.
4.Calibratingf0.5,caliand Δfcali: We used the formula (15)with the known values ofα,f0.5,decay, and Δfdecayto calibratef0.5,caliand Δfcali.
We used the aforementioned procedure to calibratef0.5,caliand Δfcali(Fig.12a).In contrast to the strong correlation observed betweenf0.5,decayand Δfdecaymeasured by the cavity amplitude and phase decay curve, the new calibrated value off0.5,caliwas not independent of Δfcaliat differentVclevels.
We also compared Δfcaliand Δfdecaywith the steady-state cavity detuning parameters ( Δfss), which were calculated from the steady-state values ofVfandVc(Fig.12b).The following expression was used to calibrate Δfss:Figure 12b indicates that the discrepancy between Δfcaliand Δfssis less than ± 5 Hz, whereas there is an offset of approximately 40 Hz between Δfdecayand Δfss.

Fig.10 Simulation results showing the effect of the LFD on the measurement accuracy of the cavity phase and cavity detuning.For the initial 80 μs period after turning offthe RF power, the LFDinduced phase error is less than 0.01 deg, which can be ignored

Fig.11 a Cavity forward signal ( Vf ) for different detuning values on cavity CM3-3(the corresponding cavity voltage signal is given in Fig.3).b Method for estimating α from the Vc and Vf signals after the RF power is turned off
To further validate the proposed algorithm, we used a network analyzer to measure CM3-3and perform a comparison.Figure 13a and b shows the measurement setup,and the frequency-response measurement and corresponding fitted curve, respectively.The measurement results were fitted using the following formula
whereAmaxis the maximum value of the amplitude-frequency-response curve.The parametersfandfoffsetrepresent the stimulus frequency and frequency offset between the cavity resonant frequency and RF, respectively.In Fig.13b, the estimated value off0.5for the fitted curve is 183.7 Hz.
Next, we utilized a network analyzer to scan the cavities in CM1-CM3and estimatedf0.5,scanby curve fitting.We then compared the derivation betweenf0.5,caliandf0.5,scanfor the 16 cavities (excluding CM2-6and CM3-1because of cavity faults).In addition, we plot the deviation betweenf0.5,decayandf0.5,scanfor comparison purposes.The results are shown in Fig.14.The deviation betweenf0.5,scanandf0.5,caliwas maintained roughly within ±2% , indicating that the proposed calibration algorithm accurately estimated the values off0.5

Fig.12 (Color online) a Relationship between the cavity half bandwidth ( f0.5 ) and cavity detuning parameter ( Δfcali ) in the calibrated and uncalibrated algorithms for various values of Vc.b Comparison of the results of Δfdecay and Δfcali measurements with the cavity detuning value ( Δfss ) obtained in the steady state

Fig.13 a Measurement block diagram based on the network analyzer.b Frequency response function of cavity CM3-3 ,as measured by the network analyzer.The foffset parameter is excluded for better comparison
6 Conclusion
After the RF power was turned off, the residual signal (Vf)caused by source impedance mismatch could affect the field decay process, resulting in measurement errors forf0.5and Δf.The simulation results indicate that, to ensure that the measurement errors off0.5and Δfwere less than 5%, the reflection coefficient at the generator side must be less than -32 dB.To improve the measurement accuracy, we derived a calibration algorithm based on the cavity differential equation for cases in which there was a source impedance mismatch.Using this algorithm,we recalibratedf0.5and Δfand compared the results with those obtained from network analyzer measurements.The maximum error between the calculated and measured values was within 2%.
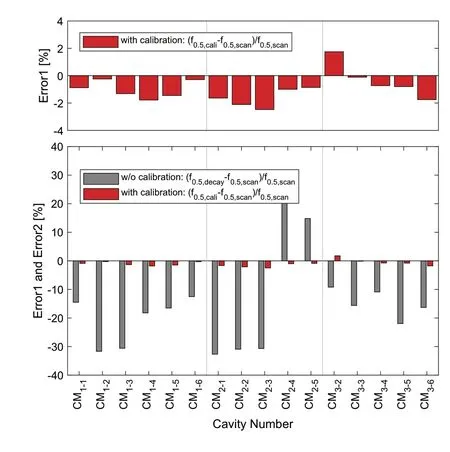
Fig.14 Comparison of the deviation between f0.5,decay and f0.5,cali for the 16 cavities and the network analyzer measurement results, f0.5,cali
αis a crucial factor in the calibration algorithm that ultimately depends on the impedanceZgon the generator side.Unfortunately, we do not have a comprehensive understanding of the factors that determineZg.One possible factor is the power output of the RF generator.For instance,differentVcand detuning parameters require different RF powers, which lead to differentZgvalues.Nevertheless, it is important to stress thatZgis not determined solely by the generator power, and the same power may result in different values ofZg.In our future work, we shall focus on identifying the mechanisms and physical quantities that affectZg.
Appendix A: dynamic behavior of the cavity
The LFD must be considered because the cavity gradient varies after the RF power is turned off.As the cavity field attenuates slowly owing to the high loaded Q (narrow bandwidth) characteristic, higher-order mechanical modes are usually not excited.In this case, the LFD dynamics can be described by a first-order differential equation [19] as follows:
whereKLFDandτdenote the LFD coefficient and mechanical time constant, respectively.The quantityEpeakis the cavity peak gradient, which can be defined asVcusingEpeak=Vc∕Leff, whereLeffis the effective cavity length.
According to Ref.[27], the corresponding difference equation of Eq.(22) is given by

Here, Δfinitialis the initial steady-state detuning parameter before the RF power source is turned off.Using the difference Eq.(17), (19), (24), and (25), a dynamic simulation of the cavity undergoing a complete field decay process can be easily performed.
Author's contributionsAll authors contributed to the study conception and design.Material preparation, data collection and analysis were performed by Feng Qiu, An-Dong Wu and Jin-Ying Ma.The first draft of the manuscript was written by Jin-Ying Ma, and all authors commented on previous versions of the manuscript.All authors read and approved the final manuscript.
Declarations
Conflict of interestYuan He is an editorial board member for Nuclear Science and Techniques and was not involved in the editorial review,or the decision to publish this article.All authors declare that there are no competing interests.
杂志排行
Nuclear Science and Techniques的其它文章
- Heuristic techniques for maximum likelihood localization of radioactive sources via a sensor network
- Source-less density measurement using an adaptive neutron-induced gamma correction method
- Deep learning for estimation of Kirkpatrick-Baez mirror alignment errors
- Reference device for calibration of radon exhalation rate measuring instruments and its performance
- Establishment and study of a polarized X-ray radiation facility
- Development and preliminary results of a large-pixel two-layer LaBr3 Compton camera prototype
