Design and performance study of a dielectric-filled cavity beam current monitor for HUST-PTF
2023-09-18JiQingLiKuanJunFanZhengZhengLiuJianWangQuShanChenJinFengYang
Ji-Qing Li · Kuan-Jun Fan · Zheng-Zheng Liu · Jian Wang · Qu-Shan Chen · Jin-Feng Yang
Abstract To guarantee the exact proton dose applied to patients and ensure treatment safety while disrupting and destroying tumor cells, it is essential to accurately monitor the proton beam current in real time during patient treatment.Because clinical treatment requires a proton beam current in the ~ nA range, nondestructive beam current monitors (BCMs) are preferred to minimize the degradation of beam quality.However, this poses significant challenges in accurately monitoring such extremely low beam intensities.This study proposes a cavity-type BCM equipped with a dielectric plate to reduce its dimensions and achieve sufficient measurement sensitivity for practical requirements.A prototype cavity BCM was fabricated, and off-line testing was performed using a metal wire to simulate the beam to study its performance.Both the simulation and experimental results showed that the cavity BCM could measure ultralow proton beam currents with a resolution up to 0.03 nA.
Keywords Proton therapy · Beam current · Cavity BCM · Nondestructive
1 Introduction
Proton therapy has the obvious advantage of improving clinical outcomes over traditional radiation therapies owing to the Bragg peak of the proton dose distribution [1].The proton therapy facility HUST-PTF is currently being developed at Huazhong University of Science and Technology.Figure 1 shows the facility layout, consisting of a 250-MeV superconducting cyclotron, a beam transport line, two rotating gantries and a fixed treatment room [2].
A synchrotron-based proton therapy facility can adjust the output energy to match clinical requirements, and the beam current can remain relatively constant at different energies.In contrast, a cyclotron-based proton therapy facility requires an energy selection system (ESS) to modulate the fixed beam energy to kill tumor cells at different depths.The ESS for HUST-PTF consists of a degrader, a set of collimators and an achromatic system.The stopping materials reduce the proton beam energy from 250 to 70-230 MeV to meet clinical requirements.However, protons undergo severe multiple scattering when they penetrate the stopping materials and lose energy.The proton beam divergence and beam energy spread increase significantly, and only a small portion of the proton beam can be selected by the ESS, resulting in a low and energy-dependent beam transmission efficiency.The lower the required clinical beam energy, the thicker the degrader that protons need to penetrate, and the more severe the scattering effects experienced by protons, the worse the beam quality, leading to a lower transmission efficiency.
When the clinical beam energy changes from 70 to 230 MeV, the transmission efficiency varies from 0.07 to 8.34%for a fixed beam energy of 250 MeV and a carbon degrader material.Suppose the extraction beam current of the cyclotron is 500 nA.The resulting beam current would have a very broad dynamic range of 0.35-41.7 nA, which poses significant challenges for the beam current monitor (BCM) system.Furthermore, this creates difficulties in exactly controlling the treatment dose in practical applications.Therefore,the dynamic range of the proton beam current after passing through the ESS must be confined.In practice, we can adjust the beam current inside the cyclotron and select different collimators to minimize the dynamic range of the clinical proton beam current.We propose that the cyclotron works in three modes that can provide the proton beam intensity at three fixed values, 500 nA, 200 nA and 60 nA, to compensate for the energy-dependent transmission efficiency.Consequently, depending on the output beam energy, the beam current will decrease from 500 to 0.35-5 nA before and after the ESS.The detailed beam parameters at the extraction of the cyclotron and after the ESS are listed in Table 1.
Monitoring and accurate control of online clinical beam currents are mandatory to guarantee treatment safety.Although traditional ionization chambers can precisely measure the online beam current, they can cause several harmful effects, such as beam scattering and detector activation.Noninvasive BCMs are preferable for minimizing interference with the clinical proton beam, particularly in cases of very low beam intensity.Conventional nondestructive BCMs typically detect the induced electromagnetic fields or image currents.For example, signal pickups of the button type orstripline type are employed to detect the beam current; however, the output signals are relatively weak and beam position-dependent, containing significant thermal noise owing to their broadband basis [3].Other noninvasive BCMs, such as wall current monitors and fast current transformers, are not suitable for HUST-PTF because their detection threshold cannot be reduced to an average beam current of 1 nA [4].
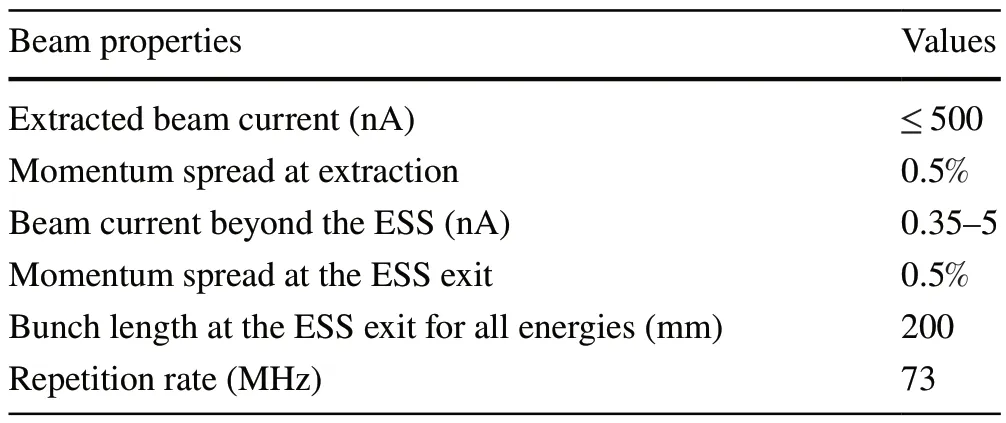
Table 1 Beam parameters at the extraction of the cyclotron and after the energy selection system
Cavity-type beam monitors, which detect only a single harmonic of the beam spectrum, have superior current and position detection resolutions.They can generate sufficiently induced signals, even with an average beam current of 1 nA,and have negligible effects on the passing beam itself [5].Usually, two cavity working modes are employed: the monopole mode (TM010) for beam current measurement and the dipole mode (TM110) for beam position diagnostics [6, 7].Compared with broadband monitors, cavity monitors output signals in a narrowband at the resonant frequency, which significantly reduces the thermal noise.In recent years, the cavity monitors used in medical accelerators have developed rapidly.In the ENEA Frascati Research Center, researchers developed a resonant cavity BCM for pulsed proton medical linacs [8].Furthermore, the PSI reported the progress of the cavity BCMs used in proton therapy facilities and successfully demonstrated noninvasive beam current measurements in the range 0.1-10 nA with a resolution of 0.05 nA in the energy range 70-238 MeV [9].
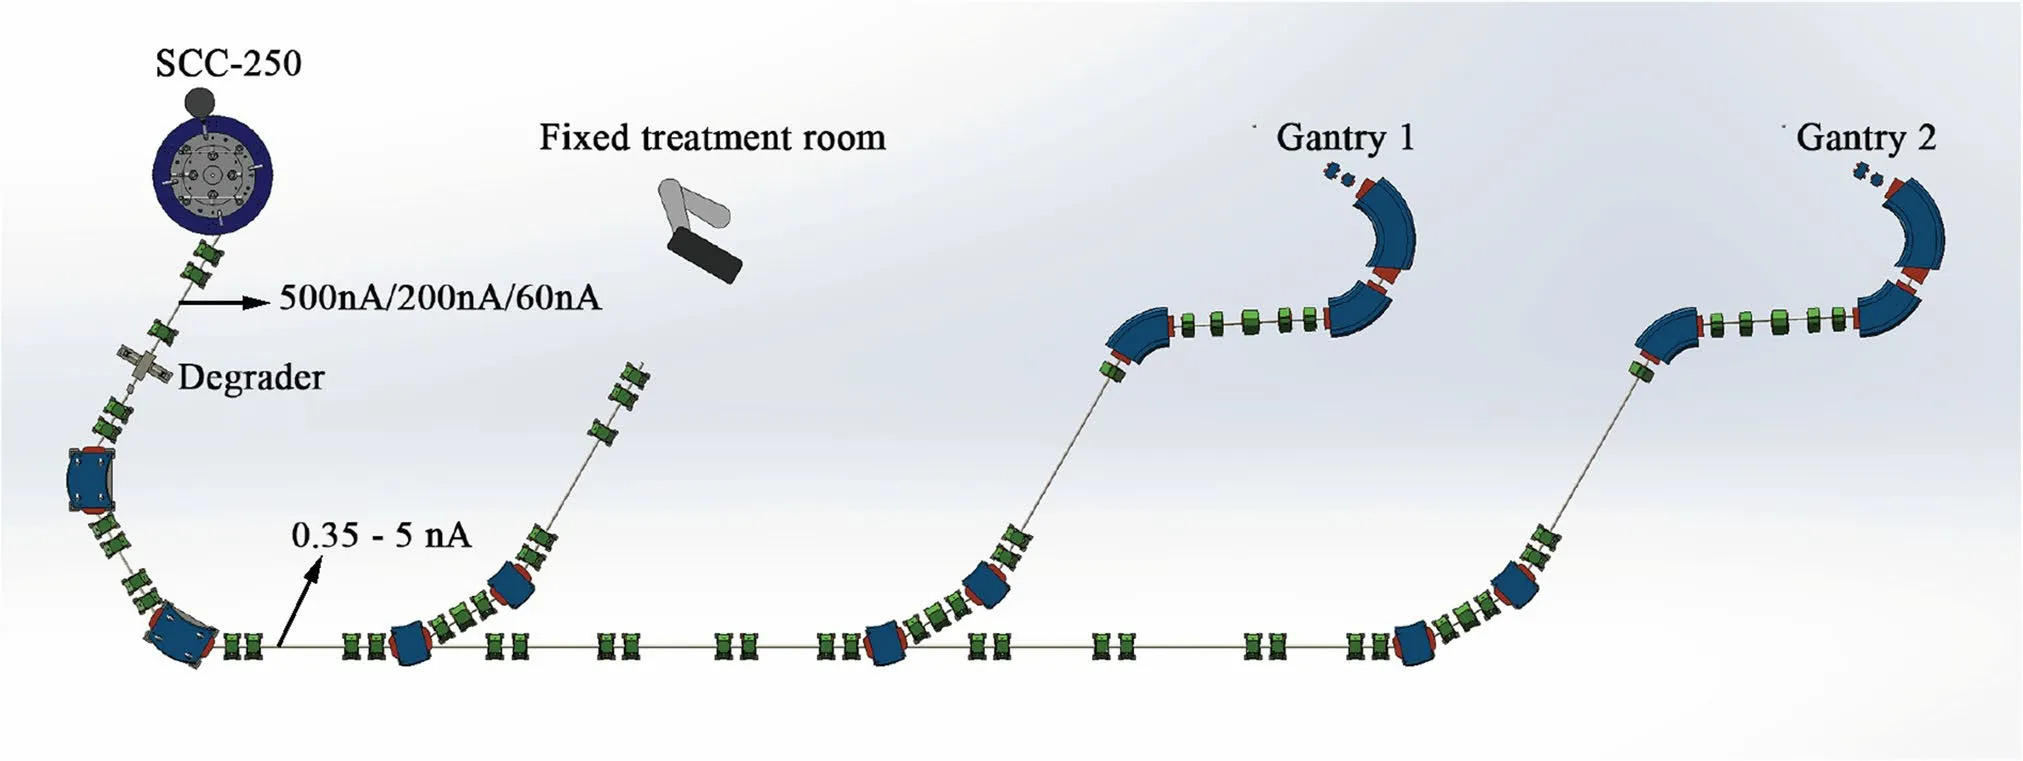
Fig.1 (Color online) General layout of HUST-PTF
This paper presents the design of a dielectric-filled cavity BCM.The working frequency was tuned to 146 MHz to match the second harmonic of the pulse rate.To minimize the cavity size working at such a low frequency, a ceramic plate was inserted into the cavity gap to increase the equivalent capacitance.As a result, the equivalent inductance decreased accordingly to maintain the resonance frequency, which made the cavity compact.Section 2 introduces the theory and basic formulae for the cavity monitor.Section 3 describes the electromagnetic design of the cavity BCM using CST Microwave Studio.In Sect.4, we introduce off-line tests, including measurements of the working frequency, quality factors, normalized shunt impedance, and linearity and position independence.Section 5 presents an analysis of the effects of proton beams of different energies on the output signal amplitude and beam current sensitivity.In Sect.6, we demonstrate demodulation of the induced signal and evaluate the beam current resolution.Finally, we provide a summary and concluding remarks in the final section.
2 Basic theory of BCMs
When a charged beam travels through a cavity, the beam wakefield excites the eigenmodes of the cavity.Each resonant mode has an energy loss because of the finite conductivity of the cavity material and coupling ports, and the quality factor can characterize the performance [10].
2.1 Single-bunch operation mode
The loaded quality factorQLcharacterizes the total energy loss and is defined as
whereωis the resonant angular frequency,Uis the energy stored in the cavity for a resonant mode andPis the energy loss per angular oscillation of the mode, which consists of the power dissipation on the inner wall of the cavity caused by the ohmic losspwalland the loss caused by the coupling portspext.The unloaded quality factorQ0and external factorQextcan be used to characterizepwallandpext, respectively.
The normalized shunt impedanceR∕Q0describes the energy interaction intensity between the charged particle beam and the cavity [11].If the phase shift between the electric field and the beam is neglected, the ideal normalized shunt impedance is defined as
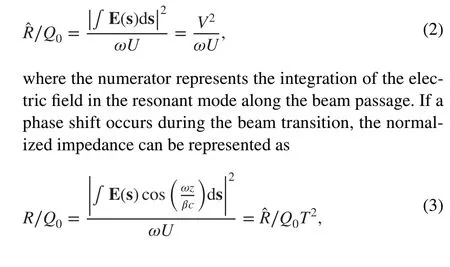
whereβcrepresents the particle velocity andTis the transit time factor, which is a function of the beam velocity.Considering the energy loss at the cavity wall and coupling ports,the decay time constantτis defined as
This represents the time required for the stored energy to reduce to 1/eof its original value.When the bunch interval is significantly longer than the decay time constant, there is no interference from the energy induced by successive bunches.In this case, the cavity monitor operates in singlebunch mode.
After a longitudinal Gaussian distributed bunch whose root mean square (RMS) length isσzpasses through the cavity, the output voltage at the port with characteristic impedanceZcan be calculated as follows [12, 13]:
In the TM010 (monopole) mode in a cylindrical cavity, the axial electric amplitude near the central axis remains relatively constant [14], making it suitable for measuring the beam current.
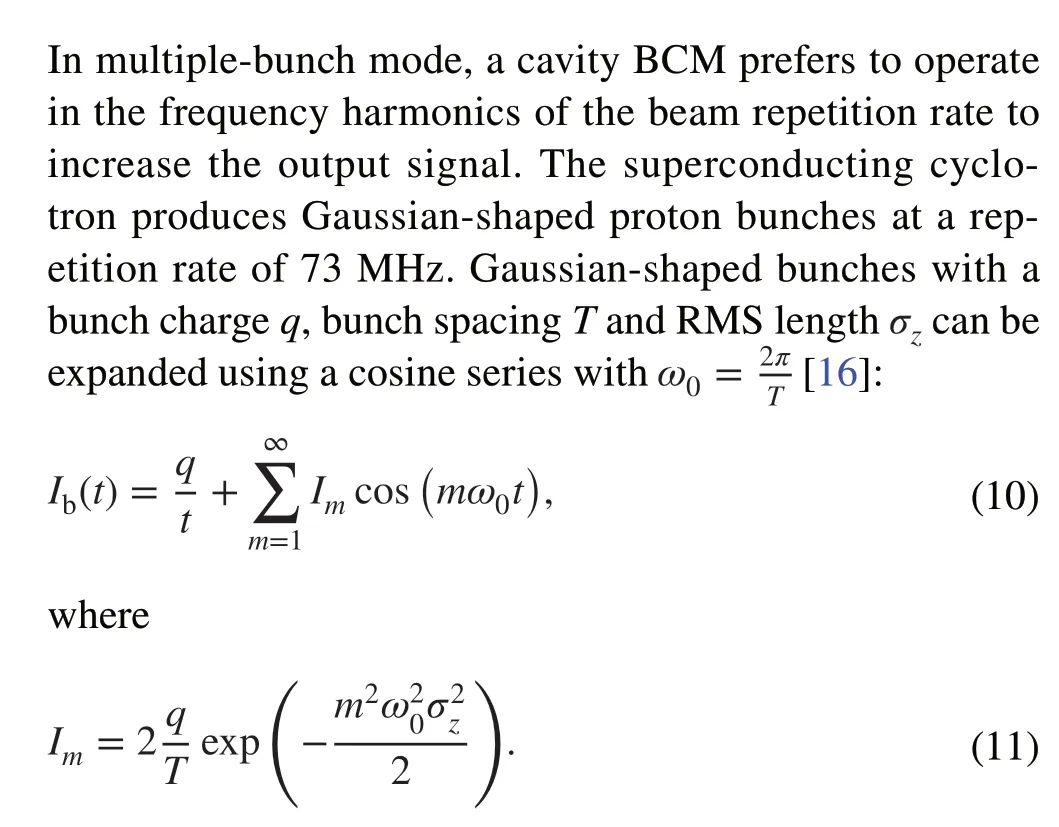
2.2 Multiple-bunch operation mode
When the bunch interval is less than or close to the decay time constant, the cavity monitor operates in multiple-bunch modes, and the output voltage is the superposition of each bunch signal.Assuming that the beam interval isTband the number of bunches ism, the output voltage of the cavity BCM is given by As the number of bunches increases, the output voltage converges to a constant value.
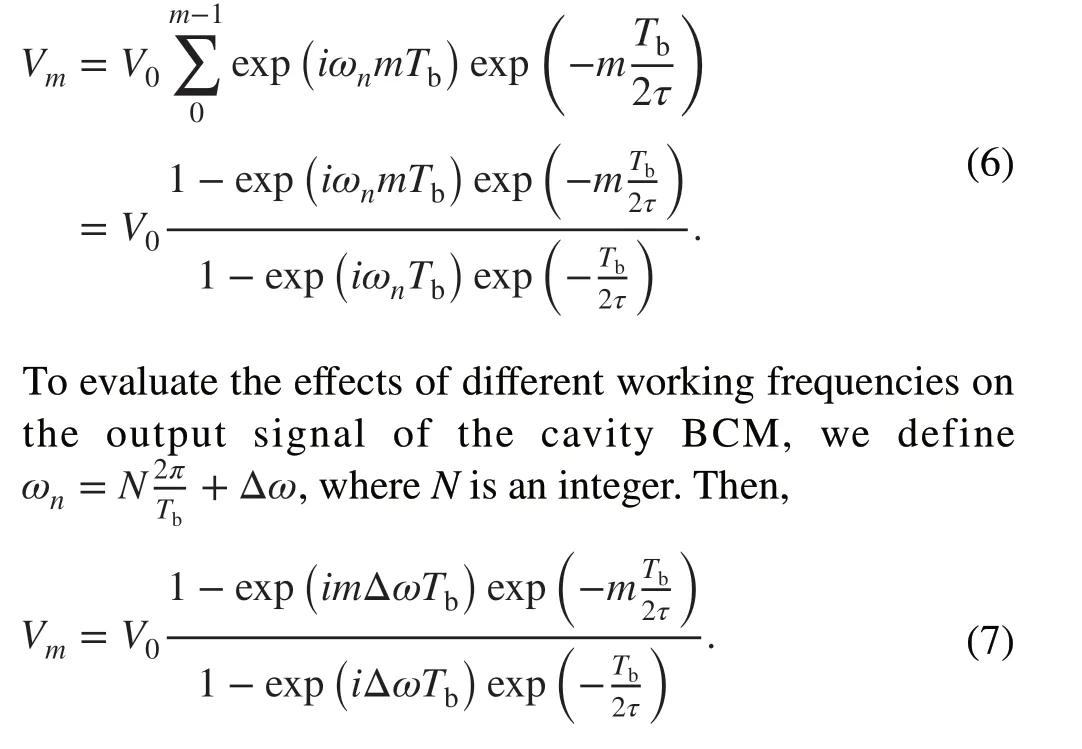
When Δω=0 , that is, the working frequency of the cavity BCM is an integer multiple of the bunch frequency, the output signal reaches its maximum [14, 15].
Compared to the single-bunch operation mode, the multiplebunch mode can amplify the output signal by the gain factor,which has an obvious advantage in the case of low-intensity measurements.In practice, we can adjust the external quality factor to ensure that the cavity monitor operates in the multiple-bunch mode.
3 Design and simulation
3.1 Cavity geometry
It is evident that a lower harmonic contains more beam energy.However, if the cavity operates at the first harmonic frequency, it typically suffers from direct noise from the power generator.In addition, a low working frequency makes the cavity BCM considerably large.Therefore, the working frequency of the cavity BCM was matched to the second harmonic of the bunch repetition rate.Usually, a pillbox cavity serves as a BCM owing to its simple structure and precise machining [5].However, when working at a low frequency of 146 MHz in TM010 mode, the pillbox cavity radius is 78.4 cm.Such a large size prevents precise manufacturing and installation of the cavity BCM.
A reentrant cavity was employed to minimize the cavity size, whose resonant characteristics can be analogized by two lumped elements [17, 18]: the capacitor plate (Cgap)and cavity wall inductor (Lwall).Cgapcan be calculated as follows:
whereεris the relative permittivity of the material filling in the gap,ε0is the permittivity of vacuum, d is the gap height andrminandrmaxare the outer and inner radii of the capacitor plate, respectively.The cavity wall and inner metal cylinder can be regarded as a coaxial line with closed termination based on transmission line theory.The impedanceZ, as seen at the input of the coaxial line, can be calculated as
whereZ0is the characteristic impedance of the coaxial part, which is determined by the outer and inner radii of the coaxial line, h is the length of the coaxial line andλis the free-space wavelength.It is evident that the impedanceZis inductive when the length of the coaxial line is shorter thanλ∕4.The cavity resonates when the gap capacitance compensates for the cavity wall inductor, and the resonant frequency is given by
At a working frequency of 146 MHz,λ∕4 was 510 mm,rendering the coaxial length of the reentrant cavity BCM too large to be acceptable.Owing to the limited longitudinal installation space, the cavity length was set to within 150 mm, which led to a decrease inZwall.Cgapmust be increased to satisfy the resonance frequency, which can be achieved by decreasing the gap length or filling the gap with dielectric materials.For comparison, a common reentrant cavity and dielectric-filled reentrant cavity with the same working frequency of 146 MHz were designed, as shown in Fig.2; the detailed dimensions are listed in Table 2.
According to the comparison, inserting a dielectric material can effectively increase the gap length, leading to a longer interaction path between the charged particle and cavity, which amplifies the output signal.Increasing the gap length also reduces the sensitivity of the TM010 mode frequency.The simulation results show that if the gap height of the dielectric-filled reentrant cavity is 16.7 mm,the sensitivity of the working frequency to the gap height decreases from 23 to 3 MHz/mm, which makes fabrication easier.Dielectric materials use Macor ceramic because of its easy and precise machinability [19].

Fig.2 (Color online) Outline of a common reentrant cavity (a) and dielectric-filled reentrant cavity (b)
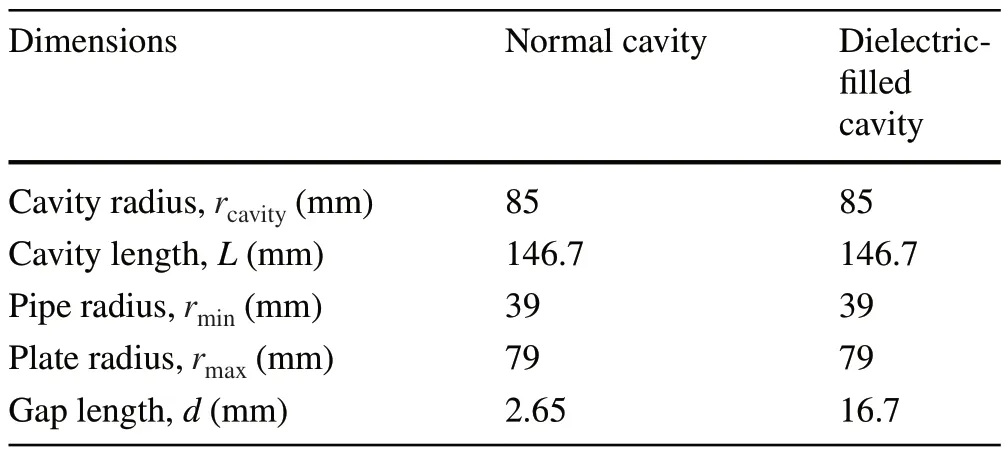
Table 2 Reentrant cavity and dielectric-filled reentrant cavity dimensions (same working frequency of 146 MHz)
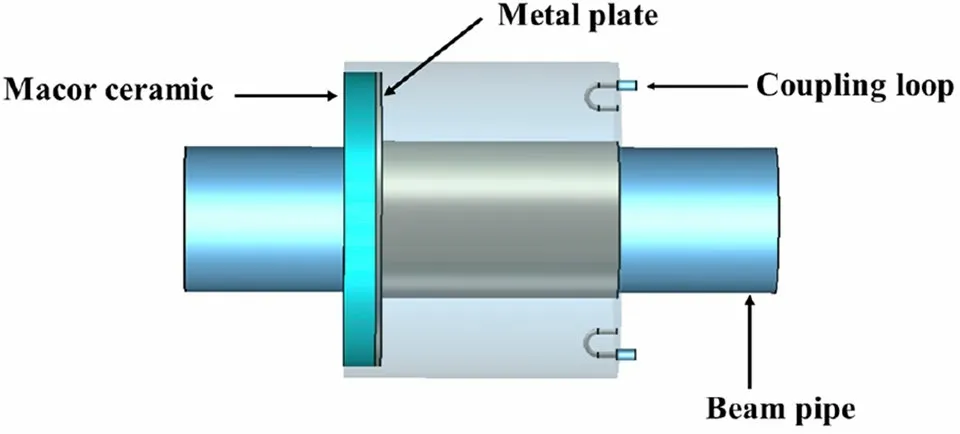
Fig.3 (Color online) CST model of the dielectric-filled reentrant cavity
3.2 Output signal of BCM
Figure 3 shows the dielectric-filled reentrant cavity BCM modeled by the CST [20].The simulation results show that the induced electric and magnetic fields are concentrated in the dielectric plate and coaxial area, validating the lumped element circuit model, as shown in Fig.4a, b.
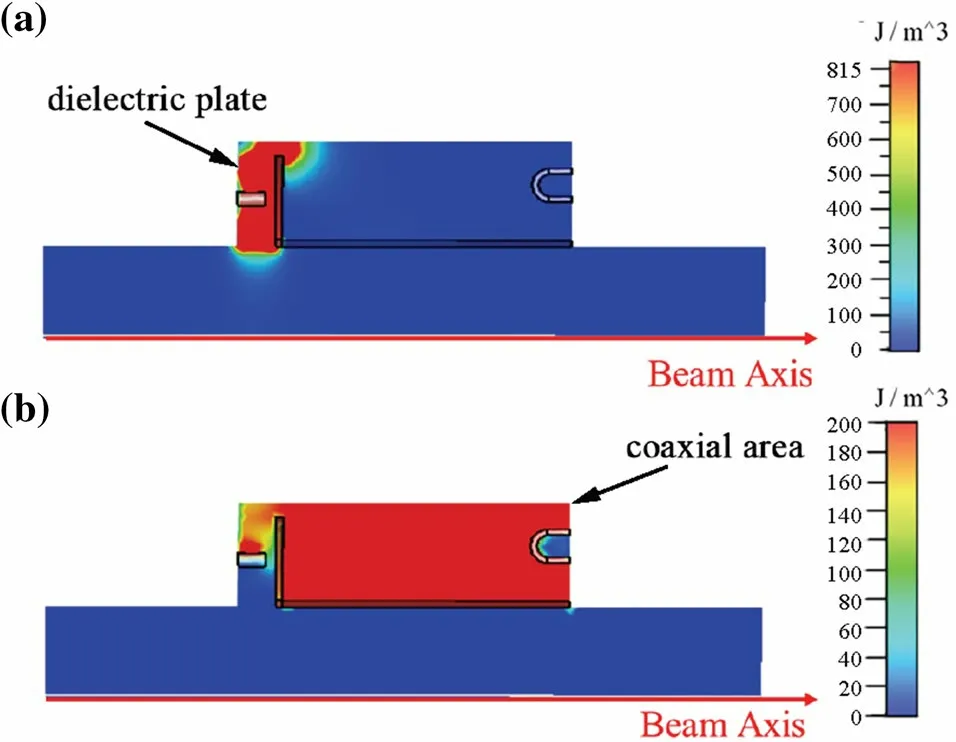
Fig.4 (Color online) Energy intensity distribution of the induced electric fields (a) and magnetic fields (b) inside the cavity

Fig.5 (Color online) Effects of the external quality factor on the BCM signal amplitude and gain factor
A higher output signal requires more induced energy inside the BCM for a given external quality factor.Working in multiple-bunch operation modes, the BCM can accumulate more energy from each bunch, making it possible to determine theQextflexibly to obtain a reasonable output signal.Equation 9 shows that the detectable signal of the multiple-bunch mode is the product of the gain factor and output signal of the single-bunch mode.An increase in the external quality factor can increase the gain factor.However, this reduces the output signal excited by a single bunch, as illustrated in Fig.5.Considering that the dielectric loss accelerates the electromagnetic energy decay, the growth of the gain factor is limited.Eventually, the output signal in multiple-bunch mode decreases with an increase in the external quality factor (Fig.5).Coupling loops were employed to extract the beam current signal, and the port impedance was tuned to 50 Ω.A smallerQextrequires larger coupling loops, which may severely disturb the electromagnetic field distribution inside BCM.Eventually, by adjusting the coupling loop size and orientation in the CST MWS, the external quality factor was optimized to 2000.

Fig.6 Effects of frequency offset on the BCM signal amplitude in multiple-bunch mode

Fig.7 (Color online) Mechanical design of the dielectric-filled cavity: a cross section of mechanical design of the cavity BCM; b corresponding prototype cavity
In a practical cavity, the resonant frequency may deviate from the design owing to the mechanical tolerance and uncertainty of Macor permittivity.Thus, the output signal will change accordingly, as expressed by Eq.12.As shown in Fig.6, the signal amplitude decreased abruptly when the working frequency deviates from 146 MHz.To prevent frequency deviation from reducing the output signal, we installed four tuners to adjust the resonant frequency of the cavity.They were placed in the holes of the Macor plates to increase the tuning range.
4 Off-line tests for prototype cavity
4.1 Manufacture of the prototype cavity

Fig.8 Insertion depths of the tuners versus the working frequency of the cavity

Table 3 Simulation and cold test results
We manufactured the prototype cavity BCM shown in Fig.7.It comprised three main mechanical components.Part 1 was a beam pipe, Part 2 was a concentric pipe that formed a coaxial line with the beam pipe with a closed termination,and Part 3 was the cavity gap filled with Macor ceramic.The cavity was stainless steel 316 L.A 2-mm groove was arranged on a stainless steel plate to fix the Macor ceramic.The coaxial probes were soldered directly onto the cavity wall.The coupling loops were detachable, which was convenient for tuning the external quality factor.Metal rods were employed as tuners to adjust the resonant frequency,and rulers were installed on the tuners to observe the penetration depth.We did not consider vacuum in the design of the prototype cavity.If the cavity BCM is installed in HUST-PTF, the corrugated pipes will replace the rulers to maintain the vacuum.
4.2 Working frequency and quality factors
Using the vector network analyzer KEYSIGHT E5071C, we obtained the resonant frequency and unloaded and loaded quality factors based onS-parameter measurements [21].The normalized shunt impedanceR∕Q0was measured using the bead-pull method [22].The measured data agreed well with the simulation results listed in Table 3.Figure 8 indicates that the tuners could easily adjust the resonant frequency and agree well with the simulation, which proves the correctness of the design.The penetration depth of the tuners could be changed by precession.The moving ranges of the tuners were set from 0 to 15 mm to guarantee sufficient frequency adjustment to satisfy the request.Because the tuners moving inside the cavity exhibited higher tuning sensitivity, the initial position of the tuners was inside the cavity at a depth of 12.5 mm to minimize the tuning sensitivity.
4.3 Beam analog measurement
Because HUST-PTF is currently being developed, we can only employ beam analog measurement to characterize the cavity BCM.Stretched wire measurement is a typical method used to characterize beam monitors.The off-line test platform is illustrated in Fig.9.The prototype cavity was supported by a two-directional displacement platform.A vertical metal wire passing through the center of the cavity served as the longitudinal beam analog.A metal wire was fixed to both sides of the prototype cavity and stretched as tightly as possible.However, the cavity could move transversely with an accuracy of 0.001 mm, precisely simulating an off-axis beam.The 146 MHz sinusoidal signal from a signal generator was fed into the metal wire to excite the electromagnetic fields in the cavity and induce the corresponding voltage signals at the two feedthrough ports.Eventually, the feedthrough ports were connected to an oscilloscope with a fast Fourier transform (FFT) function for further analysis.The reliability of the beam analog was confirmed using the CST, in which the input signals of both the metal wire and bunch had the same longitudinal distribution and Gaussian distributions with RMS widths of 1 ns.The output signals in the frequency domain are shown in Fig.10, which proves the equivalence between the metal wire and the actual bunch.
When a metal wire is employed as a beam analog, the metal wire and beam pipes form a coaxial line, causing electromagnetic energy in the cavity to leak easily through the beam pipe [23].Therefore, the output signal excited by the metal wire is weaker than that excited by the bunch.For each frequency component, the output amplitudes excited by the metal wire and bunch are linearly correlated, which can be written as
wherekis a constant.
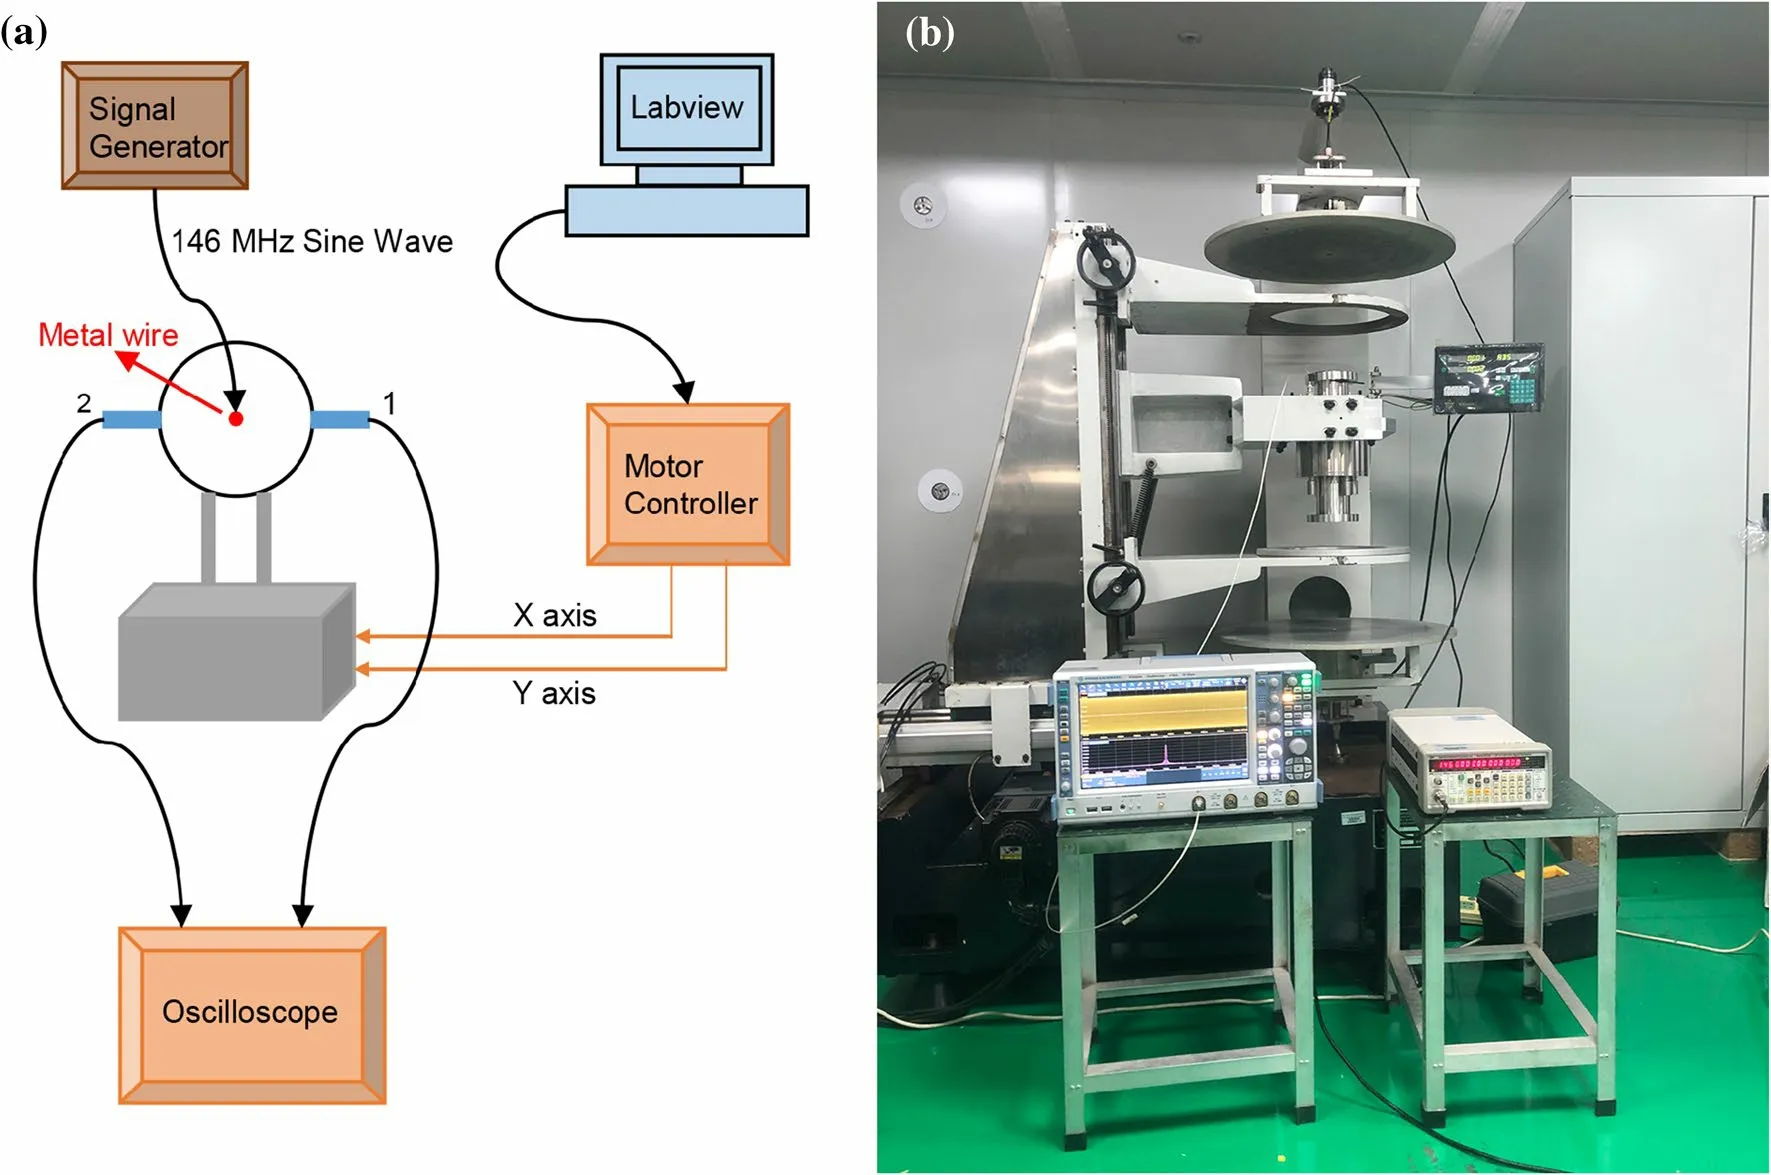
Fig.9 (Color online) Layout of the off-line test platform.On the left is a schematic of the stretched wire method, and on the right is a photograph of the beam analog measurement

Fig.10 (Color online) Comparison of the output signals excited by a bunch and metal wire with the same electric signal
In practice, the proton bunch has a transverse size, and protons at different locations undergo different normalized shunt impedances.A weighted method based on the superposition principle is employed to simulate the bunch with a transverse size [24, 25].A grid is defined in the crosssectional plane of the beam, and each grid point represents the transverse position of the metal wire.According to the transverse distribution function of the bunch, the output signal is obtained by summing the signals of different grid points with weight factors.A smaller grid step size indicates a more accurate simulation, but a longer experimental time.In practice, we employed a 10 mm × 10 mm grid with a step size of 0.2 mm to approximate a Gaussian distribution with 2σof 5 mm [26].The measurement results in Fig.11 show satisfactory linearity between the output and excitation signals.
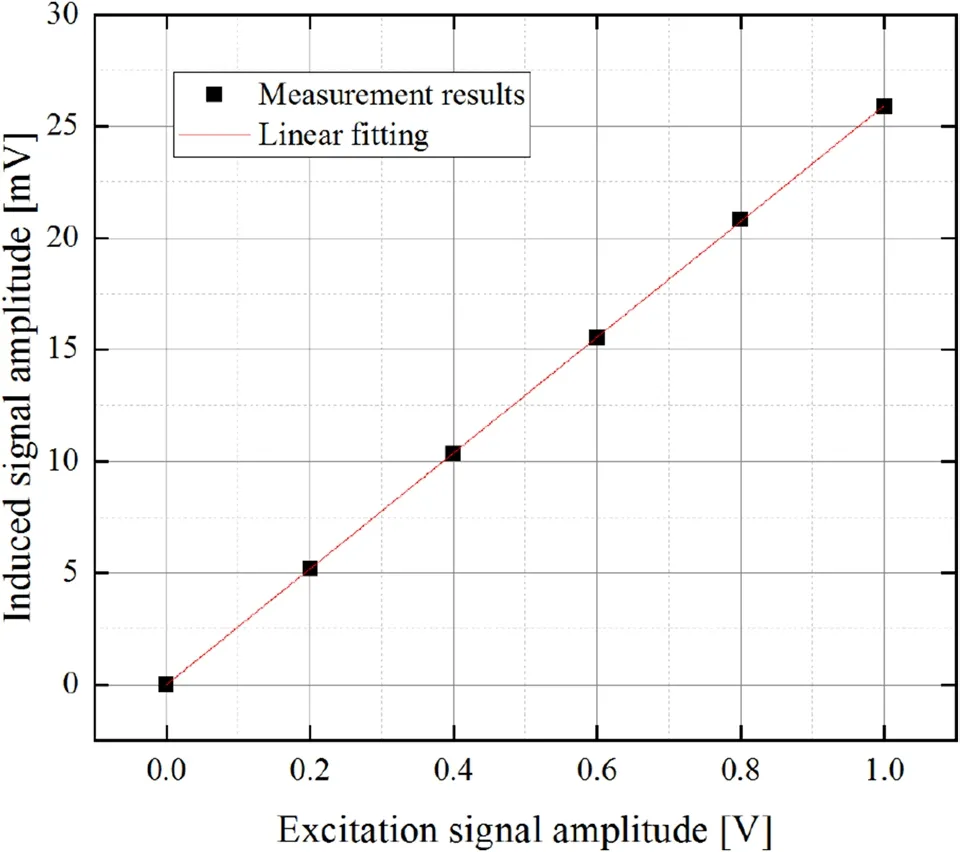
Fig.11 Induced signal amplitude versus the excitation signal amplitude
An ideal BCM should be independent of beam position.We evaluated the dependence of the output signal on the beam offset using an off-line test platform and analogized the bunch at different transverse positions by shifting the platform.The experimental results showed that the transverse position of the beam had a negligible effect on the output signal (Fig.12).The relative amplitude change was within 0.1% even with a 10-mm beam offset.
5 Induced signal modeling
Proton beam energies are nonrelativistic, leading to energydependent velocity and bunch length, resulting in different output signals from the dielectric-filled cavity BCM even at the same beam current.This must be calibrated to guarantee treatment dose accuracy.The cavity BCM was placed just downstream of the ESS exit such that the bunch could maintain the same approximate length of 200 mm at different proton energies.Five different energies were selected to evaluate the output signals, and the results are listed in Table 4,for which the CST post-processing module calculated the transit time factors.We calculated the output signals at different proton energies according to the cold test results and analytical model in Sect.2.The development of the signal envelopes with time is shown in Fig.13, where we artificially injected proton beam pulses of 7 μ s to show a complete process, including signal superposition, a stable peak signal and signal attenuation.The superconducting cyclotron operated in the CW mode, and the output of the cavity BCM was almost stable if the beam energy remained constant.Eventually, the output signal varied from 66.7 to 997.3 nV when the beam current in the designed range varied from 0.35 to 5 nA.The beam current sensitivity was 190.6 nV/nA at 70 MeV.Considering that the transit time factor had a minimum value of 70 MeV, the beam current sensitivity was greater than 190.6 nV/nA in most energy cases.In practical operation of the cavity BCM, we must calibrate the output signal of the cavity BCM in every energy case.An ionization chamber will be placed behind the cavity BCM and used as a reference monitor.Considering the increasing momentum spread caused by the degrader, when the location of the cavity BCM changes,it must be recalibrated owing to the increasing bunch length.

Fig.12 Relative change in the induced signal amplitude versus beam offset
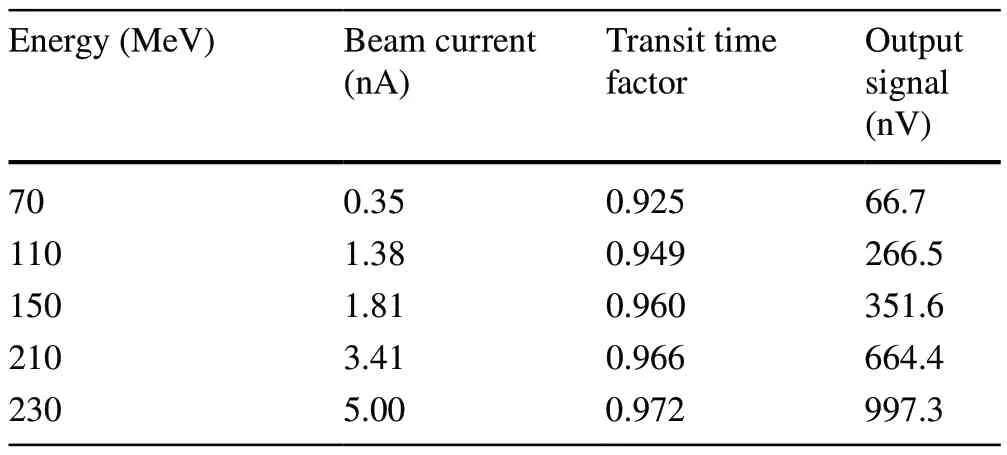
Table 4 Proton beam parameters at the location of the cavity BPM at different energies

Fig.13 (Color online) Output signal envelopes of the cavity BCM in five energy cases
6 Demodulation of the output signals
In the case of demodulating the beam current signal, applying a lock-in amplifier has proved to be very successful [27].Lock-in amplifiers can only extract signals in a defined frequency band and filter out the other frequency components.Because the expected beam current signal is close to the resonant frequency of the fundamental mode, a lock-in amplifier is planned for signal demodulation.
Figure 14 shows a simplified schematic of a typical lock-in measurement.The weak input signal immersed in noise is split into two channels and separately multiplies with the reference signal with and without a 90°-phase shift.The reference signal is a sine wave with the same frequency as that of the input signal.After passing through low-pass (LP) filters, two DC signals with a phase difference of 90°can be obtained.They are fed into analogto-digital converters, and the amplitude and phase of the input signal can be calculated in the CPU.
The UHFLI lock-in amplifier (Zurich Instrument AG)covering the frequency range from DC to 600 MHz is planned for use.The arbitrary waveform generator in the UHFLI lock-in amplifier provides a reference signal of 146 MHz.The noise amplitude in the amplifier output port depends primarily on the bandwidth of the LP filter, which corresponds to a time constant.Reducing the filter bandwidth introduces less noise at the expense of the reaction speed; therefore, a good compromise between them must be made.For a 4th-order filter, ten time constants must elapse to obtain an accurate output signal (99% ) [28].We assume that the time constant is set to 50 ms.In this case,the setting time is 0.5 s.According to the user manual, the noise-equivalent power bandwidth is 1.56 Hz.
According to Nyquist’s theorem, the amplitude of thermal noise,Vn(in unit of V), is represented as


Fig.14 Schematic of lock-in measurement
The calculation results in Sect.5 showed that the signal amplitude of the cavity BCM was between 66.7 and 997.3 nV;hence, the signal-to-noise ratio varied from 13.03 to 194.79.Considering that the beam current sensitivity had a minimum value of 190.6 nV/nA at 70 MeV, even in the worst condition(70 MeV, 0.35 nA), the beam current resolution could still reach 0.03 nA, which is a satisfactory result.
7 Conclusion
This paper presents the development of a dielectric-filled reentrant cavity BCM for HUST-PTF.The working frequency of the cavity was designed to be 146 MHz to match the second harmonic of the bunch repetition rate.The CST software was used to optimize both the cavity and pickup geometries to increase the output signal amplitude.Inserting a dielectric ceramic into the cavity gap can reduce the cavity size and the sensitivity of the working frequency, which reduces the error tolerance and facilitates easier fabrication.A prototype cavity BCM was fabricated and tested.Based on theS-parameter measurements, the cavity was characterized on a stand-alone test bench.TheQfactors and shunt impedances were in good agreement with the simulation results.A stretched wire experiment based on the superposition principle showed that the cavity BCM exhibited satisfactory linearity and position independence.The test results and analytical model demonstrated that the beam current sensitivity was greater than 190.6 nV/nA.A lock-in amplifier is planned to be employed to significantly reduce the noise signal and improve the beam current resolution to 0.03 nA.Although an integration time of 0.5 s limits the functionality of the cavity BCM during patient treatment, it can be used to trigger safety interlocks to handle the beam operation parameters within the expected range.Both analytical and experimental studies have demonstrated that the dielectric-filled cavity BCM is a promising candidate for nondestructive beam current detection at HUST-PTF.
Author contributionsAll authors contributed to the study conception and design.Material preparation, data collection and analyses were performed by Ji-Qing Li.The mechanical design and experiments were performed by Ji-Qing Li and Jian Wang.The first draft of the manuscript was written by Ji-Qing Li, and all authors commented on the previous versions of the manuscript.All authors have read and approved the final manuscript.
Data Availability StatementThe data that support the findings of this study are openly available in Science Data Bank at https:// www.doi.org/ 10.57760/ scien cedb.j00186.00146 and https:// cstr.cn/ 31253.11.scien cedb.j00186.00146.
Declarations
Conflict of interestThe authors declare that they have no competing interests.
杂志排行

Nuclear Science and Techniques的其它文章
- Heuristic techniques for maximum likelihood localization of radioactive sources via a sensor network
- Deep learning for estimation of Kirkpatrick-Baez mirror alignment errors
- Reference device for calibration of radon exhalation rate measuring instruments and its performance
- Measurement of the cavity-loaded quality factor in superconducting radio-frequency systems with mismatched source impedance
- Establishment and study of a polarized X-ray radiation facility
- Development and preliminary results of a large-pixel two-layer LaBr3 Compton camera prototype