Petroleum system analysis-conjoined 3D-static reservoir modeling in a 3-way and 4-way dip closure setting: Insights into petroleum geology of fluvio-marine deposits at BED-2 Field (Western Desert,Egypt)
2023-08-30MohmmdAbdelwhhbEmdAliNbilAbdelhfez
Mohmmd A.Abdelwhhb ,Emd H.Ali ,Nbil A.Abdelhfez
a Geology Department,Faculty of Science,Al-Azhar University,Nasr City,Cairo,11884,Egypt
b Oman Sea PetroServices LLC.,Oman
Keywords:Petroleum system analysis 3D-static reservoir modeling Volumetric assessment Prospect identification Bahariya Formation Western Desert of Egypt
ABSTRACT Imperfect determination of petroleum system processes coincidence,entrapment and charge timing,along with reservoir heterogeneity can considerably cause high risks throughout exploration and development phases of petroleum.Therefore,a complete subsurface visualization of the petroleum system nature,elements and processes,is badly required.To this end,we corroborated,in this study,static reservoir modeling with petroleum system analysis workflows,to better characterize the Cenomanian fluvio-marine reservoir,sandstones of Bahariya Formation,at Bed-2 Field,Abu Gharadig Basin(Western Desert,Egypt).We used dataset of 2D seismic profiles and well logs of eight wells.The geometry and property of the reservoir were acquired performing static reservoir geocellular modeling approach.The geohistory,timing of charge,migration pathways,and accumulation sites were identified performing 1D and 2D basin modeling approaches.Combining both approaches was aimed at identifying new petroleum prospect areas,and estimating the hydrocarbon volumes,that are the need for such poorly-defined petroleum systems area.As indicated by the constructed,robust,reservoir and 1D-2D basin models,an additional hydrocarbon prospect,to the north central part of Bed-2 Field,is proposed to be drilled during the further oilfield development phases of the area.This prospect has all features that adequately lead to reliable inferences regarding the ultimate petroleum potential of the area.
1.Introduction
For simulating reservoirs,estimating hydrocarbon volumes,proposing wells,and optimizing production;3D geocellular models are nowadays built [1-5].Static information (like lithology,porosity,and structure) [6] alongside dynamic ones (like fluid flowing simulation) [3,7],generally make up the reservoir model.Employing seismic and well logging datasets [1],static models define the reservoir geometry and property[8],that do not change over time [5],and do not go further to fluid flow simulation [9].
Petroleum systems analysis workflow regards (1) source rock characterization,(2)fluid characterization,and(3)basin modeling[10,11].Basin modeling retrieves the geohistory of sedimentary basins over time,predicting petroleum generation-migrationaccumulation processes [10,12,13].Basin modeling has just become the main tool in finding out the basin's thermal evolution and the associated organic maturities [14].
In Egypt,hydrocarbon discoveries are currently found in Western Desert [15].North of 29°,small rift basins,having commercial accumulations of hydrocarbons,discern the Western Desert [16].Potential reservoirs and sources have been proved in Western Desert(Egypt),after a long history of exploration,like Upper Cretaceous Bahariya and Middle Jurassic Khatatba formations[17-30].
Abu Gharadig basin;E-W trending intra-cratonic basin[18,31,32];to the east of Qattara Depression (longitudes 27°15’ -29°15′E,and latitudes 29°00’-30°15′N;with an area of 17500 km2)[33,34];is of most prolific basins in the North Western Desert[35].It was developed after the extensional tectonics affected the north of Egypt over the Mesozoic Era[31].
Bed-2 Field(Fig.1),between latitudes 29°52′and 29°56′N and logitudes 27°40′and 27°44′E,is located in the western part of Abu Garadig basin;to the northeastern part of the Mid-Basin Arch(NESW trending anticlinal feature divides Abu Gharadig basin into estern and western parts) [18].It was discovered in 1982,and has been producing since 1992 [36].Cenomanian sandstones of Bahariya Formation and Middle Jurassic-Early Cretaceous shales of Khatatab,Alam ElBueib,and Kharita formations feature the petroleum system of the area.
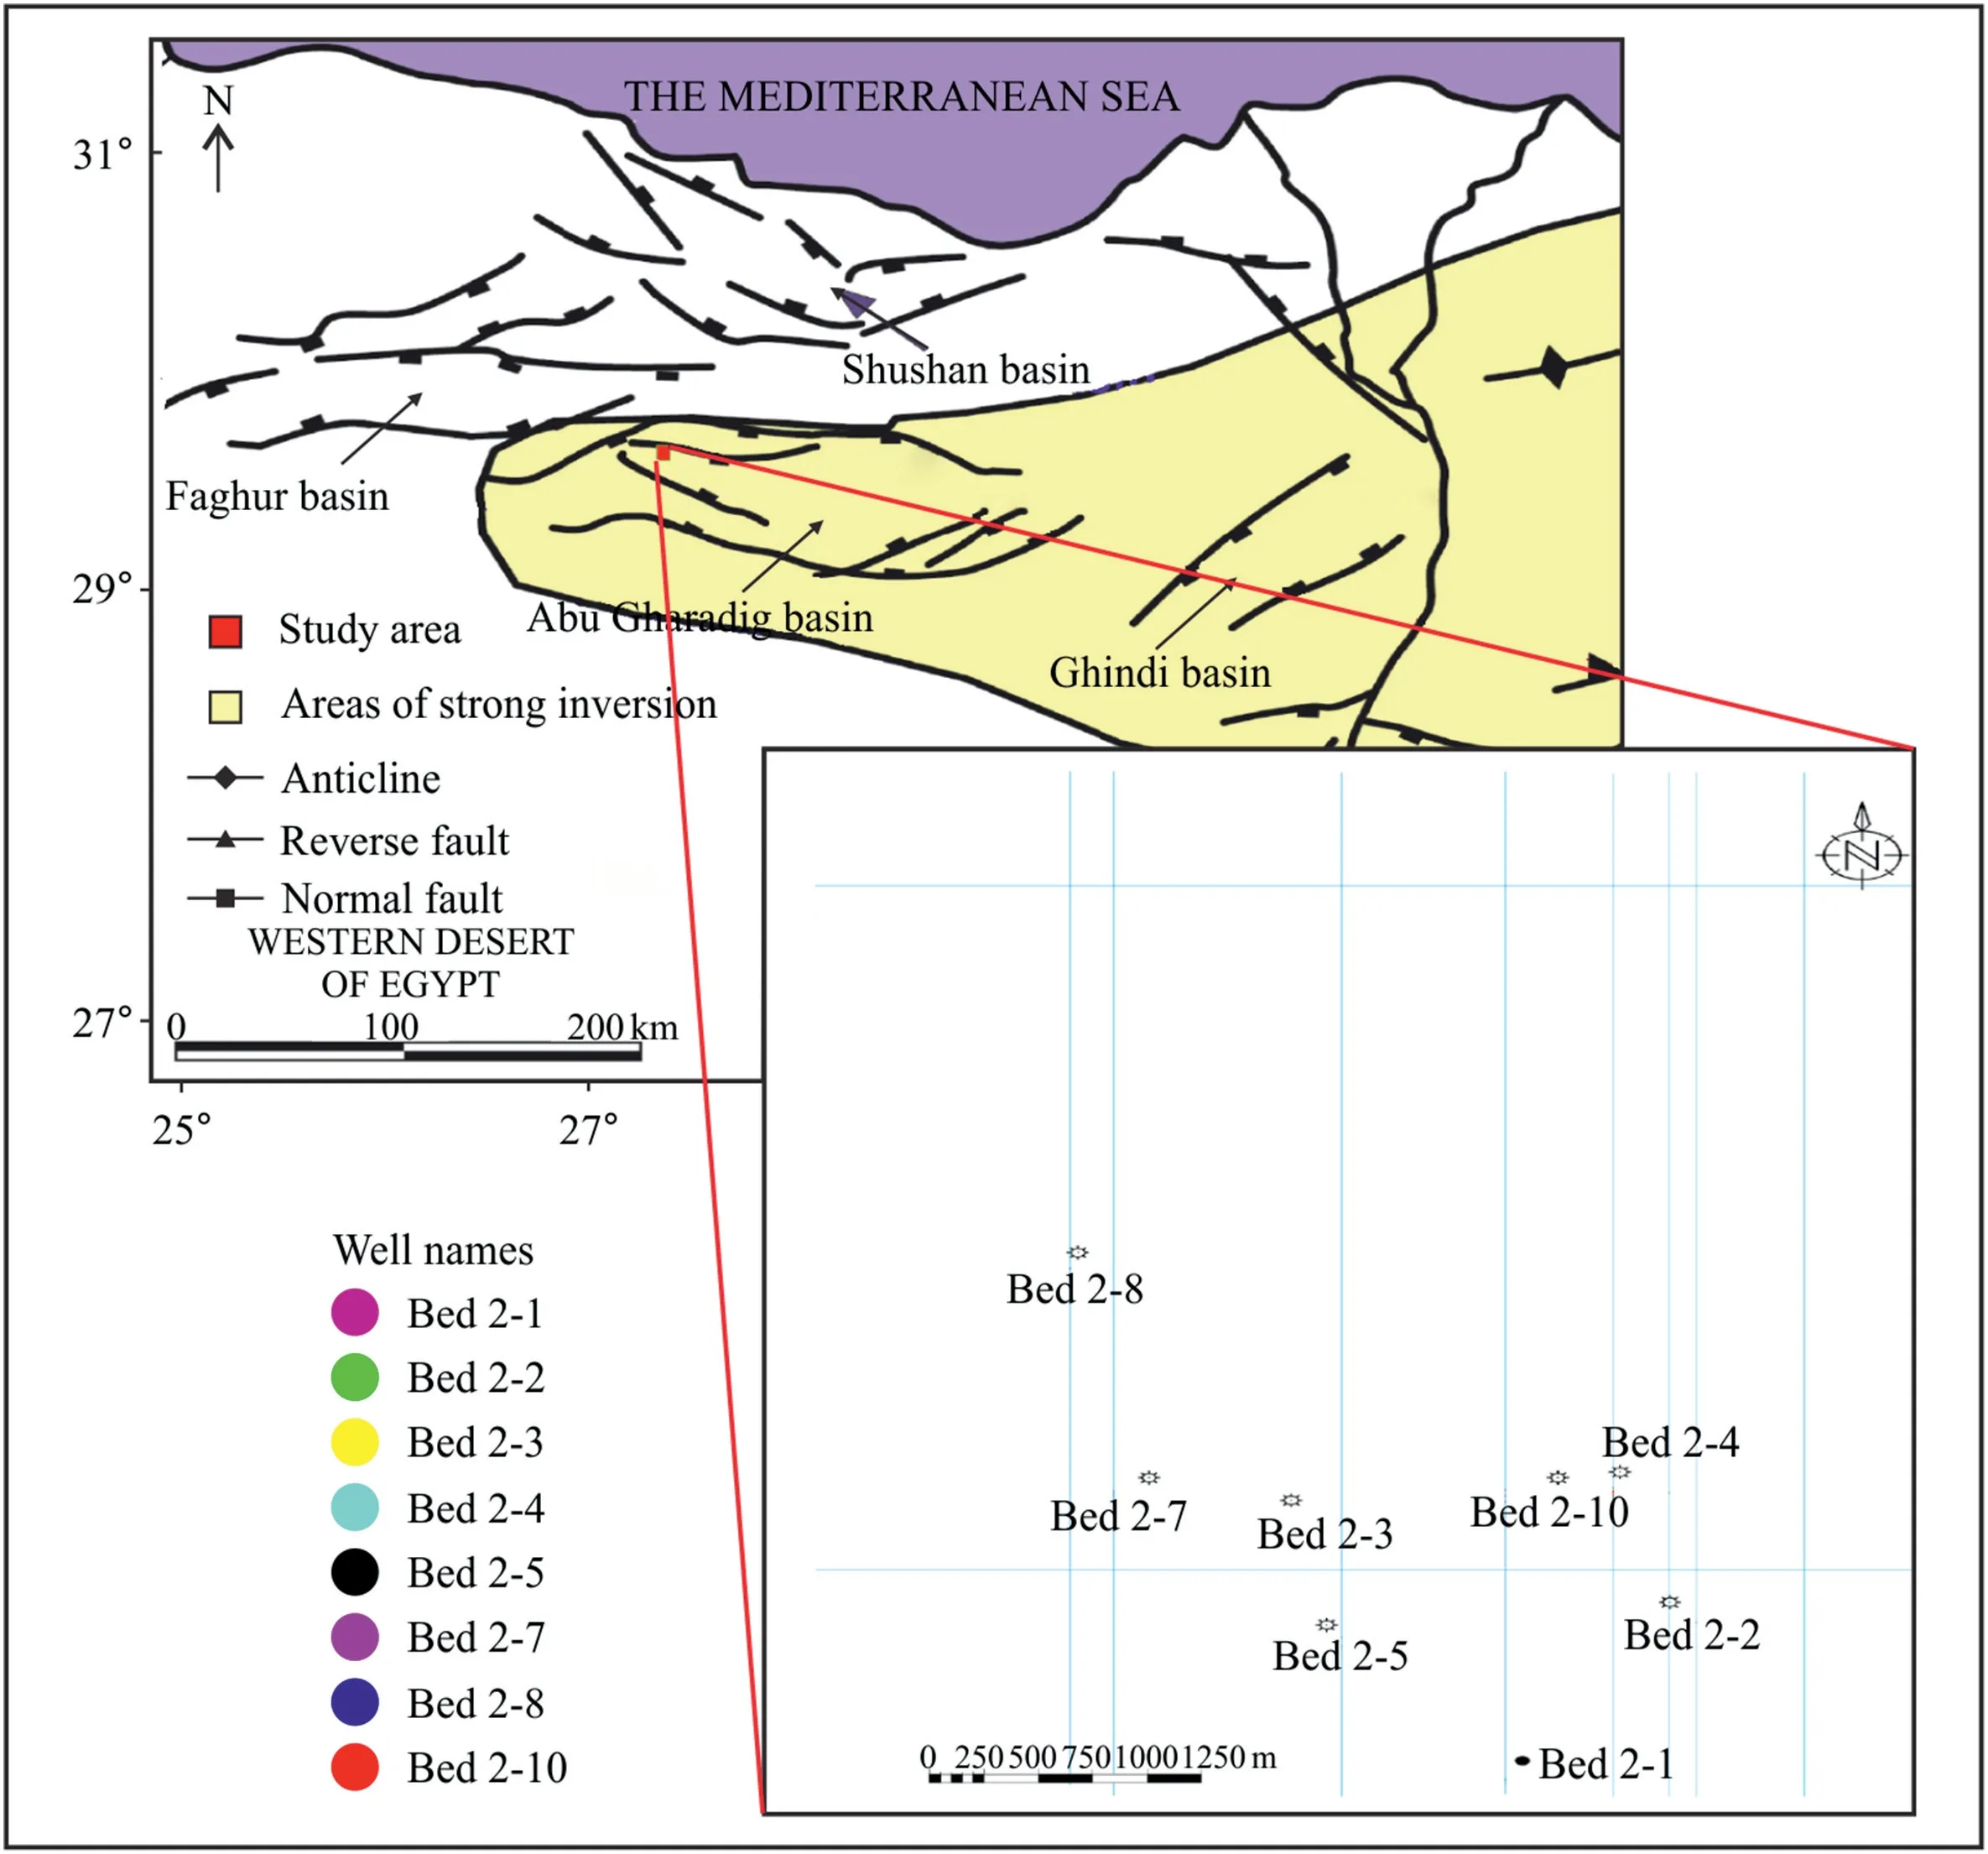
Fig.1.Location map of Bed-2 Field within Abu Gharadig Basin,with main structural trends,adopted and modified after Sarhan and Collier [42];and Bosworth et al.[45].
Although much literature investigated Abu Gharadig area[16,27,32,35,37-44],reservoir and 1D basin modeling approaches were very little performed.Moreover,2D basin modeling,addressing the preferential migration pathways and sites of hydrocarbon accumulation,has not been ever performed.Furthermore,timing of entrapment and hydrocarbon charge coincidence was not yet elucidated.Therefore,the ultimate assessment of the petroleum potential of the area is still ill defined.Thus,an essential need to unravel the petroleum system operating the area is critically required.Accordingly,in this research,we developed static reservoir model,corroborated with petroleum system analysis workflow,to adequality define the reservoir boundaries;proposing new development wells and unlocking the extreme potential of the study area.
2.Geological settings
Over the Middle Jurassic-Lower Cretaceous time period,NE-SW and E-W trending sedimentary basins were developed along the northern margin of the Western Desert(Egypt).These basins were developed along pre-existing lines of weakness in basement,in response to the movement between Europe and Africa (Tethyan rifting)[46-48].During the Paleozoic,many phases of deformation caused the presence of NNW-SSW trending normal faults and gentle folding along with unconformities intruded the Paleozoic intervals.These structural features were primarily resulted from the vertical movements of basement blocks [49].
Abu Gharadig basin was initiated,over the Jurassic-Cretaceous periods,as a pull-apart basin,with NW-SE and E-W trending extensional and wrench faults [47,50],before being finally considered a rift one bounded by dextral(right-lateral)shears at northern and southern sides,and Cretaceous normal faults at eastern and western sides [47].Abu Gharadig basin experienced multi-stage tectonic evolution;passive margin (Paleozoic),rifting (Jurassic),passive margin (Early Cretaceous) [14],and inversion (Late Cretaceous-Alpine Orogeny during Syrian Arcing deformation)[35,51-54].This compressional regime was responsible for basin tilting and northeast-southwest asymmetrical anticlines [55],plunging northeastern-ward and intersected by NW trending normal faults [54].Three structural highs divide Abu Gharadig Basin;namely,from west to east,Mid Basin Arch,Abu Gharadig Anticline,and Mubarak High [47].The structural patterns at Abu Gharadig basin are predominantly NW-SE and NE-SW oriented faults,suggesting regional strike-slip movements [56].Normal,reverse,and wrench faults exist in Abu Gharadig basin.Simple normal faults were predominantly initiated,trending E-W,ENE,and WNW,then developed strong dextral components.The contractional faults were relatively few,trending E-W and ENE[57].The fault blocks and faulted anticlines are favorable places for petroleum accumulations at Abu Gharadig basin [58].
Many sedimentary basins,having a thick section of Mesozoic deposits,feature the northern Western Desert.Many authors investigated the stratigraphic sequence of theses basins[41,59-64].The North Western Desert's stratigraphic column,including Abu Gharadig Basin,ranges from Precambrian up to recent(Fig.2).It is made up of alternating sequences of clastics and carbonates [15].

Fig.2.Stratigraphic succession of Western Desert of Egypt,adopted and modified after Abdel-Fattah [73].
Sultan and Abdelhalim[49]recognized four sedimentary regressive cycles,ended by marine transgressions,make up the Mesozoic-Cenozoic succession in the northern Western Desert(including Abu Gharadig basin).Firstly,Lower Jurassic non-marine clastics (Ras Qattara Formation) unconformably rest on the basement and are overlain by Middle Jurassic deltaic shales and sandstones with little limestones(Natrun and Khatatba formations).The maximum Jurassic transgression was marked by the formation of Masajid Formation with a major unconformity separates Masajid from the most bottom part of the second cycle(Alam El Bueib Formaiton).Secondly,shallow marine sandstones and carbonates;marine shales;fluviatile sandstones;to alternating shales,sands and shelfal carbonates form the Lower Cretaceous Alam ElBueib Formation,from bottom to top.A transgression culminates Alam ElBueib Formation in Aptian Alamein Dolomite Formation.Shales of Dahab Formation terminates the cycle with an unconformity separates Dahab Formation from the floor of a third cycle (Kharita Formation).Thirdly,continental -shoreline sandstones form the Albian Kharita Formation that underlies the shallow marine -nearshore deposits of the Cenomanian Bahariya Formation.Noticeable deep-conditioned depositional setting is represented by the deposition of Abu Roash “G” Member,Late Cenomanian,of Abu Roash Formation.Till the Senonian,a widespread transgression,featuring carbonates,caused the deposition of“F”-“A”members of Abu Roash Formation that unconformably underlie Khoman Chalk Formation.Fourth,the Eocene Apollonia Formation,that unconformably overlies Khoman Chalk,triggers the fourth cycle.The marine clastics of Dabaa and Moghra formations,that are capped by limestones of Marmarica Formation,follow Apollonia Formation[65].
The Cenomanian Bahariya interval is the focus of this study.It is colourless -pink,fine to medium grained sandstones with interbeds of shale and streaks of carbonates [66].Two rock units compose Bahariya Formation;the upper one and the lower one(Razzak Member) [67-69],that can be recognized by the carbonates marking its top [70,71].The fluvio-marine [67],Bahariya Formation is considered among the important petroleum reservoirs in northern Western Desert[72].
3.Data and methods
The dataset used in this study (Fig.1) include TWT seismic profiles,checkshots,and complete set of log data,for eight wells(e.g.resistivity,gamma ray,neutron,density,and sonic logs),with age-determined and interpreted stratigraphic tops.This study implemented a combined modeling workflow (Fig.3) that corroborates static reservoir modeling with petroleum system analysis approaches.
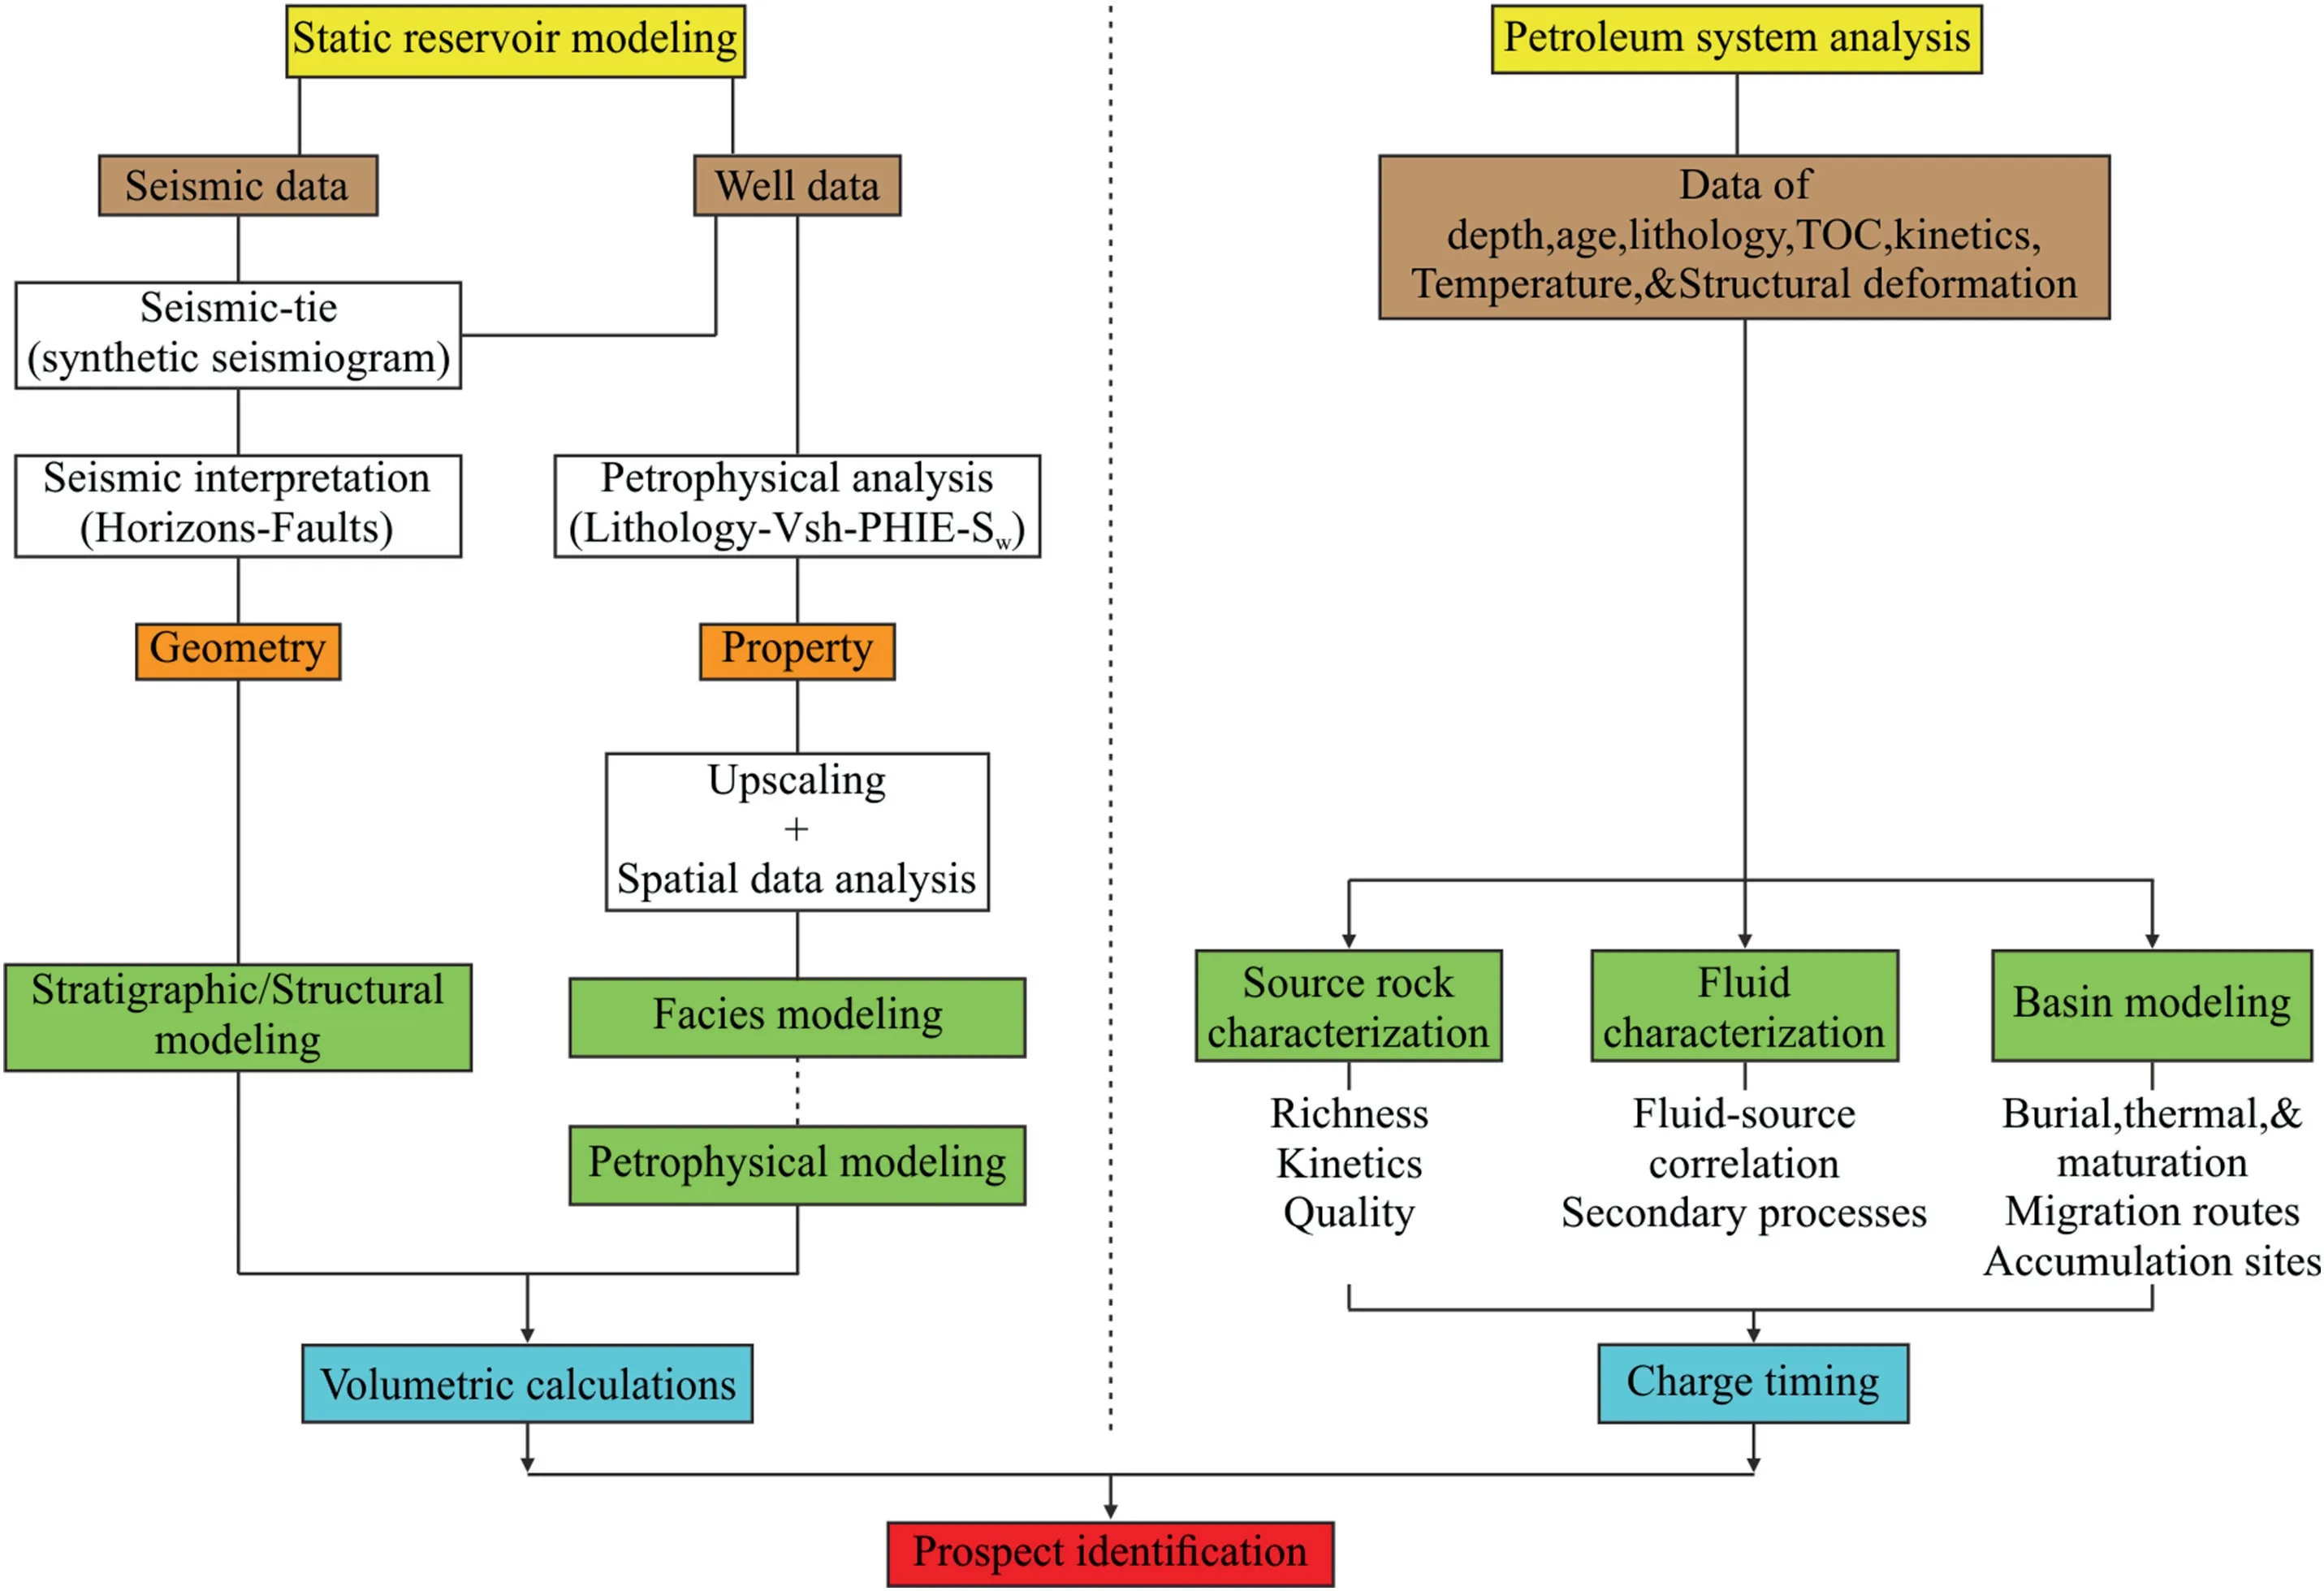
Fig.3.Integrated workflow performed in this study.
Seismic interpretation has been causing an increase in the rate of exploration and development plans worldwide[74].To incisively delineate the reservoir framework (stratigraphy and structure),seismic interpretation is essentially needed [8].Relating stratigraphic horizons to seismic reflection[75],seismic-well tie,is a first necessary step for seismic interpretation[76].Linking stratigraphic tops to seismic reflectors was done,in this study,following established 1D synthetic seismograms (an example is shown in Fig.4).Synthetic traces were produced by convolving reflectivity series,estimated in this study from sonic and density logs,with the extracted wavelets [77].Well-log quality control (QC) analysis,fixing log spikes,leads to better generating synthetic seismic traces that can be used in seismic-well tying[78].Mis-ties are related to S/N (signal-noise) ratio and also exist when the real seismic trace does not have the same wavelet of the synthetic trace [79,80].Moreover,poor quality of sonic and density logs (regarding building reflectivity series),and shallow reflections’ lower post-stack seismic data,can cause mis-ties [81].The established synthetic traces were matched,in this study,with real seismic profiles at well locations.Upon attaining a satisfying seismic-well tie,with correlation coefficient exceeding 0.7,stratigraphic tops (Dabaa,Apollonia,Khoman,Abu Roash “A",Abu Roash “B",Abu Roash “G”,Bahariya,and Kharita) were picked throughout the seismic lines.Recognizing horizons and faults on seismic profiles,to construct structural and thickness maps,is what seismic interpretation generally targets [82,83].Time depth conversions were done via velocity model built from time-depth relationships and average velocities generated from the established 1D synthetic seismograms[76].For well log-based formation evaluation,petrophysical properties of rocks (shale content,effective porosity,and fluid saturation),along with facies recognition,are basically required.Moreover,facies recognition from well logs corroborates the rock facies got from seismic analysis [84].Based on log analysis,rock properties (reservoir architecture) were obtained,in this investigation,to be employed in the 3D model grid while performing the property modeling [8].
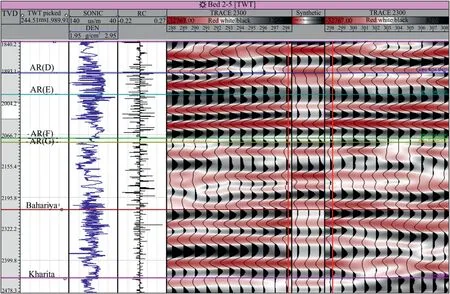
Fig.4.Synthetic seismogram of Bed 2-5 well demonstrating the seismic-well tie (AR: stands for Abu Roash Formation;see Fig.2 for more stratigraphic context).
Structural,stratigraphic,facies,and petrophysical models constitute the 3D grid static geocellular reservoir modeling.The static reservoir model stands for illustrating reservoir's geometry and property;and estimating the hydrocarbon volumes as well.It must be built using depth,so it is needed to make time-depth conversion after interpreting stratigraphic horizons and faults[85].Starting with building a 3D structural grid (including fault pillars gridding,making horizons,making zones,and making layering),the 3D model grid is constructed[76].Upscaling log data(facies,shale content,porosity,and fluid saturation),to be inputs for facies and petrophysical models,is the next step [5,86].Performing geostatistical data analysis,employing global distribution and variograms(defining direction and amount of variance of data),stochastic simulation algorithms (like SIS [sequential indicator simulation]and SGS[sequential gaussian simulation])were applied to illustrate the facies' spatial distribution [87],and petrophysical properties [5],within the 3D grid cells.Unlocking reservoir heterogeneity is adequately accomplished by integrating such models(facies and petrophysical) [30,88].Volumetric calculations,in this study,were last steps [89],within reservoir modeling.The field's economic potential is indicated by the hydrocarbon volumes [90].In this study,the volumetric method[91],was used to calculate the volume of oil and gas existing in Bahariya Formation reservoir.
Histories of burial,thermal,and also maturation levels of sedimentary basins are studied performing basin modeling approach[14,50,92-100].Petroleum system analysis (PSA) workflow involves (1) source rock characterization (thickness,richness,kinetics,gas-oil ratio (GOR),etc.),(2) Fluid characterization (fluid source correlation,secondary processes,charge episodes,and PVT behavior),and(3)basin modeling(burial,thermal,and maturation models;charge timing;migration routes;and accumulation sites)[10,11].In this paper,we followed petroleum systems analysis(PSA)workflow as for characterizing source rocks (based on well logs);and performing basin modeling approach.Geochemical fluid characterization was beyond our paper's scope.We applied Passey's ΔLogR method for estimating TOC (total organic carbon),using resistivity and porosity logs' (neutron,density,or sonic) apparent separation when being scaled[101].Moreover,we defined kinetics,hydrogen indices,and quality of source rocks using TOC (total organic carbon) and S2 (remaining hydrocarbon generative potential) cross-plots following Dembicki Jr [12].Furthermore,we performed 1D basin modeling;utilizing information of age,depth,lithology,organic matter richness,kinetics,and boundary conditions;to model the burial history,and thermal maturation of the sedimentary basin.2D basin model was also constructed,utilizing the structural attitude and fault sealing analysis of stratigraphic intervals,so as to simulate the migration patterns and sites of accumulation.Assumption of vertical migration of petroleum until reaching seal beds,and then lateral migration towards structural highs,has been considered [102,103].
4.Results and discussion
4.1.Stratigraphic modeling
Interpreting stratigraphic horizons on seismic profiles,constrained by synthetic traces,completes the reservoir's geometry.The intervals top and base,illustrated from well correlation of horizons,brought out as thickness maps,are what is needed to present the reservoir framework [1].Lithostratigraphic correlation,displaying variation of thickness,may provide clues to areas of subsidence and others of uplifting [76].
Lithostratigraphic correlation (Fig.5) and isopach map (Fig.6),show the variation of thickness of Bahariya reservoir.Bahariya Formation is having comparatively the same thickness,however noticeable increase of thickness is directed towards the southeastern part of the area where the subsidence rate,caused by structural behavior,increases.
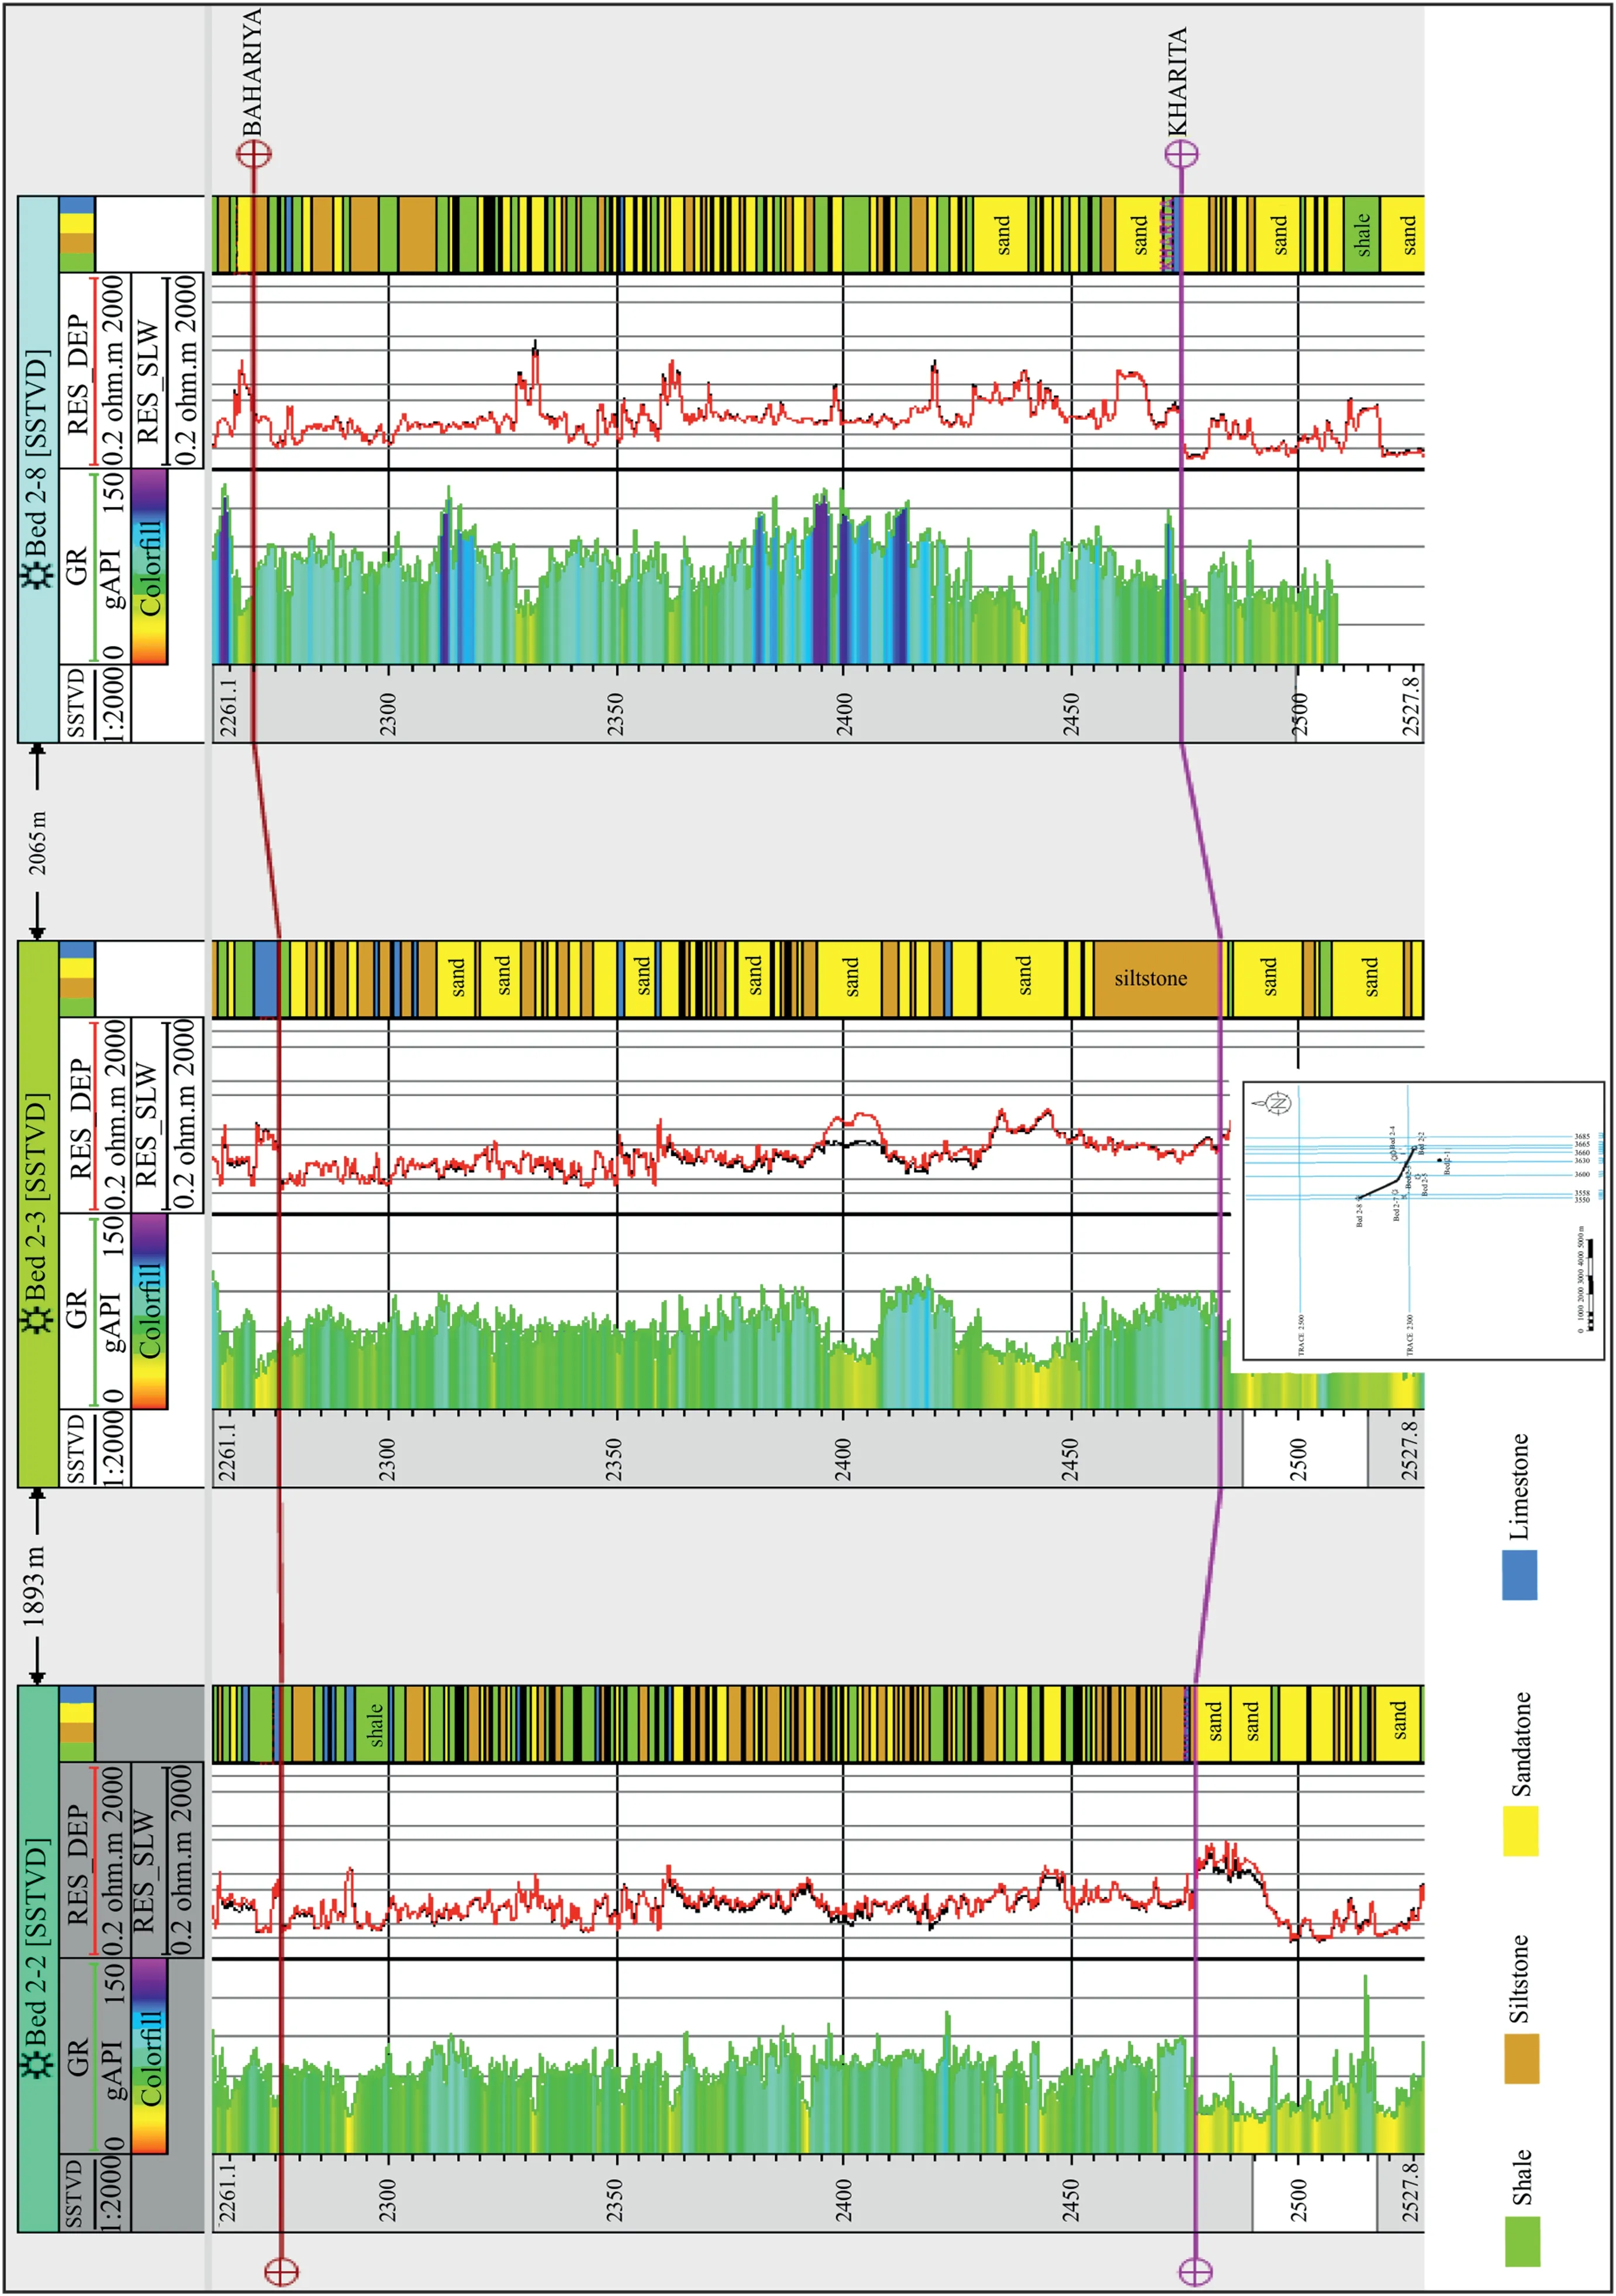
Fig.5.Lithostratigraphic correlation chart.

Fig.6.Bahariya Formation's isopach map.
Bahariya Formation represents a 2nd order depositional sequence formed in continental shelf settings[64].Fig.7 shows that Bahariya Formation is subdivided into two 3rd order depositional sequences;built upon the lateral and vertical change between fluvial,coastal,subtidal,and shelf facies.The sequence stratigraphic subdivision of Bahariya Formation demonstrates the framework and stacking patterns of different lithologies preserved in the study area,and helps define the historical stages of base-level change that marks the evolution of Bahariya Formation during the Cenomanian age.
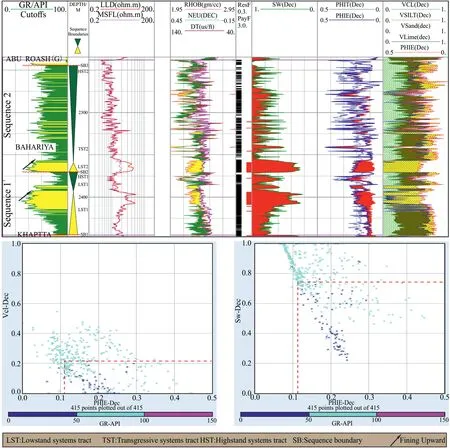
Fig.7.Sequences,facies,and petrophysical log of Bed 2-3 well.
4.2.Structural modeling
Building 3D structural grid,after seismic interpretation,is the first step in constructing geocellular reservoir models.The 3D structural grid's main components are interpreted stratigraphic horizons and faults [1,6,104].
To define structural patterns,framework,controlling the area,stratigraphic horizons and faults were picked out (Fig.8) and also traced throughout the area.Fig.9,a structure map on top of Bahariya Formation,shows that the area of study has been affected by seven northwest-southeast trending extensional faults (F1 to F8),and one northeast-southwest trending normal fault (F9),developed in response to the Middle Jurassic-Lower Cretaceous Tethyan rifting [46-48].These faults have divided the area into a number of horst and graben systems,3-way dip closures,favorable for hydrocarbon accumulations.Furthermore,the 3D structural grid-based model (Fig.10),involving fault and horizon modeling[1],demonstrates the ultimate structural demeanour affected on Bed-2 Field.
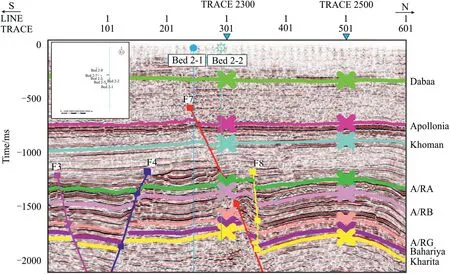
Fig.8.Interpreted seismic section showing the structural demeanour (F: stands for fault.A/R: stands for Abu Roash).
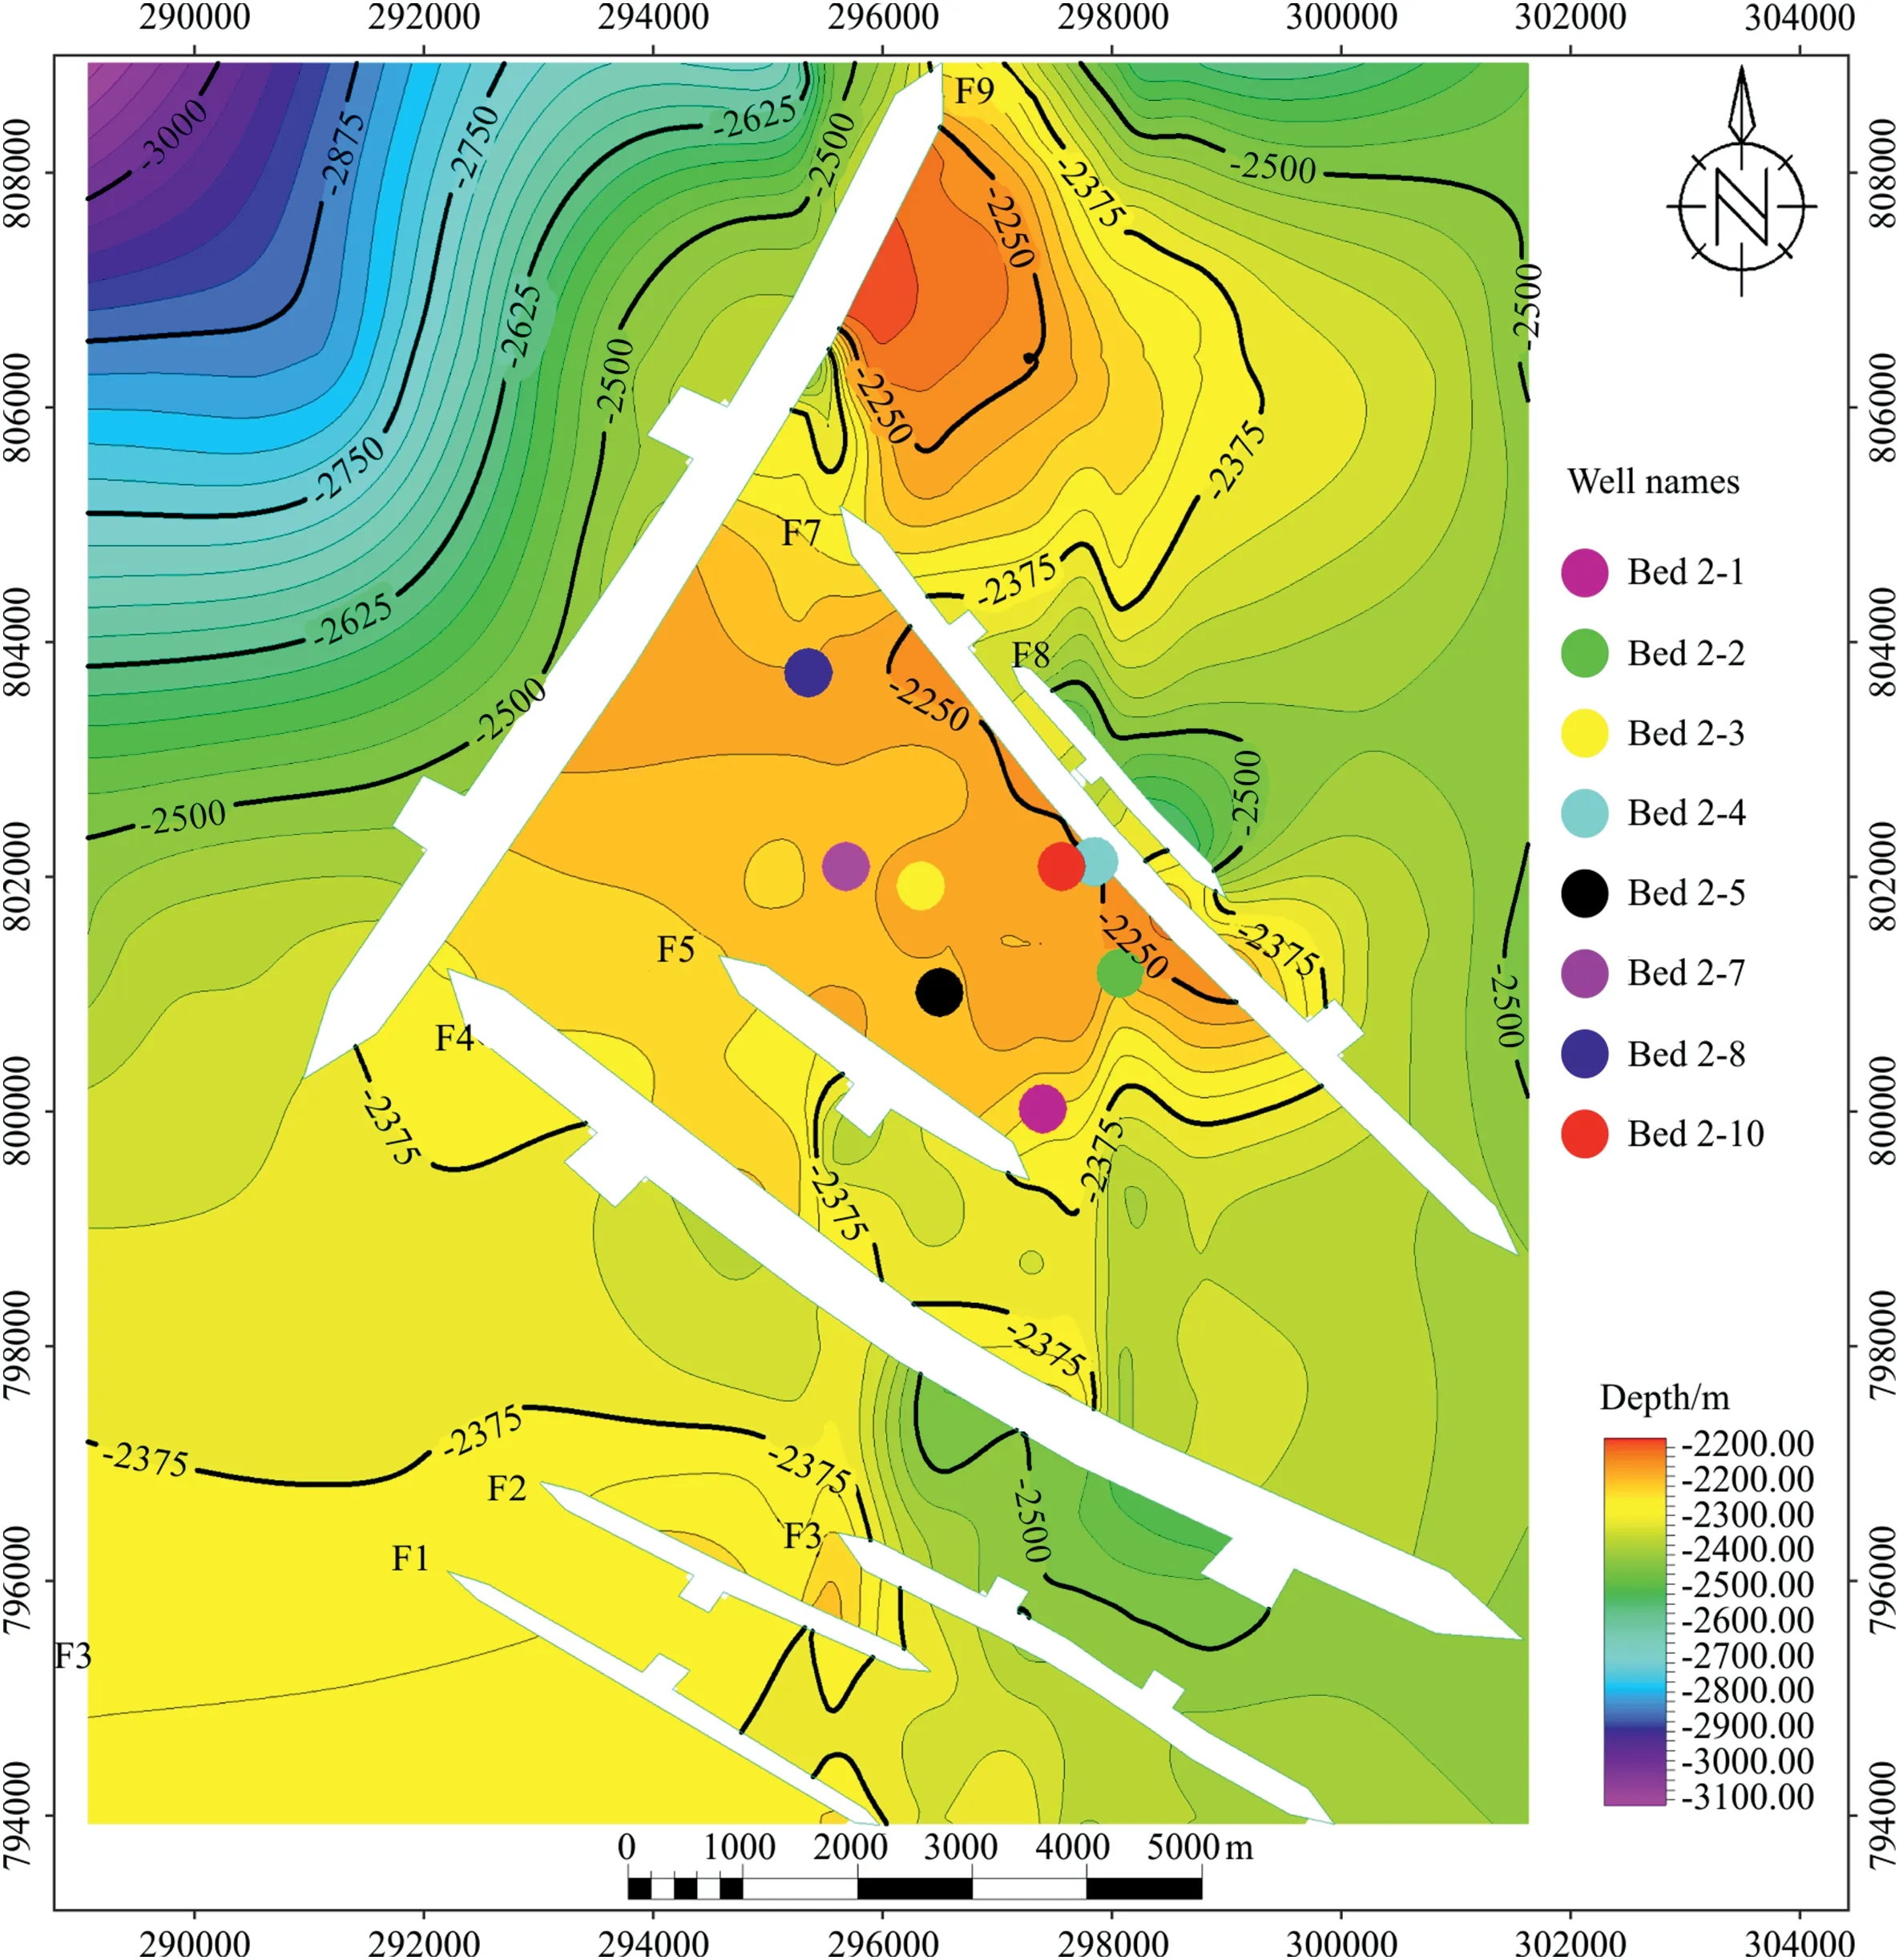
Fig.9.Structure map on top of Bahariya Formation (F: stands for fault).

Fig.10.3D structural grid-based model of Bahariya Formation ((a): fault modeling;(b): horizon modeling).
4.3.Facies modeling
Facies modeling targets capturing the “medium-scale” rock heterogeneity into the 3D grid geocellular reservoir model.While structural modeling delineates reservoir's framework,facies modeling marks the edge of reservoir's internal architecture [1].The first step in constructing the facies model is to build a discrete facies log,that is then upscaled (Fig.11) in preparation for embodying in the 3D model cells during populating such property [86].Variogram analysis (an example of demonstrating the geostatistical variance of property is shown in Fig.12) is a following step precedes applying the SIS (sequential indicator simulation) algorithm as a way of pixel-based stochastic simulation.Quality control (QC),Fig.11,of data shows good matching between original logs and upscaled ones,approving the number of layers selected in the layering stage of the 3D grid structural model.

Fig.11.QC (quality control) of upscaled facies and petrophysical logs.
The estimated proportions of facies (37.16% shales,30.16% siltstones,32.1% sandstones,and 0.58% carbonates) are shown in Fig.13.A relatively thicker and higher proportion of shale is displayed,on proportion curves,in comparison with,nearly the same,proportions of sandstones and siltstones (Fig.13b).Sandstone proportion increases in lower parts(Fig.13a)of Bahariya Formation(where shale decreases),and decreases in upper parts(where shale increases),indicating alteration from fluvial at lower parts to shallow marine,environments,at upper parts.Bahariya reservoir's facies distribution model is shown in Fig.14.A wide range of shale's distribution is located in east central (where low producing wells occur),northeastern,northwestern,and southwestern parts.Despite that,good quality facies,sandstones,are occupying the central (where good producing wells occur),north central,and southeastern parts.Moreover,the N-S and E-W directed cross sections show the vertical variation of Bahariya facies.Thick layers of sandstone facies spread throughout lower parts of Bahariya Formation;representing fluvial channel sandstones,marked by fining upward pattern of gamma ray log(Fig.7).Furthermore,thin layers of sandstones exist in upper parts of Bahariya Formation;indicating tidal channel sandstones,marked by finger-like shape/fluctuation of gamma ray response(Fig.7).To conclude,the facies of Bahariya formation pass from fluvial,tidal,to conditions of shallow marine.

Fig.13.(a) Estimated proportions of facies vs layers number,(b) Vertical proportions of facies curves vs layers number.
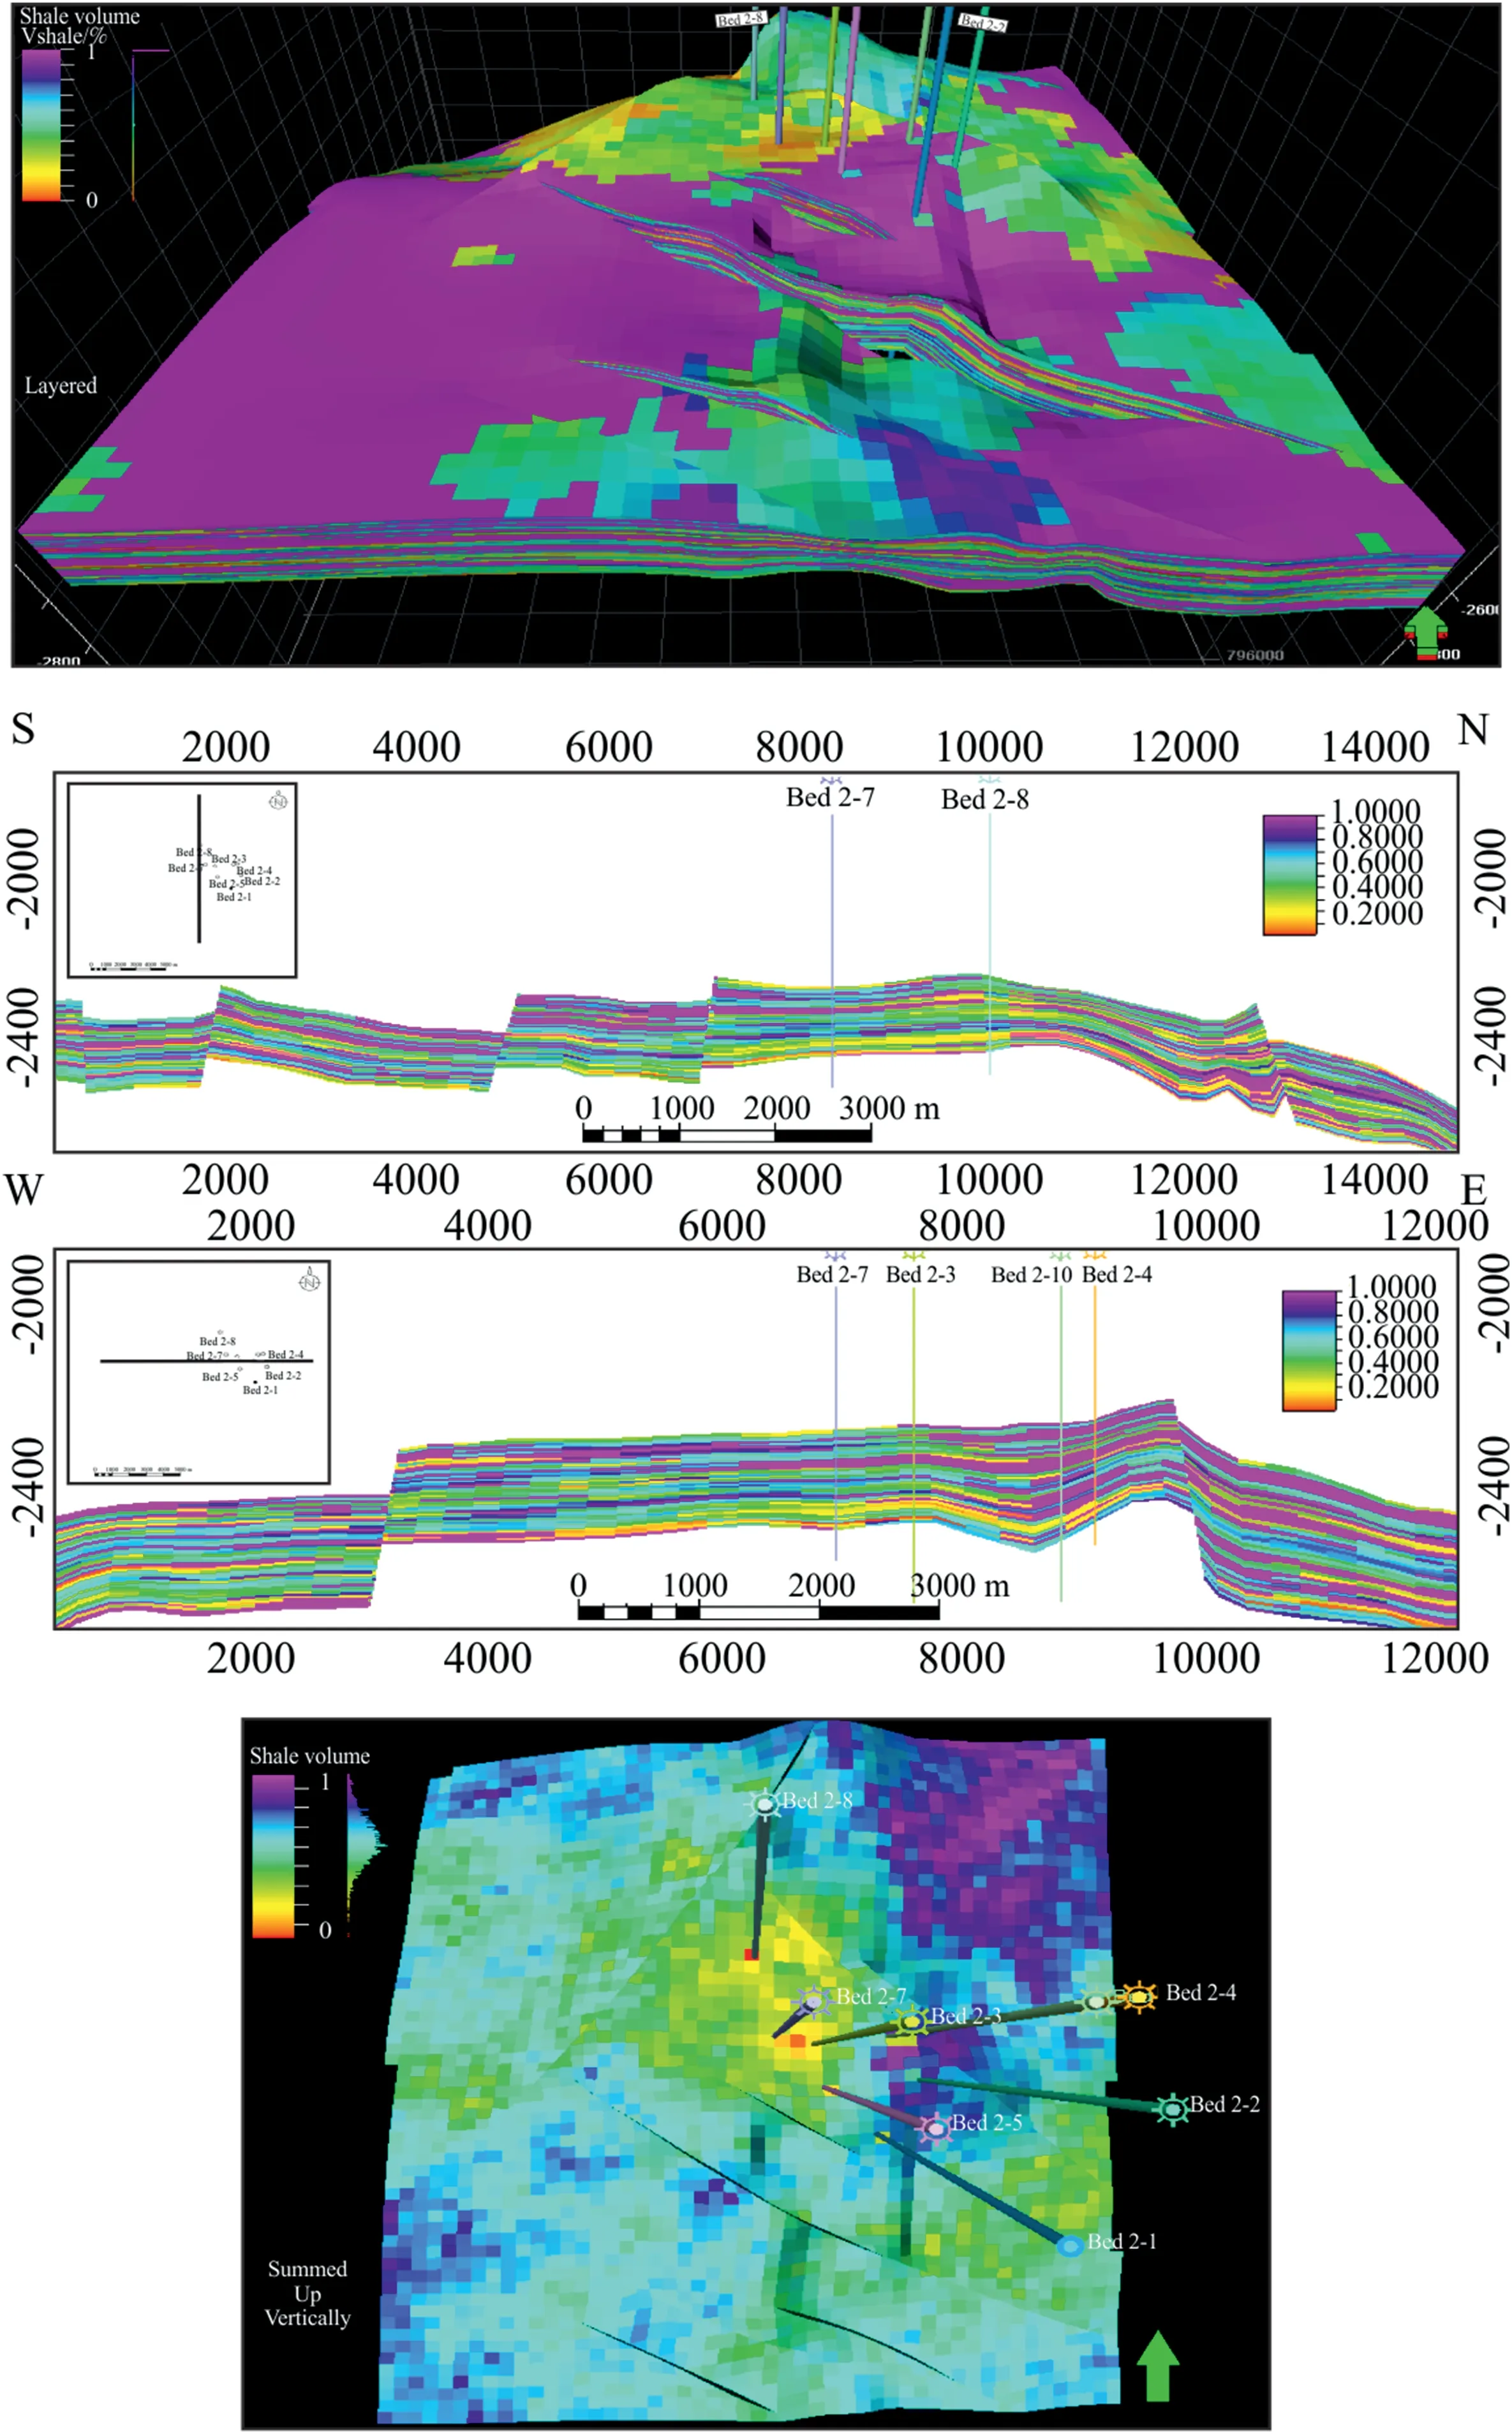
Fig.15.Shale content (Vsh) petrophysical modeling.
Faulting and basin tectonic subsidence control the domination of reservoir facies within lower parts of Bahariya Formation.Typically,paleo-structural relief during rift phases,along with depositional environments,is the principal control on distribution and thickness of facies [105].
4.4.Petrophysical modeling
Petrophysical models target incorporating the “fine-scale”rock porosities and fluid saturations into the 3D grid geocellular reservoir model [1].Petrophysical well log analysis (Fig.7) is a preceding step before the petrophysical modeling [30].It provides insights into reservoir lithology,shale content,porosity,and water saturation that act as inputs for the petrophysical modeling [106].
The petrophysical properties,acquired from petrophysical well log analysis,of Bahariya Formation are shown in Table 1.Shale content cutoff of 22%,effective porosity cutoff of 11%,and water saturation cutoff of 74% (Fig.7) were used in defining the net pay intervals.Upscaling well logs(Fig.11),constrained by facies discrete logs[1,30],into the 3D structural grid's upright resolution must also be done before petrophysical modeling [1].Variogram analysis(Fig.12) is a following step precedes applying the SGS (Sequential Gaussian Simulation) algorithm as a way of pixel-based stochastic simulation.A secondary attribute,collocated co-kriging,of shale content vs effective porosity relationship (Fig.16),and effective porosity vs water saturation relationship (Fig.18),was used while populating petrophysical properties in the 3D grid geocellular model.For shale content (Vsh) and effective porosity (PHIE) relationship,correlation coefficients of -0.69 for siltstones,-0.92 for sandstones,and-0.92 for carbonates were strictly used.Moreover,for effective porosity(PHIE)and water saturation(Sw)relationship,correlation coefficients around -0.48 for siltstone,-0.80 for sandstone,and -0.46 for carbonate facies were also used.
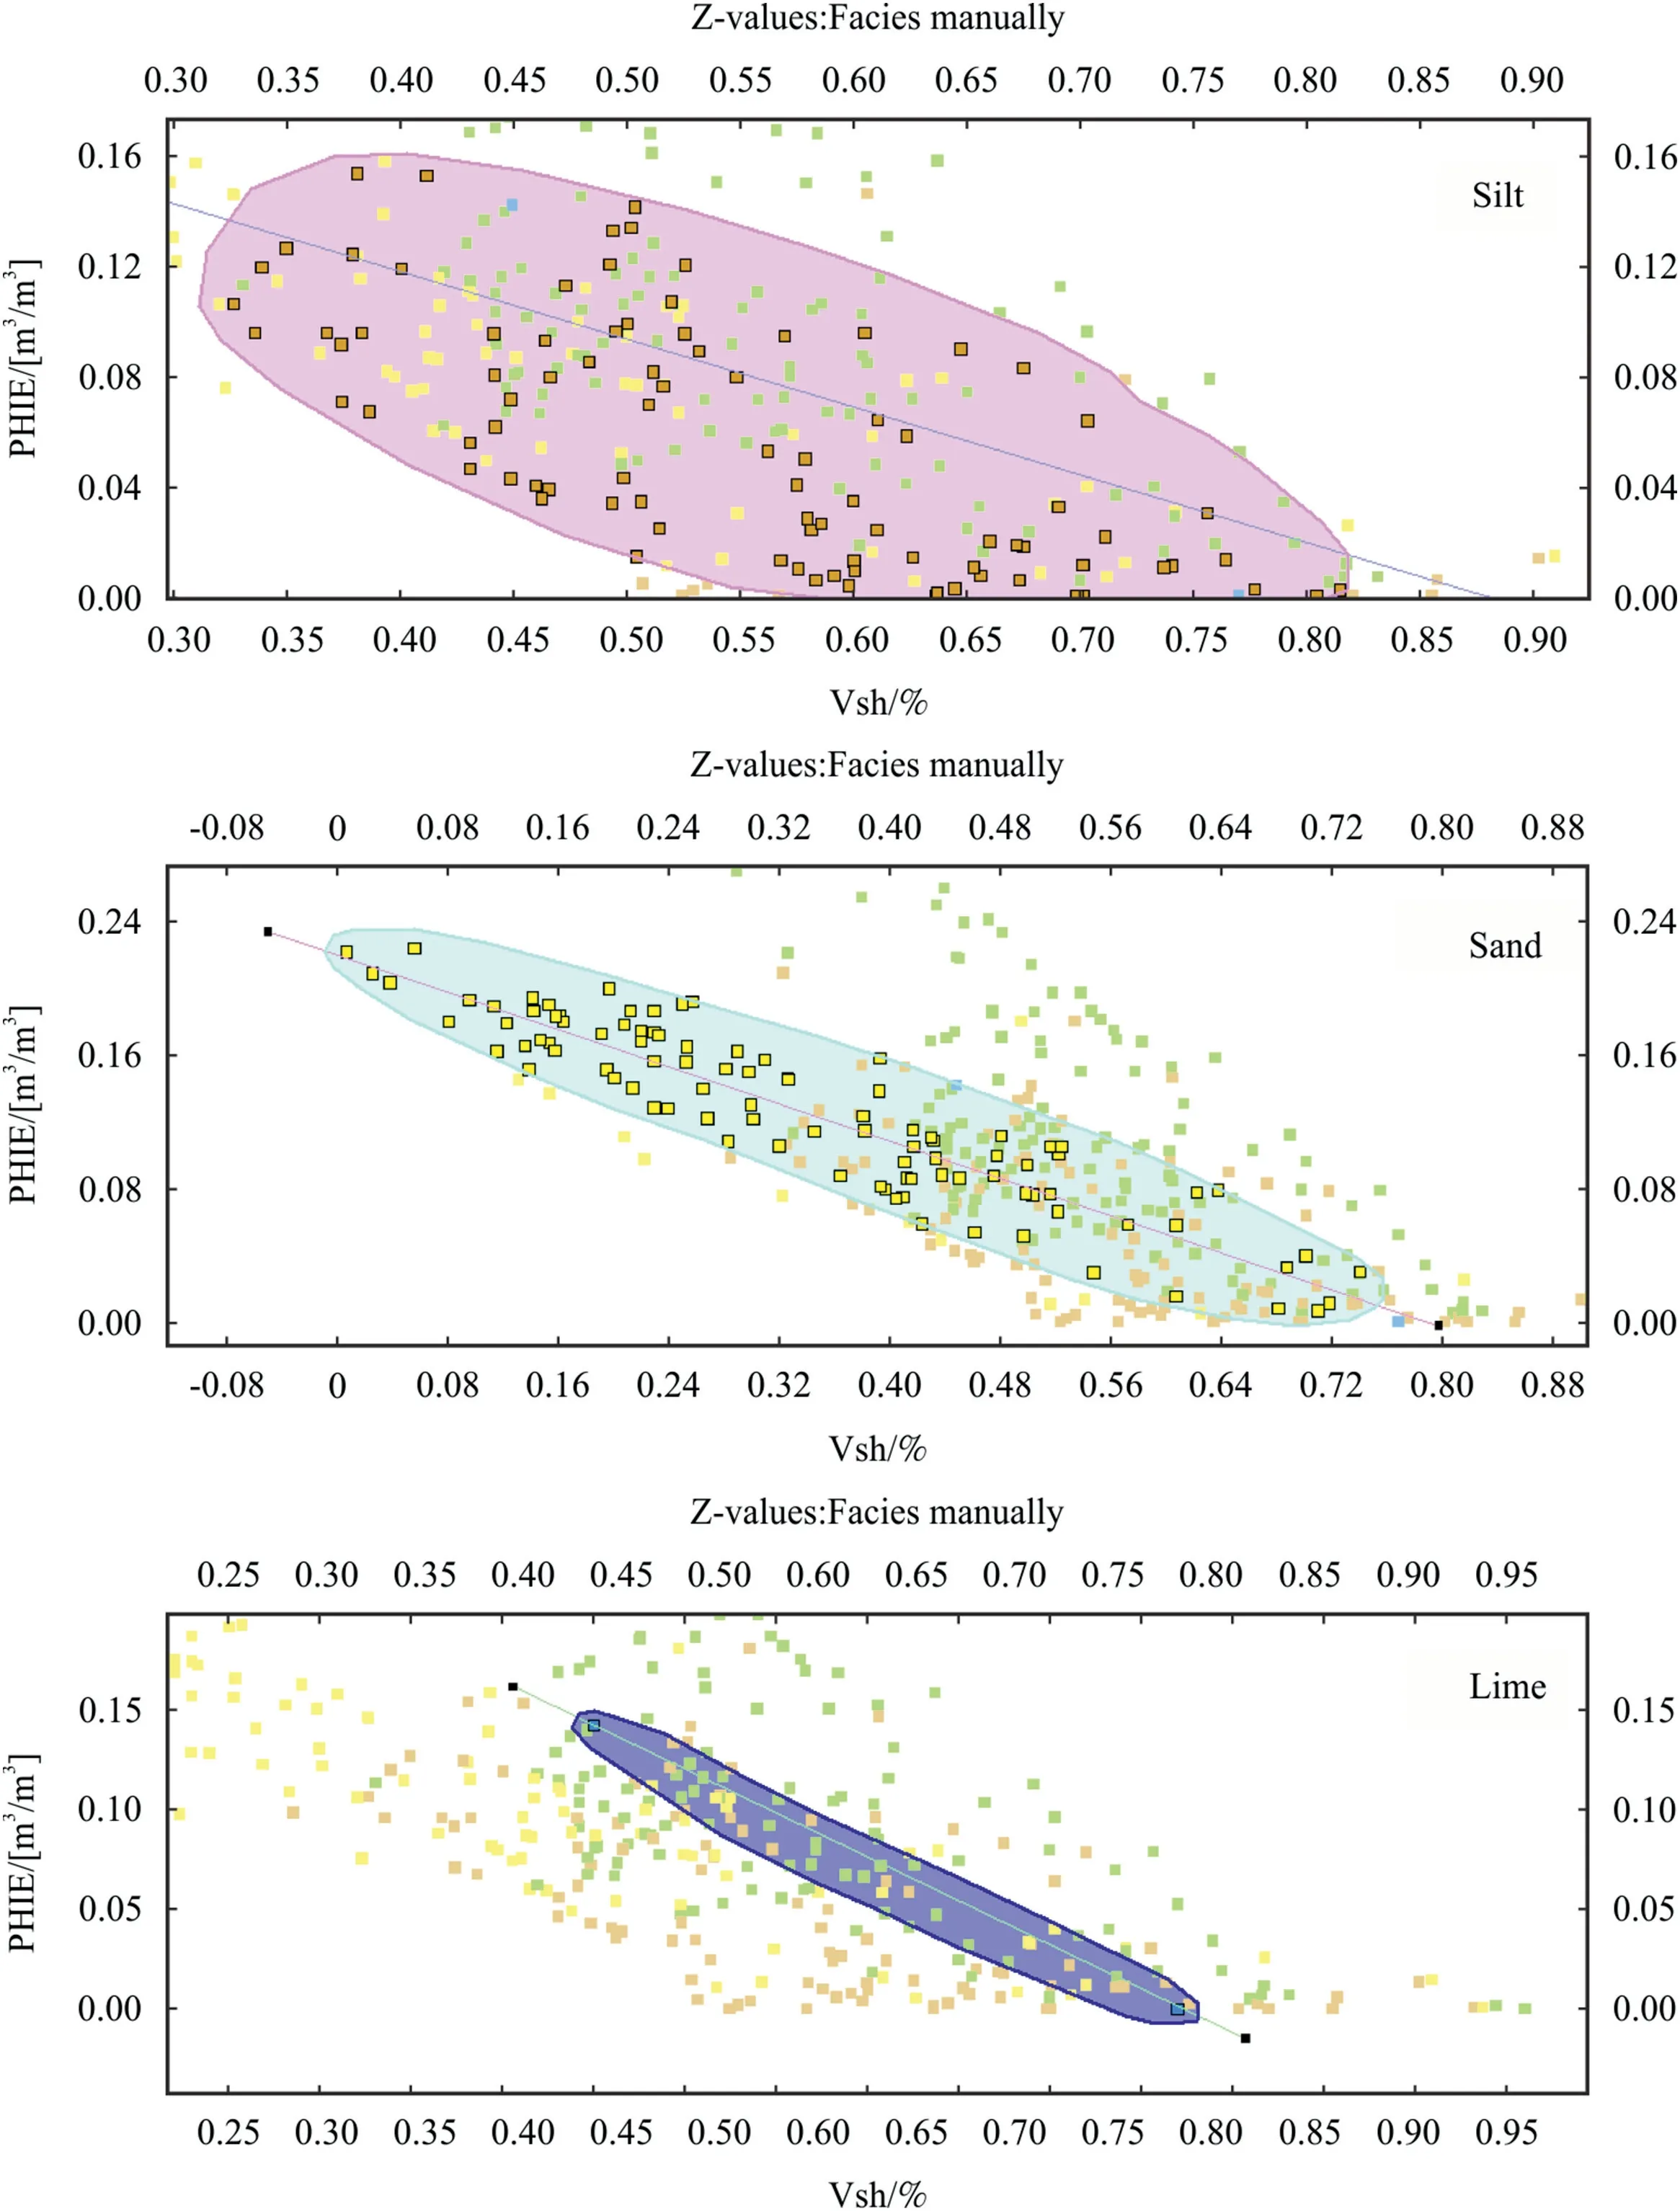
Fig.16.Shale content (Vsh) vs effective porosity (PHIE) relationship,coloured by facies.

Fig.17.Effective porosity (PHIE) petrophysical modeling.
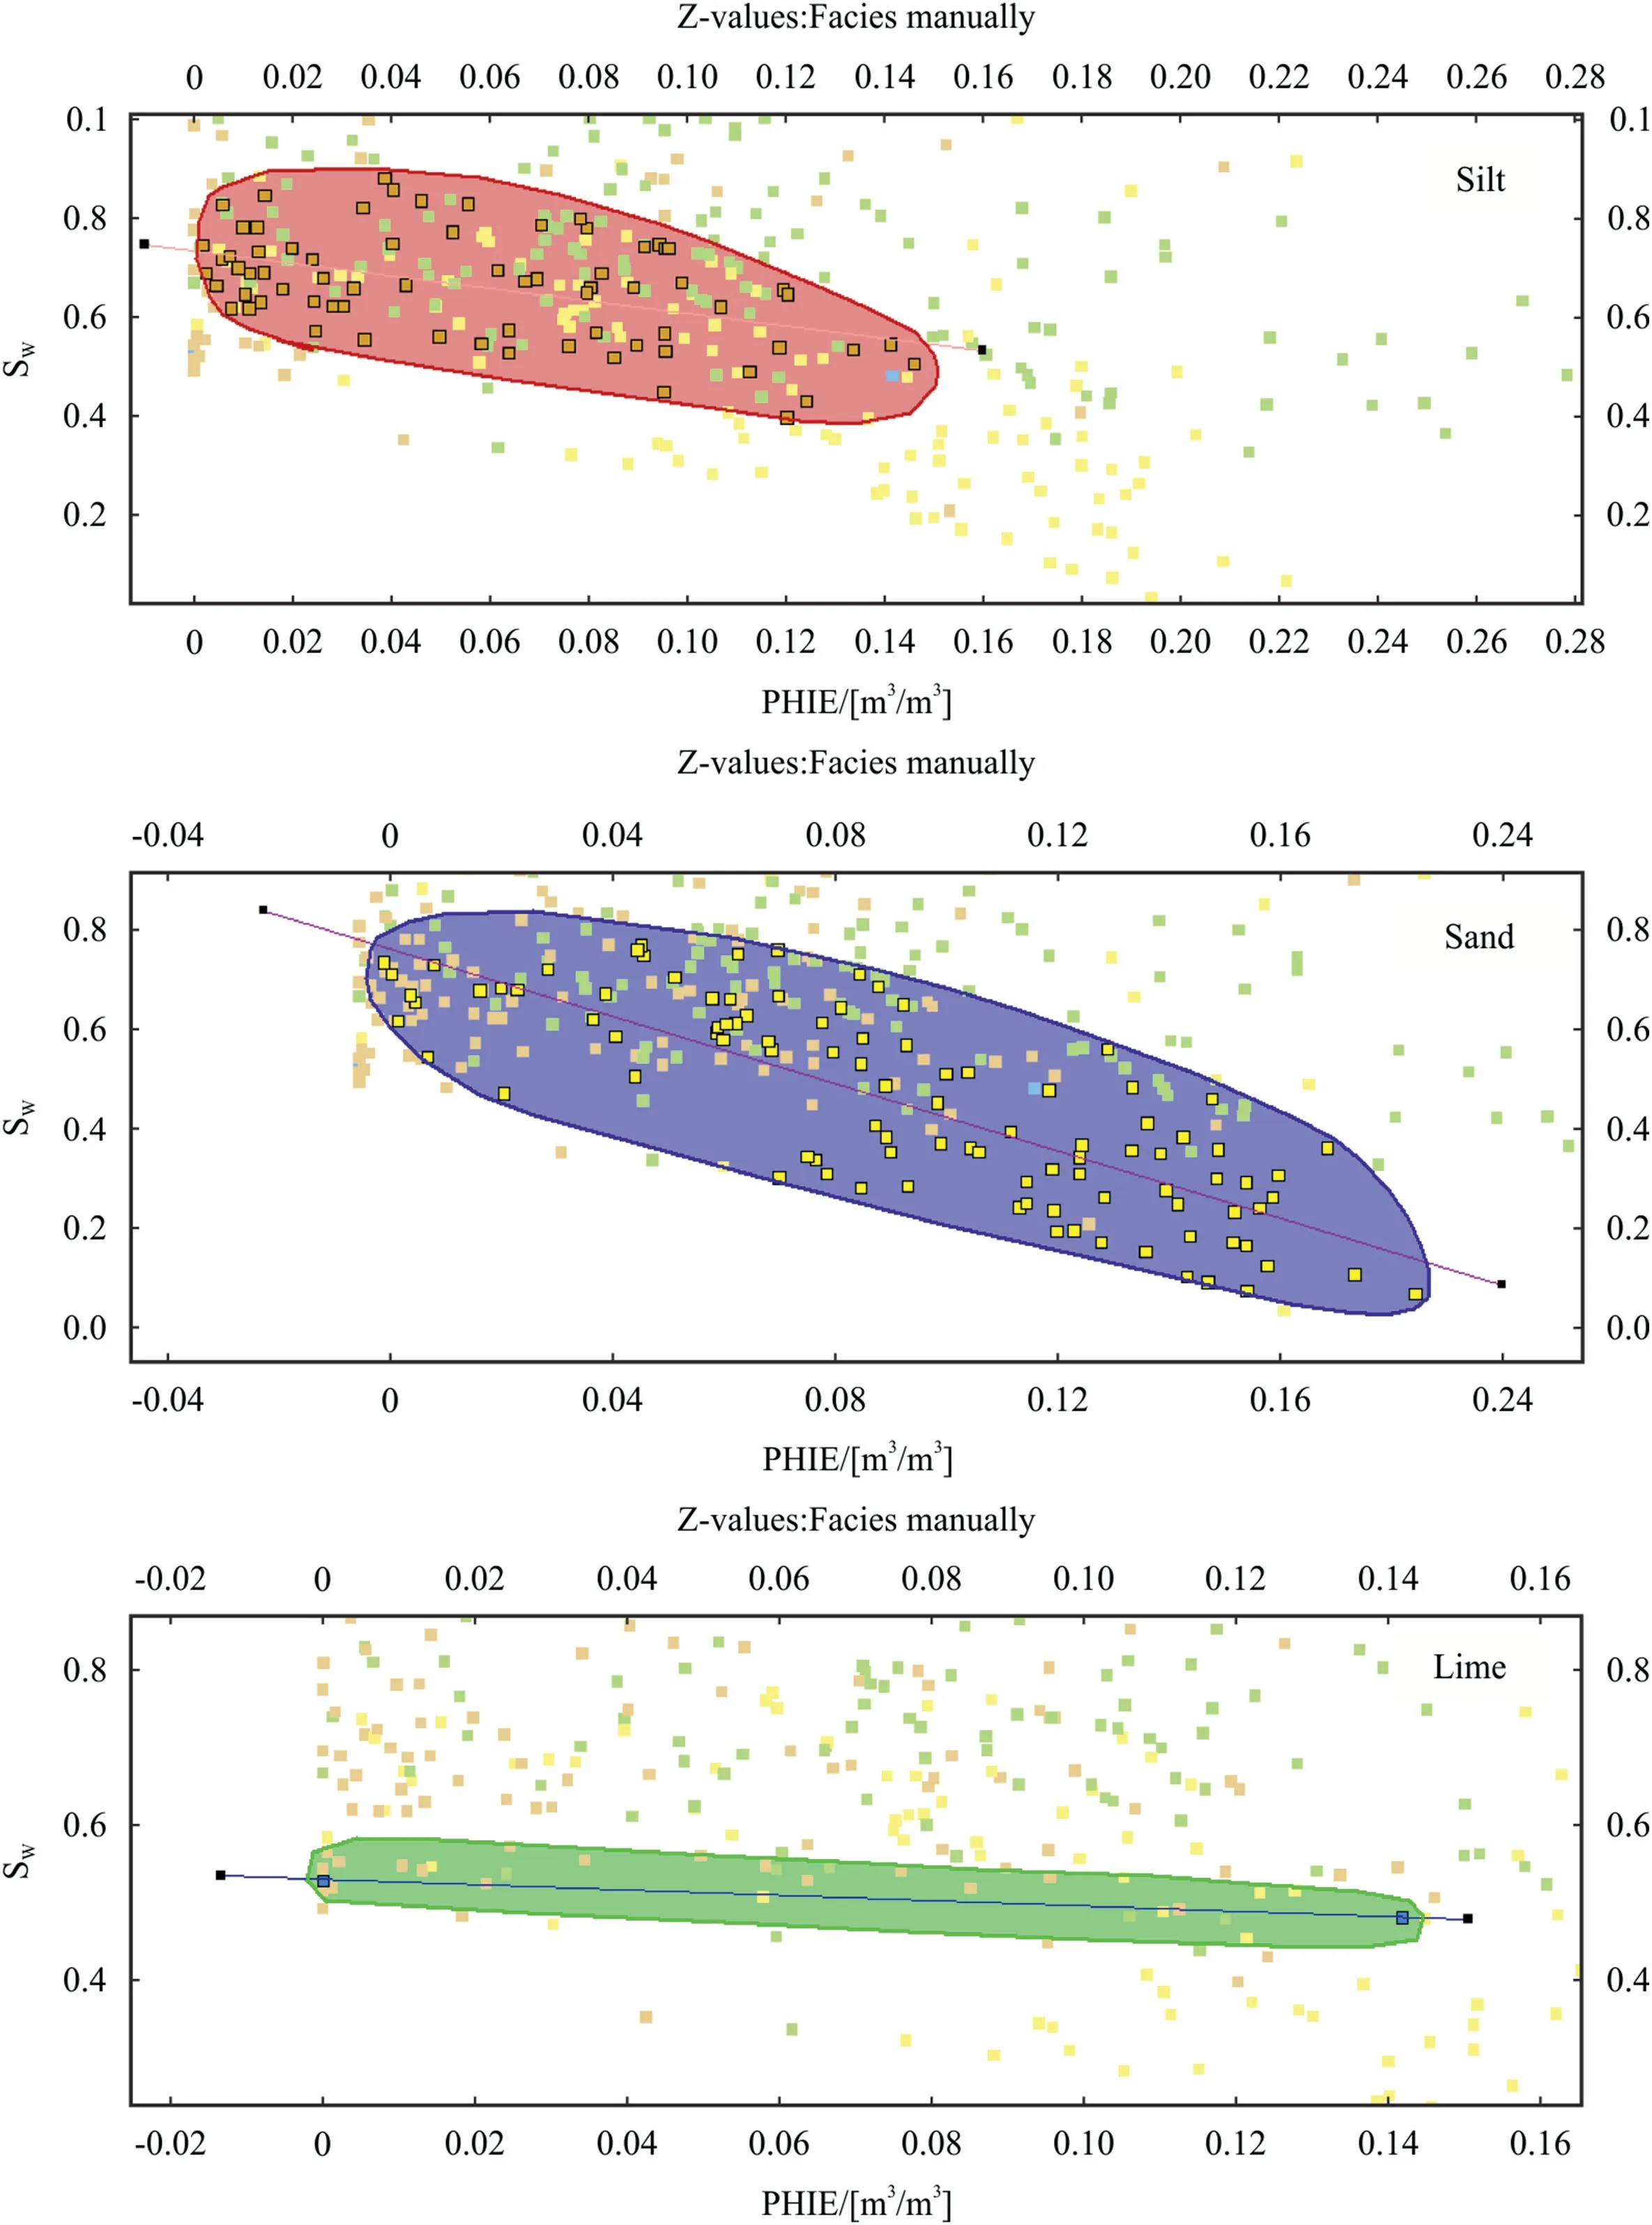
Fig.18.Effective porosity (PHIE) vs water saturation (Sw) relationship,coloured by facies.
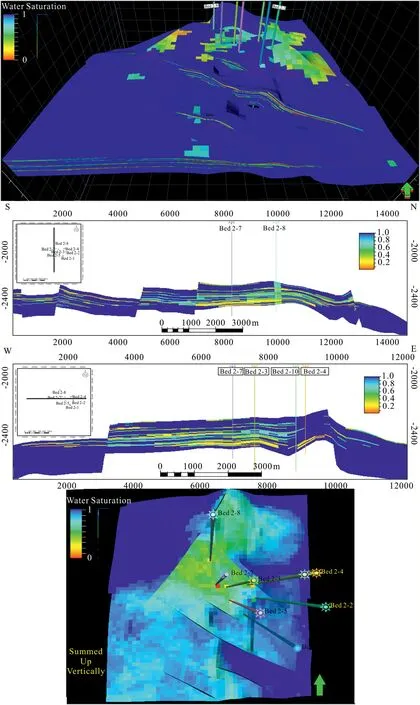
Fig.19.Water saturation (Sw) petrophysical modeling.
Figs.15,17 and 19 represent petrophysical modeling for determining shale content (Vsh),effective porosity (PHIE),and water saturation (Sw),respectively,in the study area.N-S and E-W trending cross sections also show vertical variation in the reservoir properties of Bahariya Formation.The petrophysical modeling shows matching variation in shale content (Vsh),effective porosity(PHIE),and water saturation (Sw) throughout the area of investigation.Good quality reservoir beings (efficient effective porosity,low shale content,and low water saturation)are existed in central(where good producing wells occur),and northern parts of our study area.On the other hand,low quality reservoir beings (low effective porosity,high shale content,and high water saturations)occupy the east central (where low producing wells occur),northeastern,northwestern,and southwestern parts of the studyarea.From cross-sectional view,it is clear that good quality reservoir beings occur in lower parts of Bahariya Formation,rather than the upper parts,due to the predominance of fluvial sandstone deposits in lower parts and the dissemination of non-reservoir shales in upper parts of Bahariya Formation.Generally,the petrophysical variation in reservoir properties are believed to be facies controlled[107].
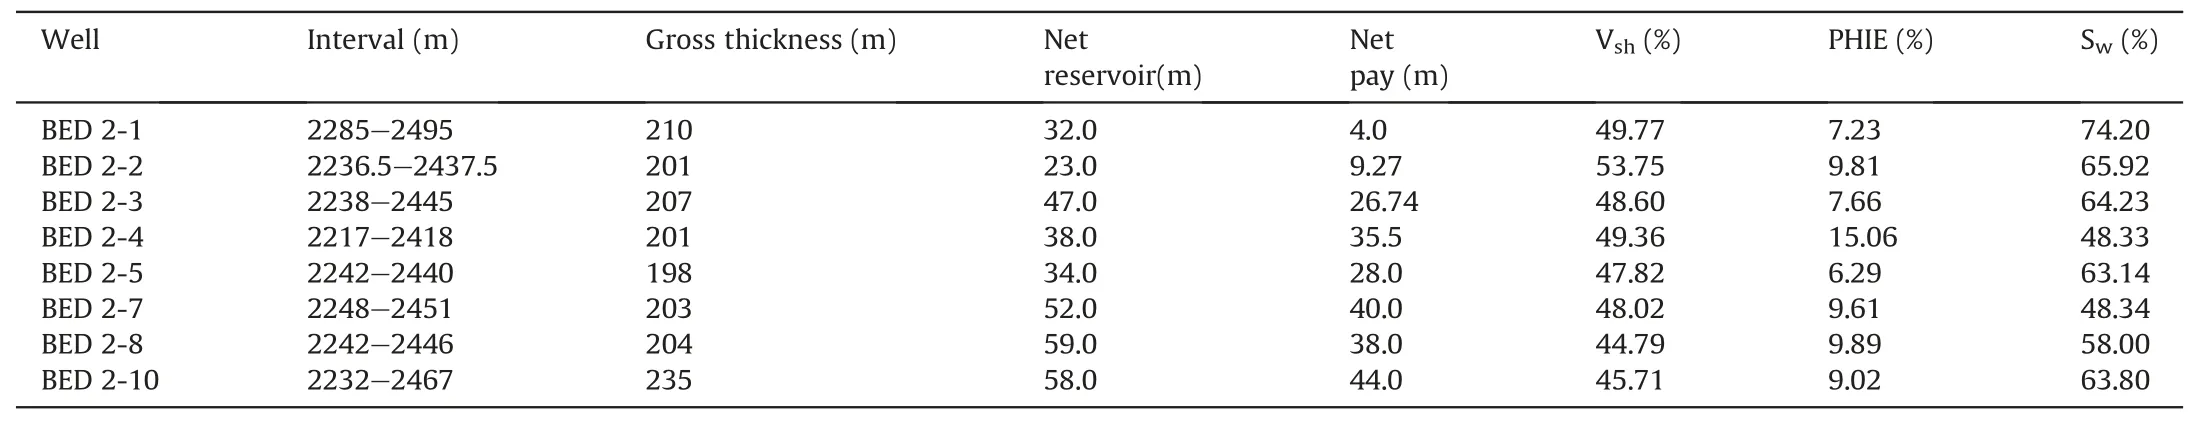
Table 1 Petrophysical properties of Bahariya Formation.
4.5.Volumetric calculations
Volumetric assessment,last step of static reservoir modeling[30,108],is performed in reservoir models to shed light on resource estimation [1].The hydrocarbon volume was calculated,in this study,applying the formula below[1]:
where: hydrocarbon initial in place is HCIIP;gross rock volume is GRV;porosity is ∅;net to gross ratio is NTG;water saturation is Sw;formation volume factor (expansion of volume occur when hydrocarbons are brought out to the surface) is FVF.
The 3D grid model,built in this study,was used in volumetric assessments of oil and gas within Bahariya Formation.In Bed-2 Field,the GIIP (gas initially in place) and STOIP (stock-tank oil initially in place)have been calculated as 42122 MCM(million cubic meters) and 362 MSTB (million stock tank barrel) respectively(Table 2).Much of the oil and gas occurrences are confirmed by boreholes drilled in the study area.
4.6.Source rock evaluation
Total organic carbon was calculated from well logs applying Passey's,ΔlogR,method [101],depending on separation of resistivity and porosity logs when being scaled,following the below equations:
where: deep resistivity isRLLD;resistivity baseline isRbase;sonic's interval transit time is Δt;sonic baseline is Δtbase;organic maturity's level(from vitrinite reflectance's cross-plots:6-7 onset for oil bearing kerogen[109]) isLm.
Applying Passey's method,thresholds of 1% and 0.4% TOC(Fig.20) were taken,in this study,for Alam El-Bueib and Kharita shales,respectively,demonstrating the organic richness of rock units in the study area.Middle Jurassic shales of Khatatba Formation(not penetrated by wells)are also believed to be of most prolific source rocks,of type-II kerogen,in the study area,as is confirmed by El Nady [16].Fig.21,TOC vs S2 crossplot,shows the kerogen types(Fig.21a),and hydrogen indexes(Fig.21b)that were used as inputs for the established basin model;and also the source rock quality.Mixed type II/III,and type III,were assigned,in this study,to the kerogens of Alam El-Bueib and Kharita formations.Moreover,the crossplots(Fig.21c)show the poor,passing through fair,to good source potential of the rock units (Alam El-Bueib and Kharita),with little excellent source potential of some intervals,in the study area.

Fig.21.TOC (total organic carbon) vs S2 (remaining hydrocarbon generative potential) crossplots.
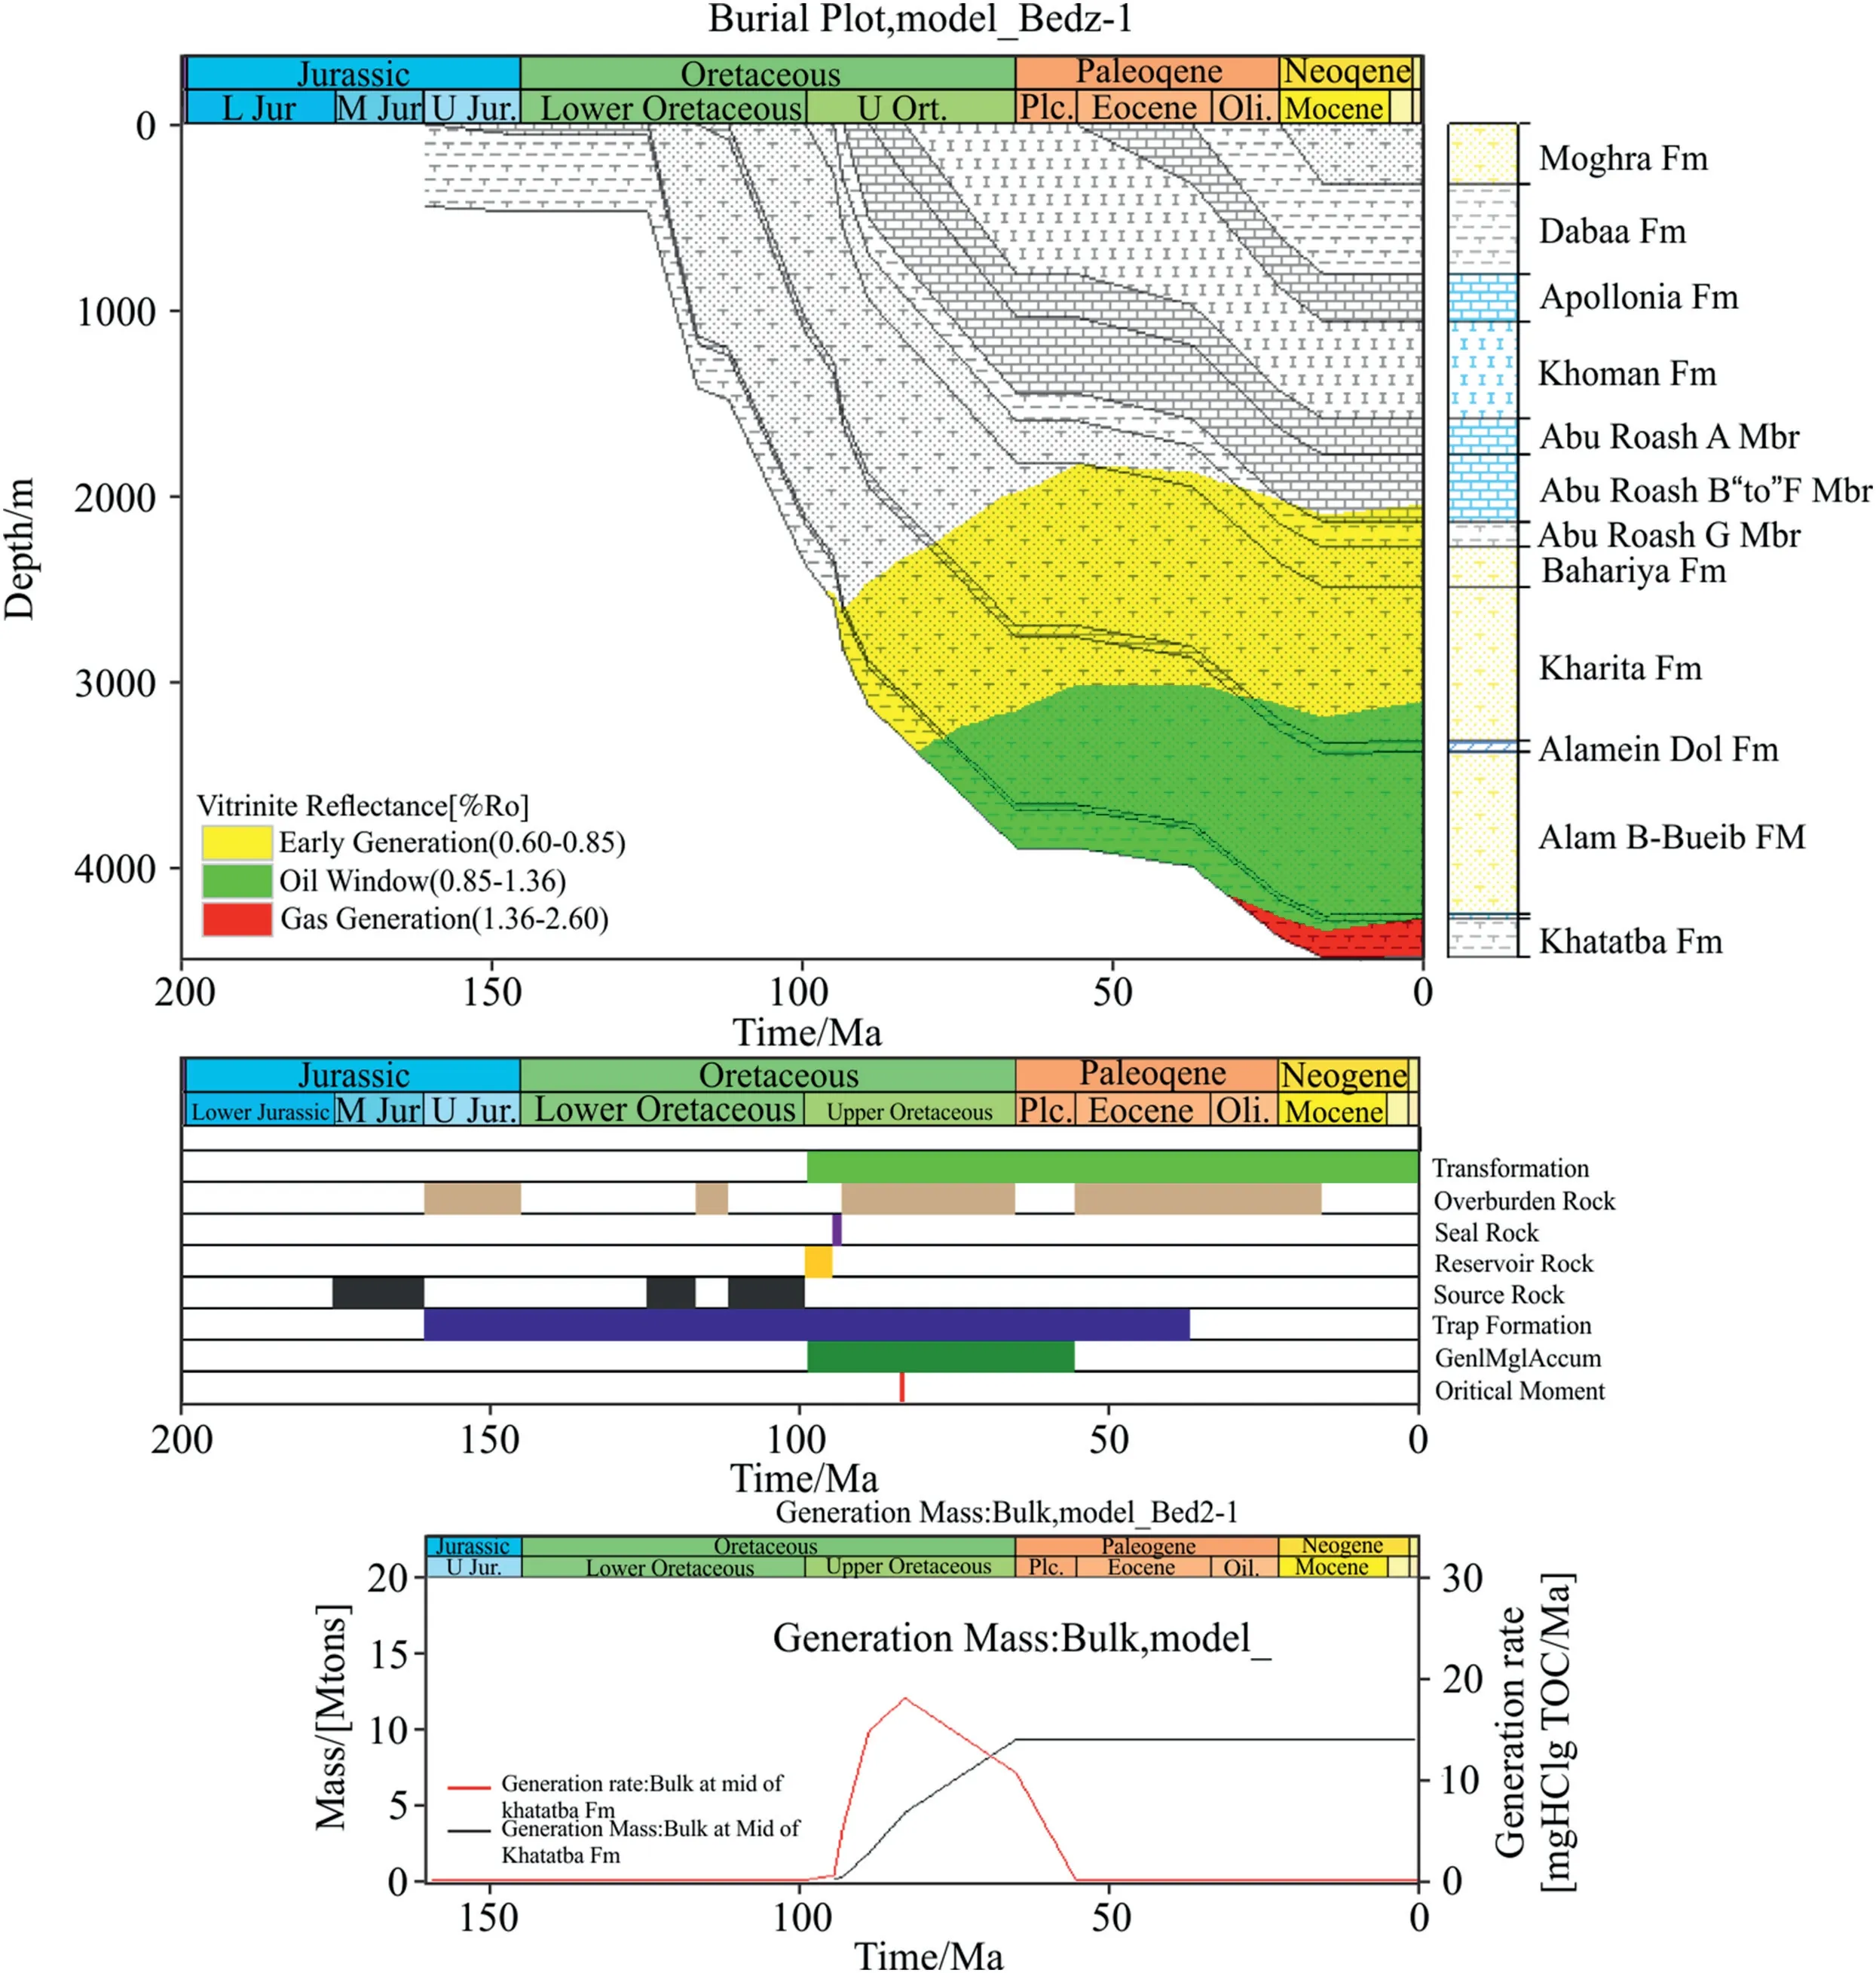
Fig.22.1D basin model,table of events,and generation rates.
4.7.1D basin modeling/geohistory models
In this study,models of burial and thermal histories,1D basin model,were simulated following Hantschel and Kauerauf [10];Littke et al.[110];Poelchau et al.[111];Yalcin et al.[112];Buker et al.[113];and Dembicki Jr [114].
The 1D basin model for assessing thermal maturations,for generating hydrocarbons,of source rocks (Alam El-Bueib and Kharita formations) has been performed,using information of depth,age,lithology,TOC,and appropriate kinetics [115],as inputs.Organic maturities of the source rocks were calculated through overlying EASY%Ro well-known model of Sweeney and Burnham[116].The 1D numerical modeling was aimed at defining the timing of hydrocarbon charge from source rocks at one selected well (Bed 2-1).
1D basin model of Bed 2-1 well (Fig.22),demonstrating the burial history,shows that the geohistory of the area(burial,thermal… etc) has been noticeably influenced by the tectonic evolution,controlled the area,in the shape of continuous subsidence.Over the Aptian(clastics of Alam El-Bueib)until the Maastrichtian(including clastics of Abu Roash),and the Upper Eocence-Ologocene (clastics of Dabaa) as well,the subsidence behavior was characterized by noticeable high burial rate,leading to the present-day considerable thickness.Average burial rate was characterizing the rest of periods.Using kinetics of Burnham [117],and also overlying the EASY%Ro model of Sweeney and Burnham [116],stages of hydrocarbon generation were calculated.
The oil window's onsets (of 0.85-1.36 VRr) for the Middle Jurassic Khatatba,Aptian Alam El-Bueib,and Albian Kharita formations were during the Campanian (82 Ma),the Campanian(76 Ma),and the Late Oligocene(27 Ma),respectively.The Middle Jurassic Khatatba Formation entered the gas generation's onset during the Early Oligocene (30 Ma).Upon comparing the generation and expulsion time with the entrapment timing,a coincidence confirming hydrocarbon charge (from source to reservoir)was found,with a critical moment at 84 Ma.Moreover,the thermal history(Fig.23)demonstrates that the temperature increases with depth of burial,and hit 379.3 F at total depth of about 4500 m.
4.8.2D basin modeling
Hydrocarbon migration,a key process in petroleum systems,has vertical and lateral routes [118-120].Faults,unless being sealed,can act as rapid pathway for hydrocarbon's vertical migration,and permeable carrier beds serve as pathways for hydrocarbon's lateral migration [118,121].Slop and uplift areas are the chief targets for the long-term migration and accumulation of hydrocarbons in rift basins [122].Modeling of hydrocarbon's migration and accumulation effectively guides the hydrocarbon exploration and production stages [10,121].If expulsion from source and migration occurred before trap development,potential accumulations of hydrocarbons would be unfortunately destroyed [98].
2D basin model(Fig.24)was constructed,in this study,to simulate hydrocarbon migration routes and sites of accumulation.The model was performed using structural cross sections,relying on topographical variations of sealing surfaces[123],interpreted from seismic data.It is clear that migration from source rocks has occurred vertically,upwards,towards the overlying carrier beds and laterally to the northward direction(Fig.24).Significant hydrocarbon accumulations have been developed in structural highs of Bahariya Formation;particularly within the 4-way dip closure setting,domal structure,northward;around the bounding faults.Generally,modeling results are reasonably in agreement with the proven hydrocarbon occurrences confirmed by the drilled wells in the study area.
4.9.Pre-drill hydrocarbon prospect identification
Upon achieving the results of the combined reservoir modeling and petroleum system analysis,performed in this research,we believe that the north central part of Bed-2 Field(circled in Fig.25)is suggested to be drilled,as a new prospect that feature favorable conditions for petroleum accumulations,for the following criteria:
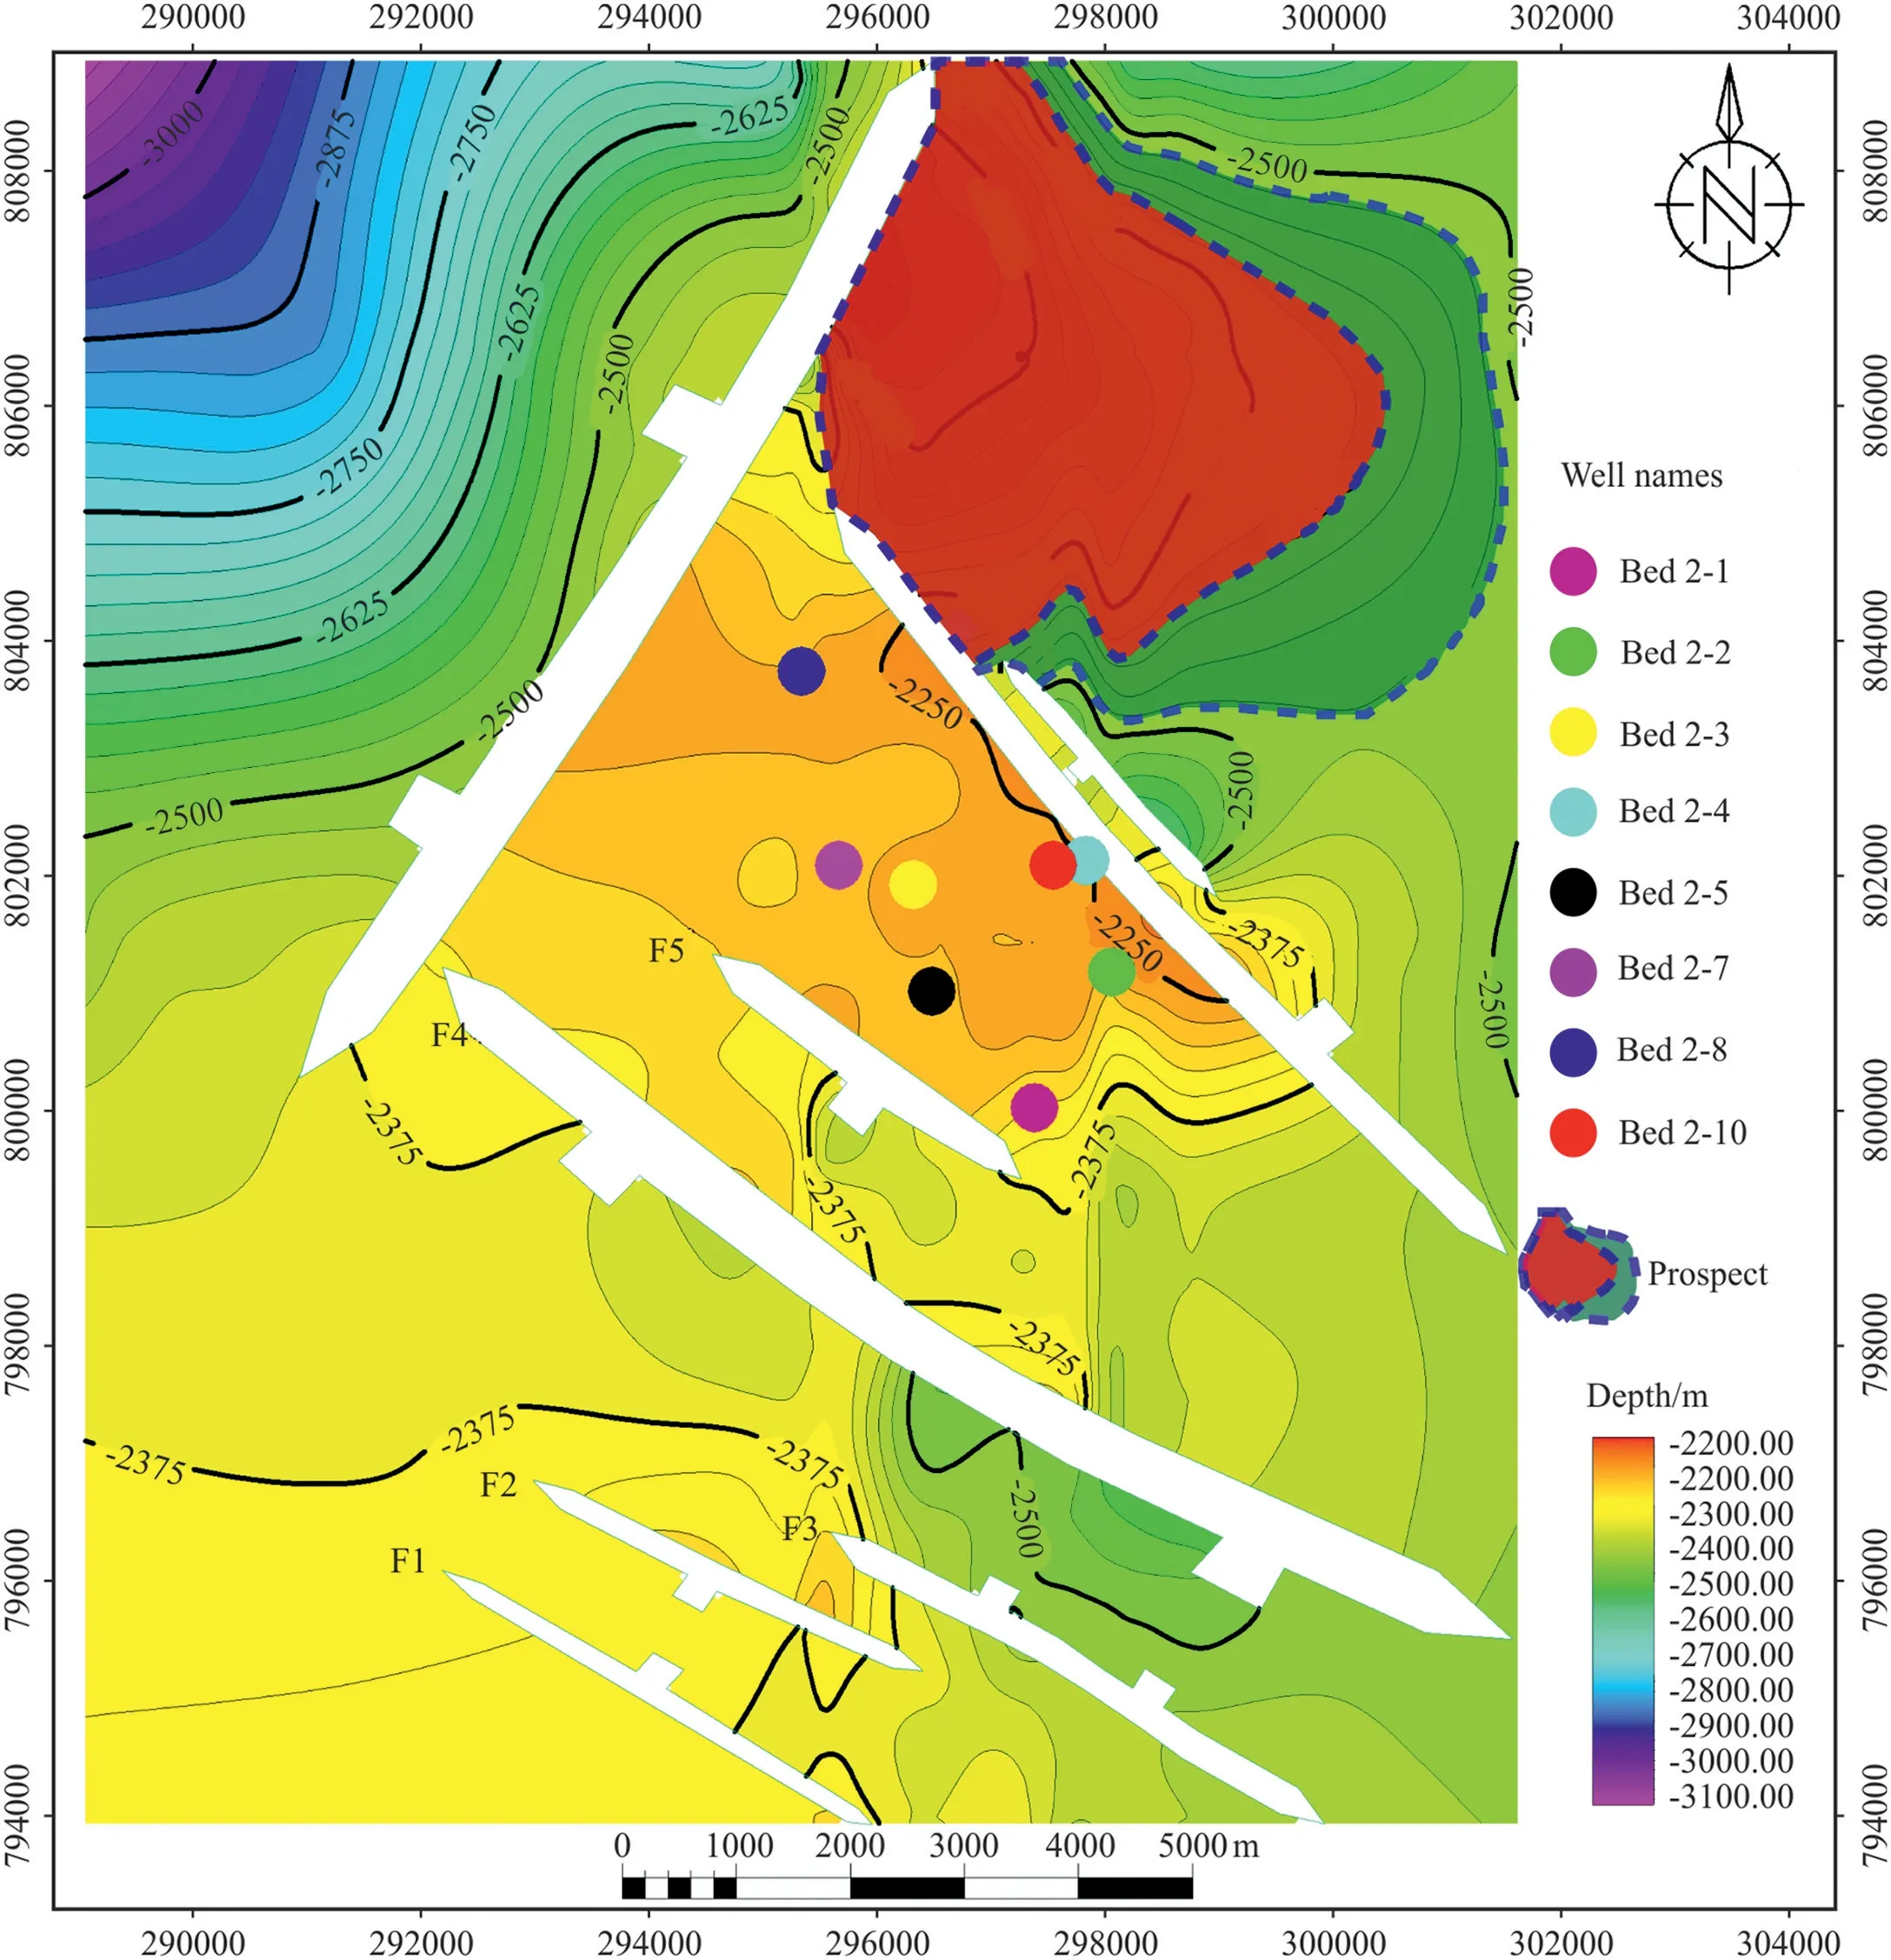
Fig.25.Bahariya Formation's structure map with proposed prospects (F: stands for fault;GOC: Gas oil contact;OWC: Oil water conatact).
(1) Being occurred on a structural high,of 4-way dip closure,around a sealing fault (Fig.25).
(2) Featuring good quality reservoir(efficient effective porosity,low shale content,and low water saturation)beings(Fig.26).
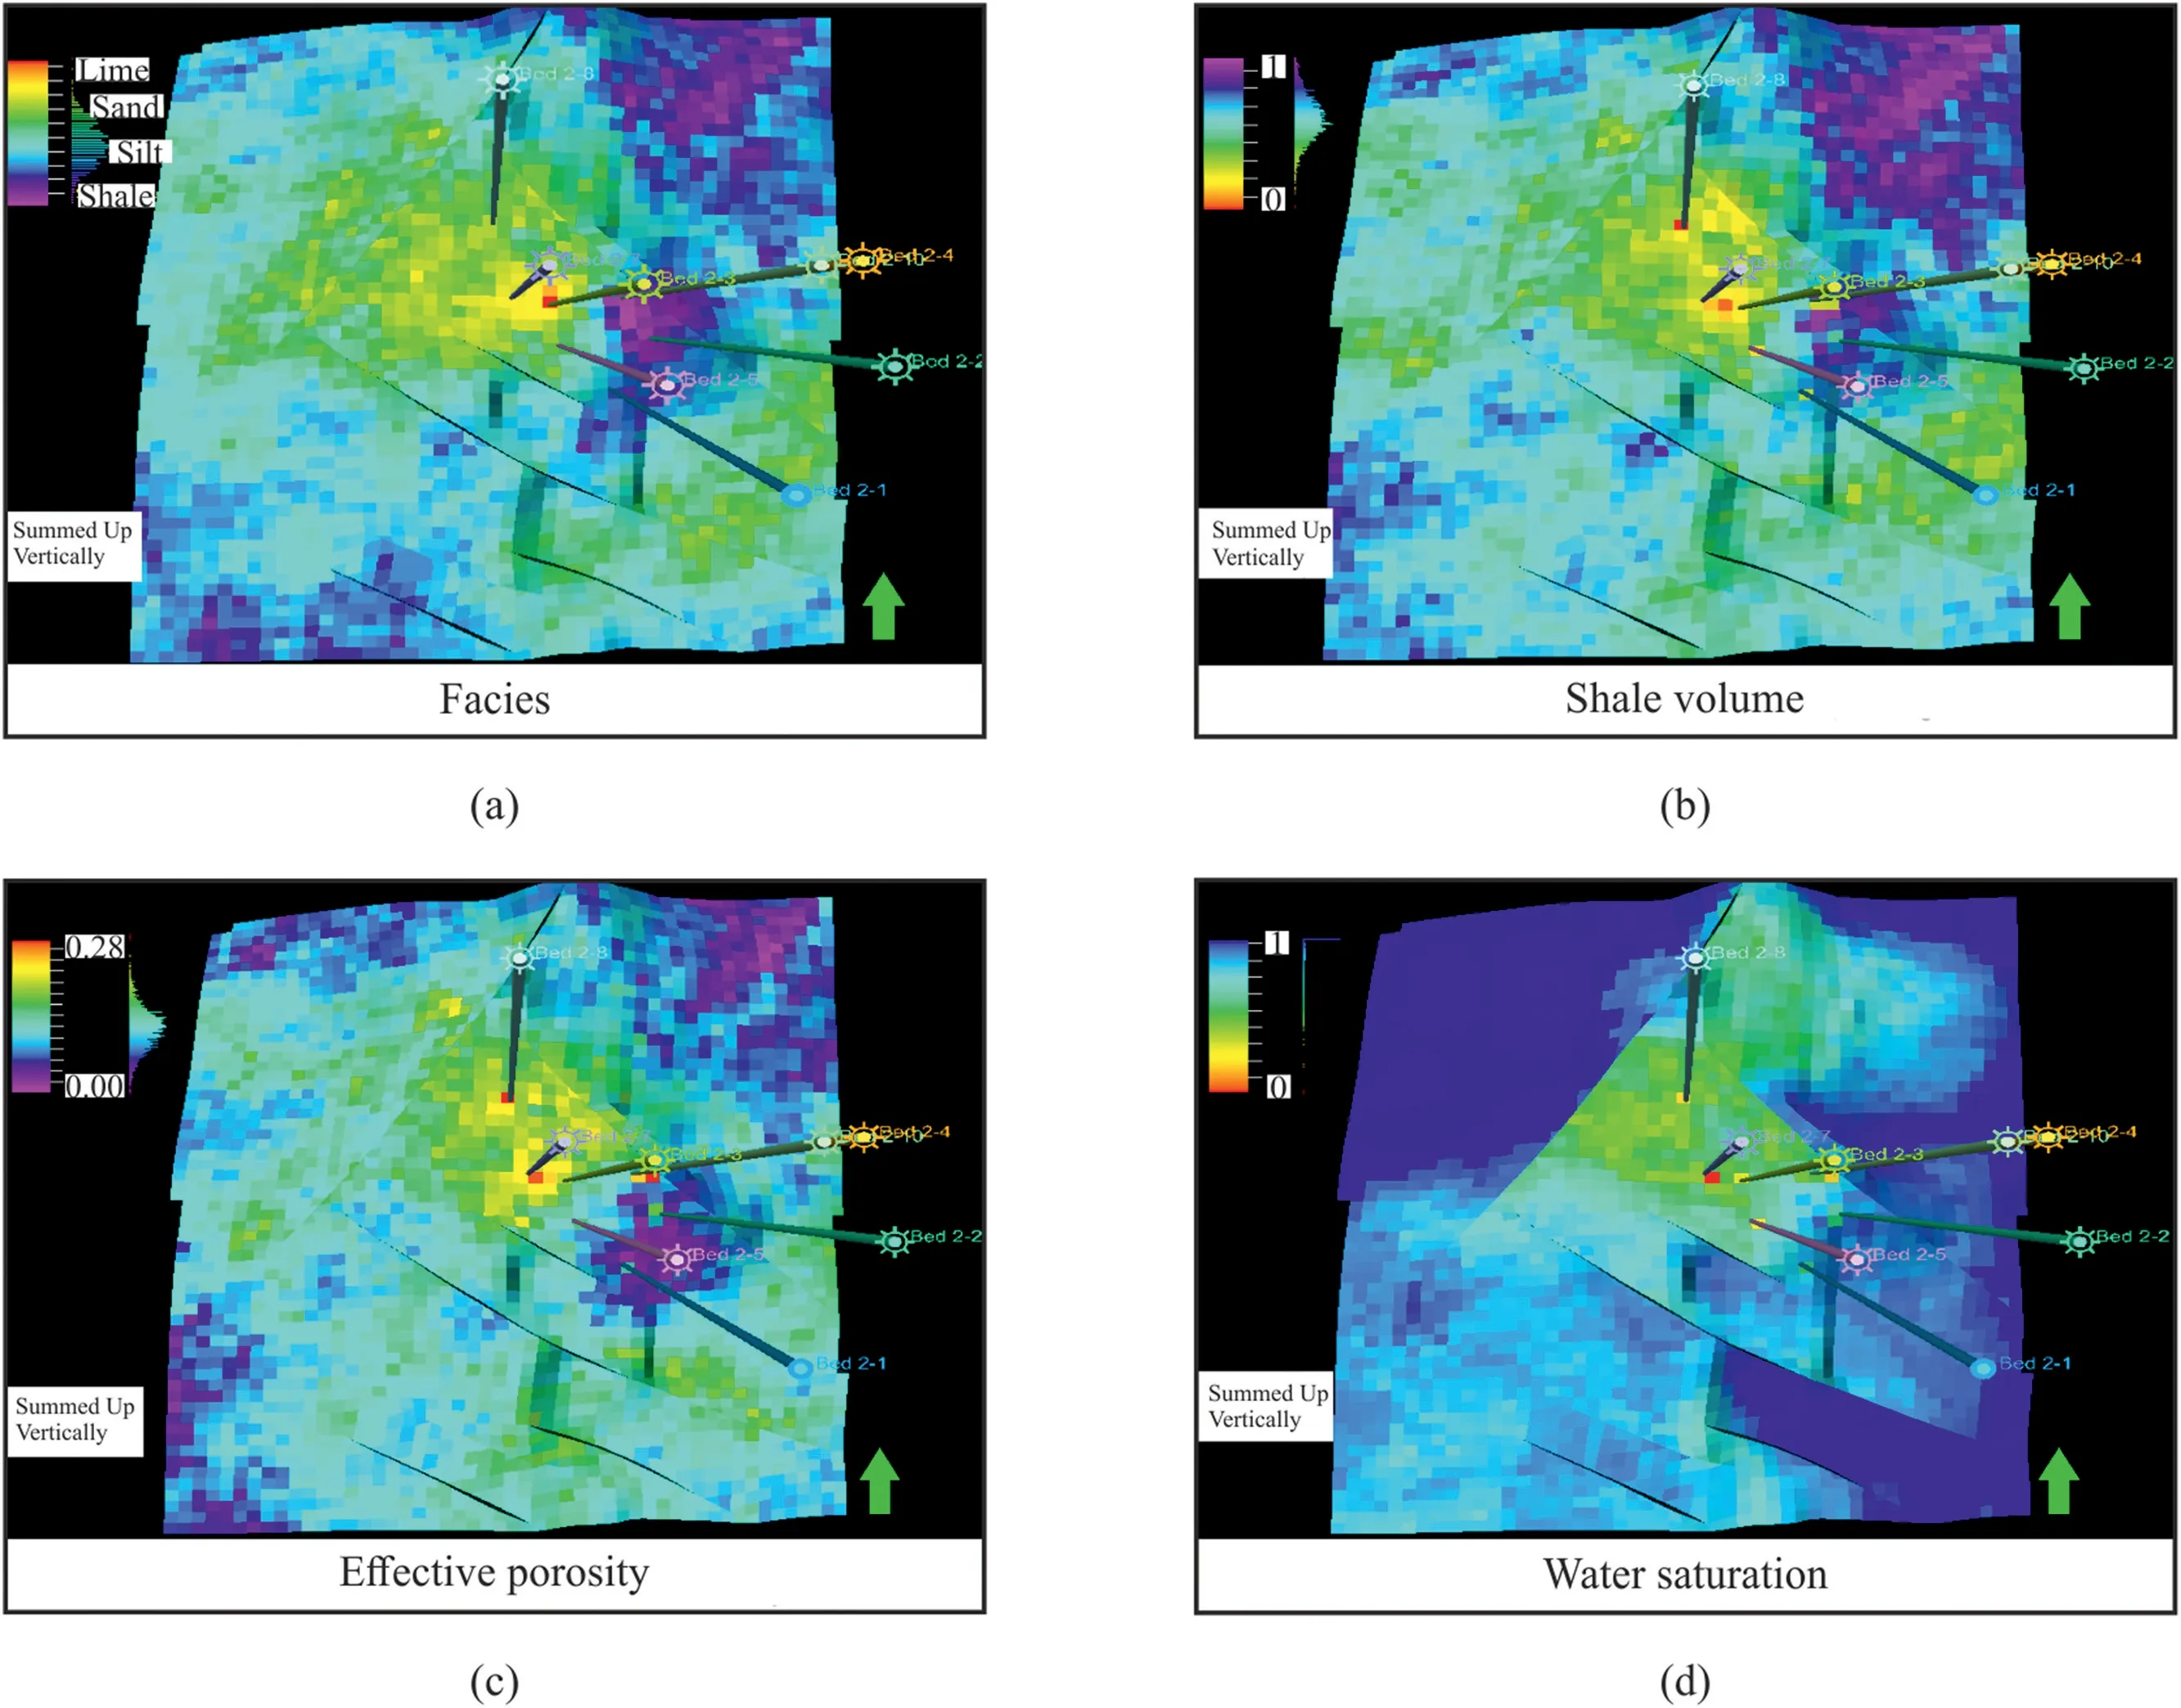
Fig.26.Combined petrophysical models of Bahariya reservoir.
(3) Having considerable thickness when being compared with the rest of areas (Fig.6).

Table 2 Volumetric assessment of Bahariya Formation.
5.Conclusions
Upon combining both reservoir and basin models,performed in this study,robust assessment of petroleum system's elements and processes has been sufficiently gained,revealing the ultimate petroleum potential of our study area.Fortunately,a coincidence between generation and entrapment timing,confirming the hydrocarbon charge,has been clearly noticed.Moreover,the reservoir heterogeneity has been adequately delineated,after performing the property modeling,to mark the reservoir boundaries.It is obvious that the petroleum system analysis work flow,performed in this study,has corroborated the static reservoir modeling performed for the Cenomanian fluvio-marine Bahariya Formation,confirming the petroleum potential of the area.
The developed static reservoir model,delineating the reservoir geometry and property,is expected to lead the further oilfield development plans of the study area.The developed basin model,defining the hydrocarbon charge timing,can be of use for further investigations,as baseline,in the Western Desert play.Combination of such models led to precisely identify new hydrocarbon prospects,featuring favorable conditions for hydrocarbon accumulations.To test new development wells,upon running further plans of development,it is recommended to take the north central part,of Bed-2 Field,in consideration.
Declaration of competing interests
The authors declare that they have no known competing financial interests or personal relationships that could have appeared to influence the work reported in this paper.
Acknowledgements
The authors appreciatively express their thanks to EGPC(Egyptian General Petroleum Corporation),and Bapetco(Badr El Din Petroleum Company),for providing the needed data,and giving the permission for publishing this work.The authors also thank Geology Department,Al-Azhar University,for giving access to labs equipped with the facilities and software.Many thanks would also go to the journal's editor and reviewers for helping refine the manuscript.
杂志排行

Petroleum的其它文章
- Super gas wet and gas wet rock surface: State of the art evaluation through contact angle analysis
- Development and performance evaluation of a high temperature resistant,internal rigid,and external flexible plugging agent for waterbased drilling fluids
- Anti-drilling ability of Ziliujing conglomerate formation in Western Sichuan Basin of China
- Production optimization under waterflooding with long short-term memory and metaheuristic algorithm
- Investigation of replacing tracer flooding analysis by capacitance resistance model to estimate interwell connectivity
- Experimental study on sand production and coupling response of silty hydrate reservoir with different contents of fine clay during depressurization