Thermoluminescent response of gamma irradiated Na+–Cu+ ion‐exchanged silicate glass in large dose range
2023-07-11SafaToumiKhaledFarah
Safa Toumi ·Khaled Farah
Abstract The introduction of metals into vitreous matrices is the origin of various interesting phenomena; in particular, the presence of copper ions in glass has been the subject of considerable research because of its numerous applications.The ion-exchange process is primarily used to introduce copper ions into glass matrices.The thermoluminescence (TL) of silicate glass was studied to evaluate its potential as gamma-sensitive material for dosimetric applications; the effect of copper doping on the thermoluminescent sensitivity was investigated using the Cu–Na ion-exchange technique for different concentrations and doping conditions, over a wide dose range of 10 mGy to 100 kGy.The results showed that Cu doping significantly improved the sensitivity of the glasses to gamma radiation.After the ion-exchange, two peaks appeared in the glow curves at approximately 175 and 230 °C, respectively, which possibly originated from the Cu+ centers, along with a weak TL peak at around 320 °C.We also attempted to explain the origin of the observed thermoluminescence by exploiting the Electron paramagnetic resonance (EPR) spectra.The results clearly show quenching of the TL emission with increasing copper concentrations.The present work indicates that the thermoluminescence response of these glasses to gamma rays can be reasonably measured in the range of 0.001–100 kGy.This study also facilitates the understanding of the basic TL mechanism in this glass system.
Keywords Cu-Na ion-exchange ·Silicate glass ·Thermoluminescence ·Gamma irradiation ·Electron paramagnetic resonance
1 Introduction
The accurate measurement of the absorbed dose is critical in most applications related to nuclear and radiation technologies, medicine, radiation protection, and industry; these applications use dosimeters with specific features to measure the dose absorbed by the matter.
Several commercially available dosimetric systems have been successfully used.The most common systems are the EPR dosimetric systems (alanine-based) and thermoluminescence dosimeters (Al2O3and LiF-based TLD detectors).Thermoluminescence dosimeters (TLD) are widely used in several applications, involving the detection and measurement of clinical, personal, and environmental ionizing radiations [1–3].
These systems are based on the TL phenomenon.However, the application of LiF-based TLD dosimetry systems is limited to low radiation doses.Therefore, researchers have extensively investigated new types of detectors with adequate dosimetric properties as promising candidates for high-dose measurements.Glasses doped with small concentrations of transition metal ions as activators are considered advantageous materials in TLD for radiation dosimetry application [4–7] owing to their simple glow curve, sensitivity, and dose linearity over a wide range of doses, which are the most significant properties possessed by an effective dosimeter.
Among the various activators of transition metal ions, copper is a good TL emission activator in amorphous materials,such as silica glasses [4, 8, 9].Therefore, the shape of the TL glow curves, quantum of the TL output, and thermal stability of the Cu-doped glasses are expected to strongly depend on the change in the valence state of copper.The expected copper ions exist in Cu-doped silicate glasses primarily as metallic Cu, cuprous Cu+, or cupric Cu2+ions [10, 11].
Several studies have been conducted on Cu-doped silica glass for dosimetry applications.However, many of these studies focused on UV–Visible [12–14], photoluminescence [12–16], optically stimulated luminescence [15, 16],and radiophotoluminescence [15–17].However, investigations on the thermoluminescence phenomena of Cu in silica glasses obtained by melt-quenching are limited [4, 8, 9].
To the best of our knowledge, no studies have investigated the TL properties of Cu-ion-exchanged glasses.The ion-exchange technique has already been considered as an effective method for incorporating copper ions into glass surfaces.This procedure is easy to perform and does not require any complicated equipment [18, 19].In addition,most Cu-doped glass dosimeters fabricated using meltquenching methods only allow the development of TLD dosimeters in the low-dose range for clinical applications and are not designed for use above 400 Gy.The use of the ion-exchange technique to introduce copper ions into the glass makes it possible to extend the dose range to higher and lower doses.
The present work aims to study the thermoluminescence response of irradiated silicate glass samples to gamma radiation.The primary goal is to investigate the effect of the copper ion-exchange technique on the thermoluminescent sensitivity at different concentrations and doping conditions.Therefore, there is a considerable appreciation for the possibility of using radiation dosimeter with a wide dose range of 0.001–100 kGy.We discuss the results obtained to explain the origin of the thermoluminescence observed by exploiting the EPR spectra of the doped and undoped samples.
This study does not aim to consider all the dosimetric properties of TL gamma-irradiated copper-ion-exchanged silicate glass.Furthermore, studying the fading behavior for short- and long-term periods is necessary to determine their applicability as effective radiation dosimeters.The dimensions and masses of the glass samples were evenly optimized.
2 Materials and methods
2.1 Glass composition
The glass samples used in this experiment were commercially obtained from glass sheets purchased from a local market that were cut into pieces of equivalent size and weight.The chemical composition of the glass samples was determined by the prompt gamma activation analysis technique (PGAA) [20], (constituents in wt%: 68.52 SiO2, 13.77 Na2O, 8.19 CaO, 4.34 MgO, 1.003 Al2O3, 0.588 K2O, and approximately 0.5% of other components).
2.2 Procedure of ion‑exchange
The glass samples were dipped in a molten salt bath consisting of a mixture of 10 g of CuSO4and Na2SO4in an Al2O3crucible.The molar fraction of Cu was between 1 and 60%.The ion-exchange was performed at temperatures of 850 and 950 °C for periods varying from 30 to 90 min.During this step, the copper ions in the salt bath diffused inside the glass matrix, and Cu+-Na+ion-exchange occurred.The ion-exchanged samples were removed from the roomtemperature bath, cleaned with distilled water and acetone to remove the residue adhering to their surface, and air-dried.
2.3 Gamma irradiation
The glass samples were irradiated at the Tunisian pilot plant60Co gamma irradiation in two reference positions for the gamma installation [21].For reference position 1, the samples were irradiated with doses ranging from 1 to 100 kGy at a dose rate of 109.5 Gy/min.For reference position 2,the samples were irradiated with doses ranging from 1 to 150 Gy at a dose rate of 2.7 mGy/s (approximately 0.162 Gy/min).Dosimetry was performed using the Fricke chemical dosimeter [22], and the traceability of the dose was established using an alanine/EPR dosimetry system in terms of the absorbed dose to water traceable to the Aerial Secondary Standard Dosimetry Laboratory (SSDL), Strasbourg, France.
2.4 Thermoluminescence measurements
The TL glow curves of the irradiated glass were recorded using the Harshaw TL 4500 manual reader supported by the WinREMS software.All samples were read at a heating rate of 2 °C/s.The maximum temperature was set at 400 °C.All TL responses were recorded in nano-ampère (nA), and the readings were taken under a flow of nitrogen gas.
3 Results and discussion
3.1 Effect of gamma irradiation for the non‑exchanged glasses
Figure 1 shows the TL glow curves for the non-exchanged glass samples irradiated with gamma rays with doses ranging from 0.1 to 100 kGy (recorded in the temperature range of 50–400 °C).Notably, no TL response was detected in non-irradiated samples or those irradiated at doses below 100 Gy.The glow curve of the irradiated non-exchanged glass is simple, with a single peak around the 250 °C mark,compared with the standard TLD 100 dosimeter, which has a very complex glow curve consisting of many overlapping glow peaks [23, 24].
As shown in Fig.1, the single peak intensity increased gradually with increasing doses between 0.1 and 100 kGy owing to the gamma rays inducing an increase in the defects responsible for the TL glow peak.
According to Debnath et al.[4], basic glass (pure silica)does not exhibit a significant TL response.Therefore, it is suggested that intrinsic impurities in commercial silicate glasses, such as Fe3+, Ni2+, and Mn2+[25, 26] ions are the origin of this TL emission.Narayan et al.[27] showed that imperfections and dislocations in glass are the primary factors contributing to the formation of TL centers in the structures of commercial glasses.Therefore, intrinsic defects are responsible for the 250 °C glow peak.
TL response was determined in the range of 0.1–100 kGy,and best fit was obtained for doses between 5 and 100 kGy,as shown in Fig.2.The dose response of the undoped sample was linear; notably, the undoped glass can be used as a dosimeter at higher doses.
3.2 Effect of ion‑exchange on the gamma irradiated samples
TL glow curves (observed in the temperature region 50–400 °C) doped with 1% of copper at 950 °C for 60 min and irradiated with different gamma-ray doses (0.1–100 Gy)are shown in Fig.3.The intensities of the overall TL glow curves are observed to increase progressively with increasing doses.

Fig.1 (Color online) TL glow curves of the non-exchanged glass samples gamma irradiated for doses ranging from 0.1 to 10 kGy.Inset shows the TL glow curve of the glass sample irradiated at 100 kGy

Fig.2 (Color online) TL response of non-doped glass gamma irradiated for doses of 0.1–100 kGy
Notably, after the Cu ion-exchange, the glass samples exhibited a TL response even at doses below 100 Gy.It is clear that the intensity of the TL response of the Cu-ion exchanged sample at 100 Gy is nearly six times higher than that of the non-exchanged sample irradiated at the same dose(Fig.1).Therefore, the sensitivity of the glass improved after the Cu-ion exchange.
The TL glow curves for each dose were constructed by superposing different thermograms corresponding to different types of emitting centers.Therefore, it is assumed that the dispersion of these centers does not allow them to interact.The TL envelope is a superposition of independent thermograms that can be resolved into Gaussian-shaped bands using a computerized best-fit procedure [28, 29].
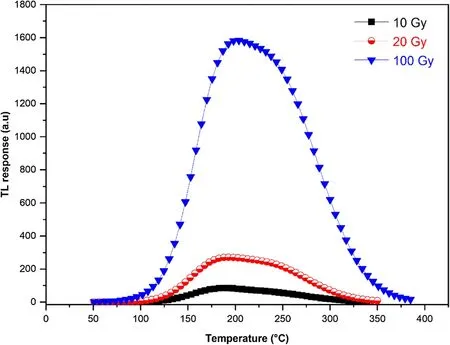
Fig.3 (Color online) TL glow curves of exchanged glass samples(950 °C, 60 min, 1%) gamma irradiated in the range 10–100 Gy
The Gaussian function used for the deconvolution was not based on a physical model.It was only used to separate and resolve the peaks observed in the glow curves and not to study the kinetics of the process.According to Vejnovic et al.[30] the Gaussian function is considered one of the most frequently used fittings; this program uses fittings of the experimental curves to model first-order kinetics.
The TL glow curves were approximated as the sum of two Gaussian functions with correlation coefficients (R2) greater than 0.99.Figure 4 shows the deconvolution of the two bands for the glass sample irradiated at 10 Gy.The TL glow curve exhibits two peaks at about 175 and 230 °C; the intensities of both the peaks increased with increasing doses.
The peak position, band area, and full width at half maximum (FWHM) values of the recorded spectra resulting from the deconvolution are listed in Table 1 for doses 5, 10, 20,50, and 100 Gy.The results revealed that both peak positions (approximately 175 and 230 °C) and their FWHM were unaffected by increasing dose.However, the intensities and band areas increased significantly, indicating that the radiation dose only affects the number of trap centers, which increases with the increase in the absorption dose.
Debnath et al.[4] reported the appearance of glow peaks at 414.5 K (141.35 °C), 450 K (176.85 °C), and 530 K(256.85 °C) for Cu-doped silica glass in the earlier work.The authors successfully demonstrated that the observed thermoluminescence originated from Cu+centers by studying the TL glow curve and comparing it with the PL spectrum of Cu+ions in the glass.

Fig.4 (Color online) Band deconvolution for exchanged glass samples (950 °C, 60 min, 1%) gamma irradiated at 10 Gy.Each band is modeled by a Gaussian

Table 1 Peak positions (Tmax), full-width at half-maximum(FWHM), and area of the band (A) values of Gaussian bands resulting from deconvolution of ion-exchanged glasses (950 °C, 60 min,1%) obtained from 5 to 100 Gy
In this study, two peaks were observed at 175 and 230 °C,which are close to the two peaks found by Debnath at 450 K(176.85 °C) and 530 K (256.85 °C), respectively.It can be assumed that the Cu+ions are responsible for the lowtemperature peaks that appear in the TL glow curve.It is established that Cu+ions govern the exchange process [31],and Cu ions are expected to exist primarily in the Cu+state in the silicate glass network.During the ion-exchange of Cu-Na, copper penetrates the glass principally in the form of Cu+ions, replacing the Na+ions in the matrix.Notably,the diffusion coefficient of Cu2+in the samples (similar to those prepared for this experiment) is very small [31]; therefore, the direct exchange with divalent copper ions is limited but cannot be neglected.Furthermore, the reduction of copper ions from Cu+to Cu2+is possible during the melting,annealing, and irradiation processes.The gamma radiationinduced ionization of Cu+ions and capture of released electrons in traps were assumed to form Cu2+ions as follows:
3.3 Thermoluminescence dependence on ion‑exchange conditions and dopant concentrations
To improve the resolution of the peaks detected on the glow curves and understand their relationship with the gamma irradiation effect, we varied the doping conditions, such as temperature, duration of the ion-exchange, and copper content, as shown in Table 2.
The TL intensity of S1 was considerable when the exposure dose increased beyond 100 Gy, as shown in Fig.5a.The glow curve was characterized by a peak at approximately 180 °C followed by a TL peak at approximately 250 °C, observed previously in Sect.3.2.Another TL glow peak appeared at approximately 320 °C, which increased with increasing dose.For S2, the weak peak at 320 °C only clearly visualized at doses larger than 2 kGy, as depicted in Fig.5b.

Table 2 Ion-exchange conditions
Figure 6 shows a comparison between TL glow curves for samples S1 and S2, both ion-exchanged with 2% of copper at 850 °C but with different ion-exchange durations.Figure 6a shows the samples S1 and S2 irradiated at 265 Gy, and Fig.6b shows the samples S1 and S2 irradiated at 2100 Gy.The TL intensity of S2 decreased sharply compared with that of S1.A higher intensity was obtained for longer ionexchange durations.
However, when the copper concentration was increased above 2% in the glass matrix, as shown in Fig.7 for S3(Fig.7a), S4 (Fig.7b), and S5 (Fig.7c), TL intensity decreased compared with that of sample S2.This observation suggests that increasing the copper concentration reduces the TL intensity.Therefore, to obtain a significant TL response with well-resolved peaks from samples doped with more than 2% Cu, the radiation dose had to be increased above 610 Gy.This was observed in samples S3,S4, and S5 with an intense peak at approximately 180 °C,another peak at approximately 250 °C, and weak TL kink at approximately 320 °C.For higher copper concentrations, TL intensity improved at doses of exposure larger than 1 kGy,as a clear and well-resolved peak was observed at approximately 320 °C for sample S5.To the best our knowledge,the origin of the glow peak at 320 °C has not been reported in the literature and is still under investigation.Such a glow peak was visualized in the samples doped with high concentrations only at doses above 1 kGy and for an ion-exchange duration of more than 60 min.Figure 8 illustrates the dependence of TL intensity with doping concentration for a fixed dose of irradiation, Fig.8a for samples irradiated at 610 Gy and Fig.8b for samples irradiated at 2100 Gy.A significant reduction in the TL intensity was observed with the increase in copper concentration.This diminution may be attributed to the well-known concentration quenching effect,that may result from the destruction of luminescent centers,which is due to step-by-step interaction between the luminescent centers by copper doping.This effect has been firstly described by Johnson and Williams [32, 33], recently developed and presented by several models [34, 35].Swamy et al.established similar behavior of decreasing TL intensity with increasing concentration [36], the authors have attributed this decrease to the concentration quenching phenomenon.
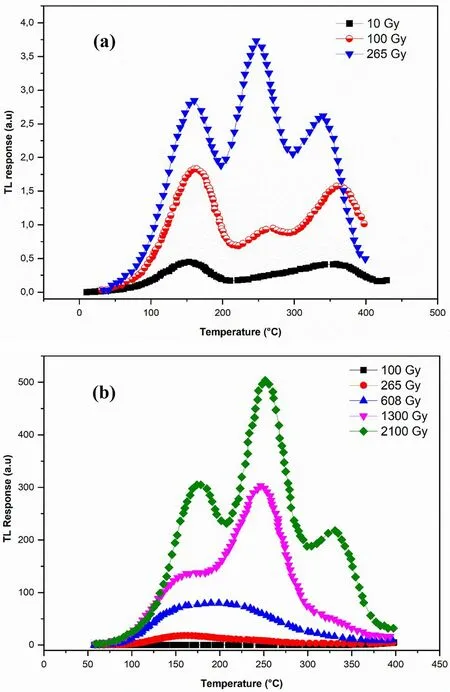
Fig.5 (Color online) TL glow curves of silicate glasses exchanged with 2% of copper irradiated with different doses of γ rays: a sample S1 and b sample S2
3.4 EPR spectra
Figure 9 shows the EPR spectra of the base glass sample and non-exchanged and ion-exchanged glass irradiated at 1300 Gy at 850 °C for 30 min with 2% of copper in the ion-exchanged glass (S2).No EPR signals were observed for the glass sample.The signal observed at 3500 G (g1 = 1.995,g2 = 1.990, andg3 = 1.988) is attributed to (Si–O°) non-bridging oxygen hole center (NBOHC)[37].After ion-exchange, a characteristic signal of Cu2+was observed, with principalgvalues ofg//= 2.232 andg⊥= 2.030.This EPR signal is similar to that reported for Cu2+in many other glasses [32, 38–40].

Fig.6 (Color online) Comparison plot of TL glow curves of glasses exchanged with 2% of copper irradiated with doses of 265 Gy a and 2100 Gy b for different ion-exchange durations
It can be observed from the figure that the NBOHC intensity sharply decreases after the Cu-ion-exchange,confirming that Cu was introduced into the glass mainly in the form of Cu+ions, and it acted as an electron trap,promoting the recombination of holes created by irradiation.The following reactions are proposed to explain this mechanism.
(1) Formation of an NBOHC ( ≡ Si–O°) by rupture of bonds after gamma irradiation

Fig.7 (Color online) TL glow curves of silicate glasses exchanged with different concentrations of copper and irradiated with different doses of γ rays for sample S3 (a), sample S4 (b), and sample S5 (c)
(2) Recombination of holes created by irradiation and formation of Cu2+ions
Figure 10 shows the EPR spectra of S2 irradiated at doses of 100, 265, 610, 1300, and 2100 Gy.The Cu2+signaldecreased with increasing dose, which may be due to the conversion of Cu2+to Cu+during irradiation shown as
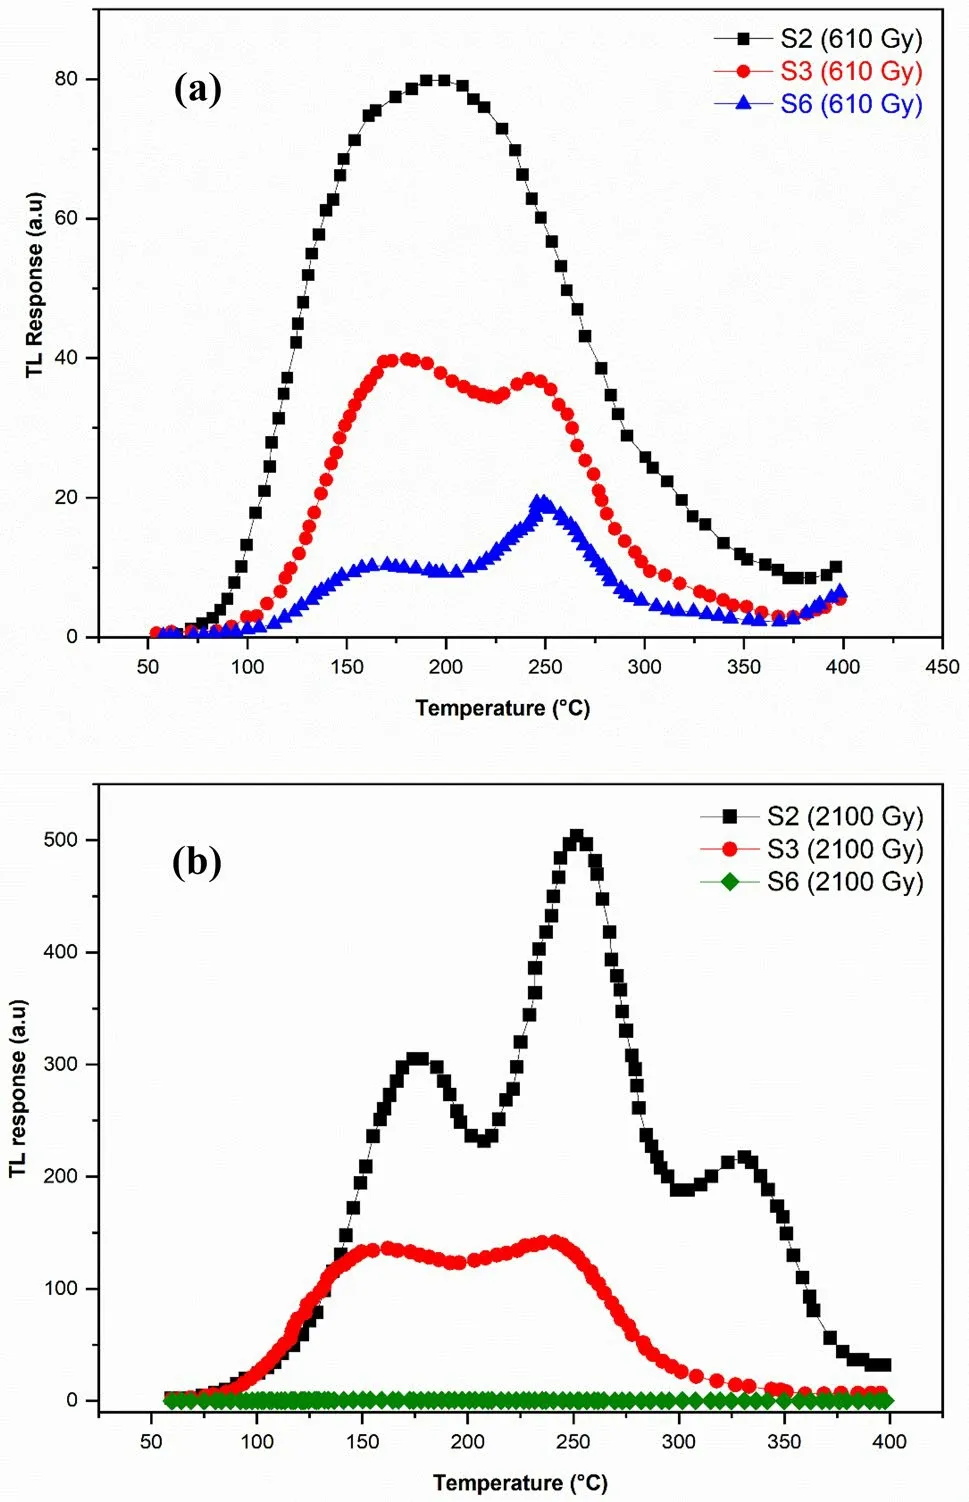
Fig.8 (Color online) Variation of TL intensity with the concentration of copper for a fixed dose of irradiation and fixed duration of ionexchange: a 610 Gy and b 2100 Gy
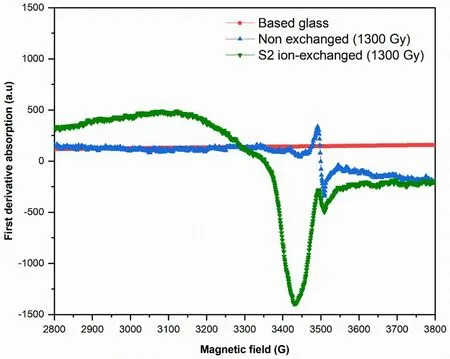
Fig.9 (Color online) EPR spectra of base glass, non-exchanged glass,and Cu-ion exchanged S2 irradiated at 1300 Gy
Notably, the highest Cu2+EPR signal observed for S2 at 100 Gy has the lowest TL intensity, as shown in Fig.5b.In contrast, for S2 irradiated at 2100 Gy, nearly no Cu2+EPR signal was observed with the highest TL intensity (Fig.5b).This indicates that the sample with good TL sensitivity showed no EPR signal for Cu2+.The absence of this signal conforms to the presence of copper ions in a monovalent state, which is diamagnetic and does not give rise to signals in the EPR spectrum [39].However, the samples with poor TL exhibited the maximum EPR signal of Cu2+.
It can be observed from Fig.10 that the EPR Cu2+signals decrease with increasing dose, which may be due to a decrease in Cu2+ions converted into Cu+[38, 41].This result coincided with an increase in the TL intensity with increasing doses for the same samples, which supports the idea that copper in the Cu+form is necessary to obtain a good TL, and these centers may be responsible for the observed high TL intensity, as reported by Debnath [4] and discussed in Sect.3.2.
3.5 TL dose response for exchanged samples
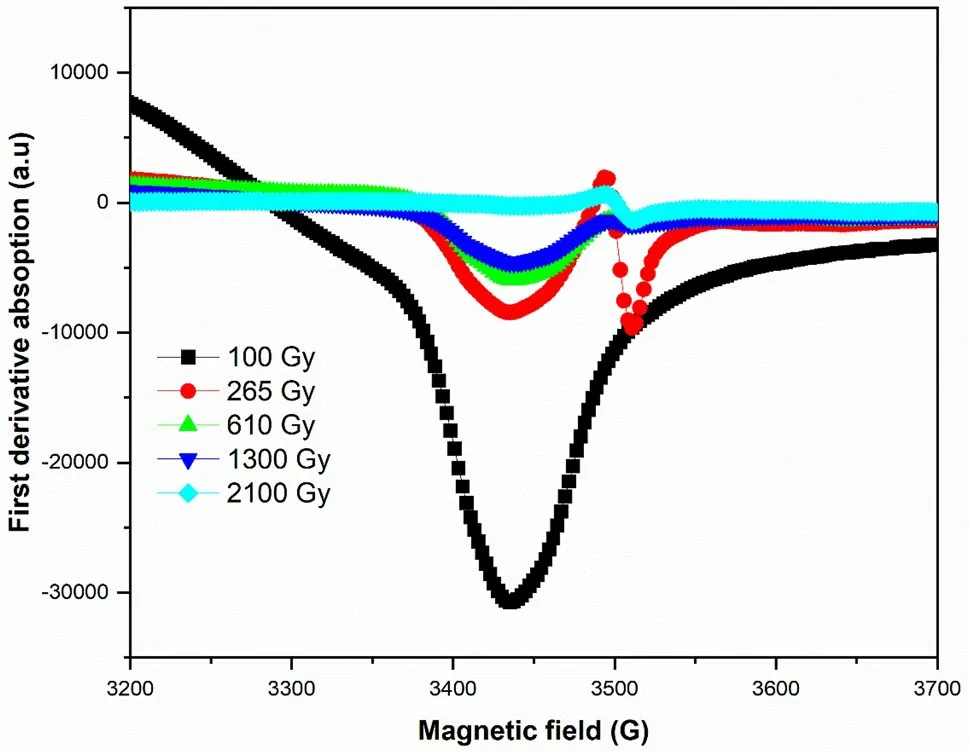
Fig.10 (Color online) EPR spectra of S2 irradiated at doses 100,265, 610, 1300, and 2100 Gy
For any TLD application, a linear relationship between the TL emission and absorbed dose is a necessity.The TL response measured in nanoamperes (nA) was normalized to the mass (mg) of the glass samples.Figure 11 shows the TL dose response for the ion-exchanged glass at 950 °C for 60 min doped with 1% Cu exposed to a dose in the range of 1–100 Gy.It is determined that the first thermal peak observed at approximately 180 °C is nearly two times more sensitive than the second peak observed at approximately 230 °C.
The TL dose responses were evaluated for the low-dose range (1–150 Gy) and high-dose range (0.1–100 kGy) for different ion-exchange conditions, as shown in Fig.12a and b.The TL response was linear for all ion-exchange conditions and both dose ranges.Copper-ion-exchanged silicate glasses can be used as routine dosimeters after proper calibration in industrial radiation processing and radiotherapy dosimetry, unlike the TLD 100 dosimeter, which has a dose range of 10 μGy to 10 Gy [42, 43], which is used only as a personal dosimeter in radiotherapy dosimetry [44, 45].
3.6 Sensitivity
An important characteristic that provides information about the material response is the sensitivity of the TL material,which was obtained as the TL response per unit mass of sample and unit dose: nA mg–1Gy–1.
Tables 3 and 4 illustrate the sensitivity values corresponding to the low-dose range (1–150 Gy) and high-dose range(0.1–100 kGy), respectively.It is shown that copper concentration is the most influential parameter for sensitivity.
3.7 Effect of dose rate

Fig.11 (Color online) TL response of ion-exchanged glass at 950 °C,60 min, 1% gamma irradiated in the dose range of 1–100 Gy

Fig.12 (Color online) Comparison plot of TL response (the peak at approximately 180 °C) of glasses exchanged at 850 °C for different duration of ion-exchange and different concentrations of copper: a gamma irradiated in the dose range of 1–150 Gy and b gamma irradiated in the dose range of 0.1–100 kGy
Ion-exchanged glass samples (S1) are irradiated at doses of 10 and 100 Gy with gamma rays at dose rates of 0.16 and 110 Gy/min, respectively.The TL response values at peaks of approximately 180, 230, and 350 °C for each absorbed dose and dose rate are shown in Table 5.It can be observed that the TL response does not depend strongly on the dose rate when irradiated at 10 Gy; the TL response increased significantly for all the peaks when the ion-exchanged samples were irradiated at 100 Gy.This effect can be avoided using different calibration curves at specific dose rates.
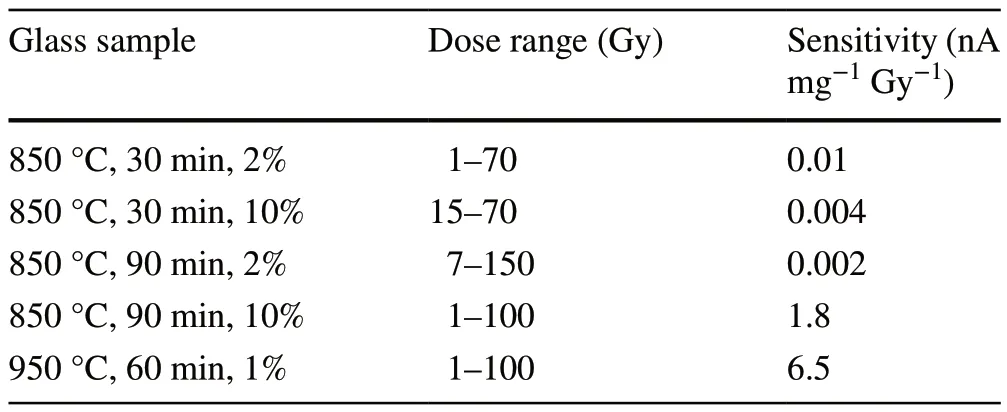
Table 3 Sensitivity of exchanged glasses for low doses 1–150 Gy
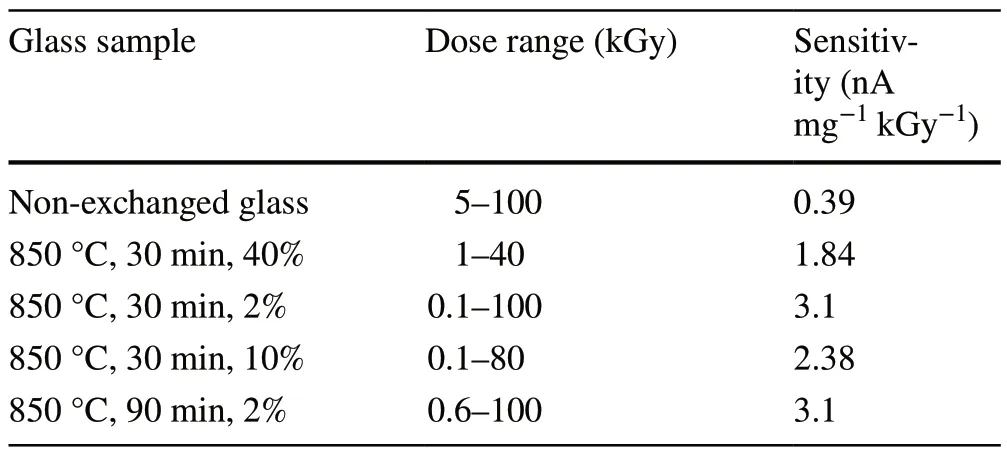
Table 4 Sensitivity of exchanged glasses for high doses 0.1–100 kGy

Table 5 Dose rate effect on ion-exchanged glass sample (S1) irradiated at 10 and 100 Gy with the dose rates of 0.16 and 100 Gy/min,respectively
4 Conclusion
This study investigated the thermoluminescence (TL)characteristics of gamma-ray irradiated commercial silicate glasses ion-exchanged with copper in the temperature range of 50–400 °C for doses ranging from 0.001 to 100 kGy.The ion-exchange route was performed at temperatures of 850 and 950 °C in a molten mixture(CuSO4:NaSO4) with a copper concentration of 1–60%for durations of 30, 60, and 90 min.The glow curves of these glasses exhibited a TL peak at approximately 250 °C,which is attributed to intrinsic impurities observed at doses larger than 100 Gy that increase with increasing dose.Three other TL glow peaks that were observed after the ion-exchange at approximately 180, 230, and 320 °C.The results showed that TL inhibition was due to the presence of a larger concentration of copper and short duration of ion-exchange.Electron paramagnetic resonance(EPR) measurements showed that the Cu2+EPR signal decreased with increasing dose.This observation supports that Cu+ions can be responsible for the observed TL peaks at approximately 180 and 230 °C.Therefore, additional investigations are required to discover the origin of the peak at 320 °C.The changes in dose response, linearity,dose rate effect, and sensitivity were evaluated under different ion-exchange conditions, and the TL response was linear.The regression coefficient (R2) confirmed the linear dose response of the glass samples.Linearity indicates that the number of traps generated by irradiation is proportional to the gamma radiation dose.
The present study revealed that the specific TL responses of different ion-exchanged glasses to gamma irradiation can be quantified reasonably well in a large-dose range of 0.001–100 kGy.
An investigation into the effects of other types of radiations, such as electron beams, neutrons, and proton beams,will be the subject of our future research.
Author contributionsAll authors contributed to the study conception and design.Material preparation, data collection and analysis were performed by Safa Toumi and Khaled Farah.The first draft of the manuscript was written by Safa Toumi and all authors commented on previous versions of the manuscript.All authors read and approved the final manuscript.
Conflict of interestThe authors declare that they have no competing interests.
杂志排行
Nuclear Science and Techniques的其它文章
- GPU‑based cross‑platform Monte Carlo proton dose calculation engine in the framework of Taichi
- Photonuclear production of nuclear isomers using bremsstrahlung induced by laser‑wakefield electrons
- High‑precision high‑voltage detuning system for HIAF‑SRing electron target
- Resolution analysis of thermal neutron radiography based on accelerator‑driven compact neutron source
- Decomposition of fissile isotope antineutrino spectra using convolutional neural network
- Searching for QCD critical point with light nuclei
