Resolution analysis of thermal neutron radiography based on accelerator‑driven compact neutron source
2023-07-11LianXinZhangSiZeChenZaoDiZhangTaoShengLiChuanPengLeiRenRuiZhangDanXiaoYongZhang
Lian‑Xin Zhang ·Si‑Ze Chen ·Zao‑Di Zhang ·Tao‑Sheng Li ·Chuan Peng ·Lei Ren ·Rui Zhang ·Dan Xiao ·Yong Zhang
Abstract Owing to the immobility of traditional reactors and spallation neutron sources, the demand for compact thermal neutron radiography (CTNR) based on accelerator neutron sources has rapidly increased in industrial applications.Recently, thermal neutron radiography experiments based on a D-T neutron generator performed by Hefei Institutes of Physical Science indicated a significant resolution deviation between the experimental results and the values calculated using the traditional resolution model.The experimental result was up to 23% lower than the calculated result, which hinders the achievement of the design goal of a compact neutron radiography system.A GEANT4 Monte Carlo code was developed to simulate the CTNR process, aiming to identify the key factors leading to resolution deviation.The effects of a low collimation ratio and high-energy neutrons were analyzed based on the neutron beam environment of the CTNR system.The results showed that the deviation was primarily caused by geometric distortion at low collimation ratios and radiation noise induced by highenergy neutrons.Additionally, the theoretical model was modified by considering the imaging position and radiation noise factors.The modified theoretical model was in good agreement with the experimental results, and the maximum deviation was reduced to 4.22%.This can be useful for the high-precision design of CTNR systems.
Keywords Neutron radiography ·Spatial resolution ·Accelerator-driven neutron source ·Geant4 ·MTF ·ESF
1 Introduction
Neutron radiography has been established as an important non-destructive inspection method and quantitative measurement tool [1].Because thermal neutrons can provide a strong contrast for some elements close to one another in the periodic table and can even distinguish isotopes of the same element, neutron radiography can provide complementary X-ray and gamma-ray radiography [2].It is widely used in the aerospace industry, national defense, materials energy, biological archeology, and other fields.Currently,thermal neutron radiography (TNR) is an important field in the development of neutron radiography [3].However,the traditional TNR is mainly based on an expensive, bulky,and immovable reactor or spallation neutron source, which greatly limits its application.Compact thermal neutron radiography (CTNR) can mitigate these challenges [4, 5].
In contrast to conventional TNR, CTNR commonly uses a compact accelerator as the neutron generator.Acceleratordriven neutron sources (such as D-D or D-T neutron generators) require complex moderator and collimator configurations to create neutron beams with suitable radiographic properties [6].Its intensity is 2–3 orders of magnitude lower than that of the reactor or spallation neutron source.Consequently, the quality of the available neutron beam after moderation and collimation is significantly lower than that of conventional neutron radiography, which mainly manifests as a low collimation ratio (L/D) (Table 1) and low thermal neutron content (Fig.1) [5, 7].Both of these factors have an adverse effect on imaging resolution, but are less consideredfor conventional TNR systems.Based on this background,this paper presents an in-depth study of the resolution of a CTNR system.

Table 1 Parameters of TNR facility

Fig.1 (Color online) Comparison of neutron spectrum between the reactor and moderator
2 Shortcoming of the traditional theoretical resolution model
2.1 The traditional resolution model of neutron radiography
The modular transfer function (MTF) is a classical resolution analysis method based on the frequency domain derived from the Fourier transform of a point spread function (PSF).Compared with the PSF and other spatial domain methods,the MTF method has higher accuracy in resolution calculation.The MTF is defined as the ratio of the output modulation to the input modulation.The MTF of an image can be calculated using the following equation [15]:

The model of resolution is essential for designing a TNR system to ensure that realistic resolution goals are established and achieved.The traditional theoretical resolution model focuses on the TNR system structure, which comprises a collimator, converter screen, and imaging system [15].Assuming that the effects of these components on the imaging resolution are independent of each other,the total MTF of a digital thermal neutron imaging system can be analytically produced through a Fourier transformation [17]:
whereuis the spatial frequency of imaging,dis the distance of the converter screen from the sample,Dis the diameter of the neutron aperture,Lis the distance from the aperture to the sample,δis the optical diffusion response of the converter screen, ∆sis the sampling at the sensor,MCCDis the scintillator-to-CCD magnification, and Δs∕MCCDis image sampling on the converter screen.The MTF describes the magnitude of the system’s frequency response.The theoretical resolution model is helpful for depicting and quantifying the system resolution.

Fig.2 (Color online) Relationship between resolution and L/D: a optical diffusion response and b image sampling
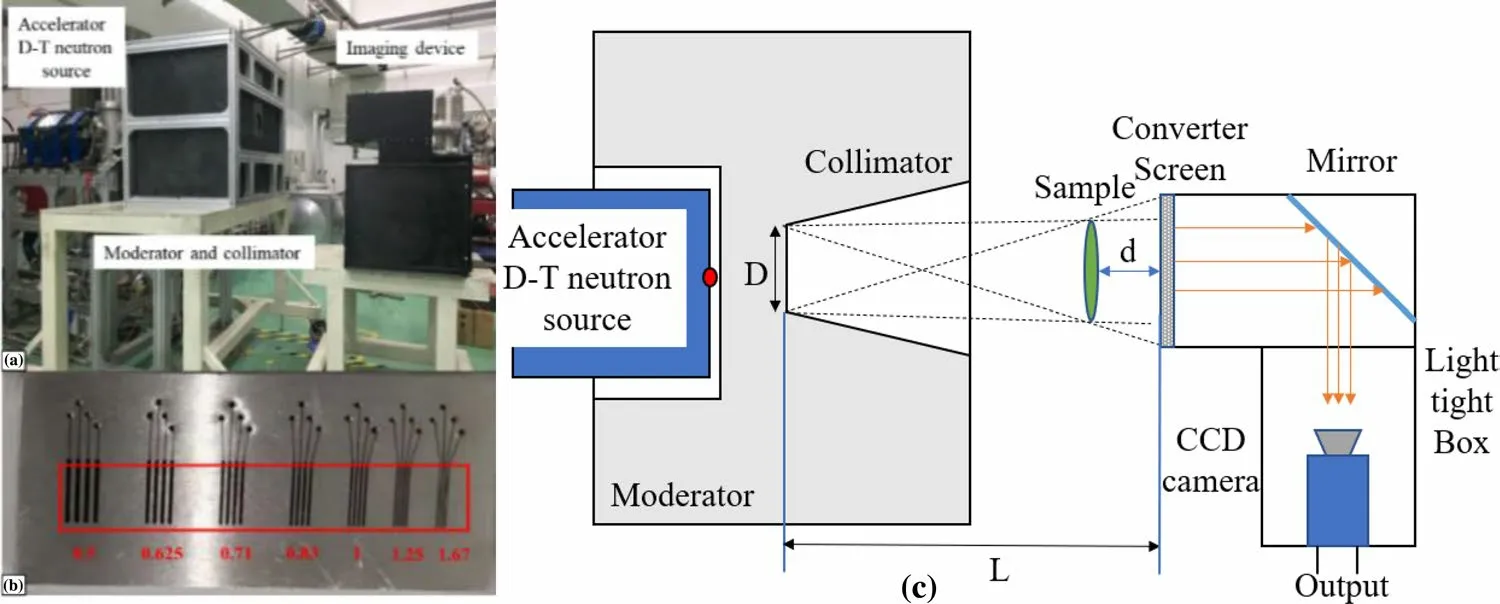
Fig.3 (Color online) Experimental setup for the HFIPS: a picture of the terminal, b picture of the line-pair sample, and c schematic of the setup
2.2 The deviation of the theoretical resolution model applied to CTNR
Based on the traditional theoretical resolution model, this study analyzed the factors affecting the imaging resolution of a TNR system driven by the typical accelerator neutron source listed in Table 1.Figure 2 shows the relationship between the resolution andL/Dwith different optical diffusion responses and image samplings on the converter screen.When theL/Dratio is less than 12, the curves for each parameter coincide.This result indicates that the influence of the converter screen and image sampling is small in the resolution analysis at a lowL/Dratio and that theL/Dratio becomes the most important factor affecting the resolution.
To verify the applicability of the theoretical model, a standard line-pair (Fig.3b) sample neutron radiography experiment was performed based on the TNR terminal with aD-Tfusion neutron source (Fig.3a) built by Hefei Institutes of Physical Science (HFIPS), Chinese Academy of Sciences.The iron sample had dimensions of 50 mm × 100 mm × 10 mm and seven line pairs of 0.5, 0.62,0.83, 1.0, 1.67, and 2.0 lp/mm separately.A schematic of the system is shown in Fig.3c.Table 2 lists the characteristics of the neutron beam emitted by the moderated collimator ofthe neutron radiography terminal and the information of the imaging system.

Table 2 Parameters of compact thermal neutron radiography facility in INEST

Fig.4 (Color online) Results of the standard line-pair sample experiment: a result with L/D = 7.4 and corresponding sampling area; b results with other L/D ratios
Neutron radiography experiments were conducted usingL/Dvalues of 6.3, 7.4, 8.8, 10, and 12, respectively.The imaging exposure time was 300 s.Figure 4 shows the radiography results of line pairs with differentL/Dratios.The center of the imaging field of view (FOV) coincided with the center of the neutron beam.Figure 4a shows the neutron radiograph withL/D= 7.4.The red box in the figure represents the sampling area of the line-pair image, and the corresponding gray curve was obtained.The gray curves of the images with otherL/Dratios are shown in Fig.4b.The corresponding MTF(f) function value of each line-pair image can be obtained by substituting the gray value into Eq.(1).Then, the image resolution was obtained according to MTF = 0.1 by using the interpolation method, as shown in Fig.5a.The theoretical resolution results under the same conditions were calculated using Eq.(2).A comparison between the experimental results and the theoretical resolution curve is shown in Fig.5b.The results show that the image resolution improves with an increase inL/Din both the experimental data and theoretical calculations.However,all the experimental points were higher than the theoretical calculation curve, and the maximum deviation reached 23.1%.There was a significant deviation between the theoretical model and the experimental results, and the reason for this deserves further study.
3 Analysis of main parameters affecting spatial resolution and resolution deviation
In this section, the effects of a lowL/Dratio and a high proportion of nonthermal neutrons on the imaging resolution are discussed to elucidate the reasons for the deviation mentioned above based on the Monte Carlo simulation numerical analysis method, which is performed on the GEANT4 framework [18].The G4TENDL database [19], which has been proven to have high computational accuracy in previous studies [20], was used in the Monte Carlo calculations.
3.1 Effect of low L/D ratio on CTNR system
3.1.1 Geometric distortion
In this study, a GEANT4 Monte Carlo calculation model was built based on a theoretical resolution model.As shown in Fig.6, the model consisted of three modules: a surface neutron source with a diameter of 9 cm, a converter screen with an area of 20 cm × 20 cm, and a position-sensitive detector.The surface neutron source was used to replace the accelerator neutron source and moderator to simulate the neutron beams emitted from an ideal neutron aperture.The converter screen material was6LiF/ZnS and its specific parameters are listed in Table 3 [21].The photon-emission spectra of the converter screen and other scintillation parameters were set according to previous studies [22].The positionsensitive detector was affixed to the back of the converter screen.The single pixel sampling area of the detector is 0.2 mm × 0.2 mm, which is consistent with the projection of CCD camera pixels on the converter screen.This detectoris used to record information about the number and position of photons produced from the converter screen [23], which generates grayscale images for comparison with the experimental results.Based on this model, the effect of neutron beam characteristics on resolution can be analyzed using an arbitraryL/Dparameter.
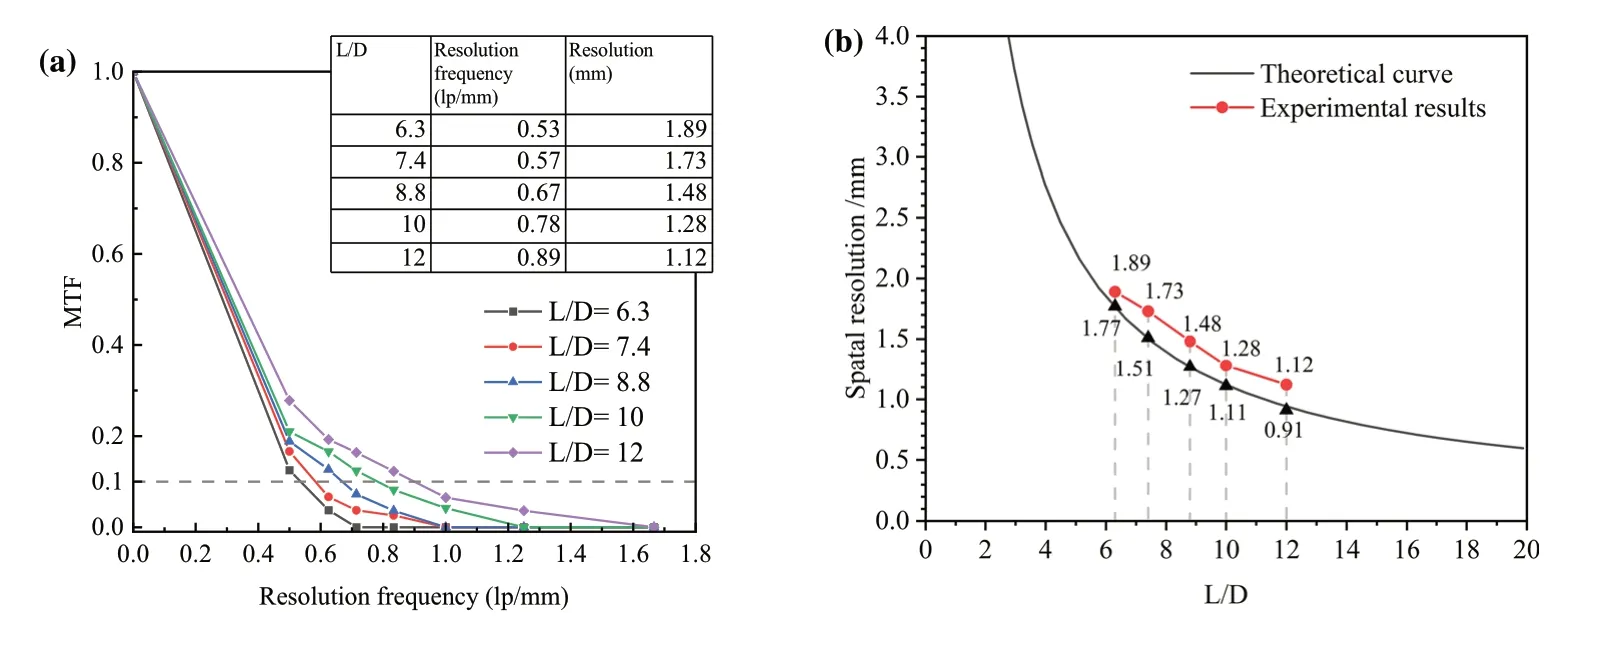
Fig.5 (Color online) MTF Calculation results: a under different L/D conditions and b comparison between experimental results and theoretical curves

Fig.6 (Color online) Model of the ideal TNR system used in the GEANT4 simulation program
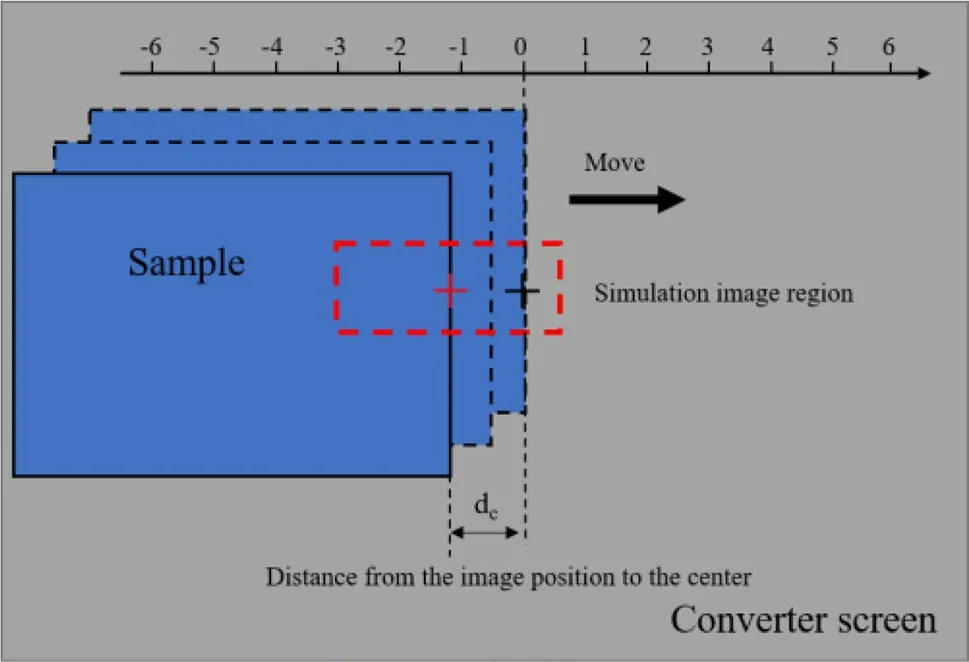
Fig.7 (Color online) Schematic of the resolution of each position measured using the ESF method

Table 3 Optical properties of the converter screen [21, 22]
The edge-spread function (ESF) method was used to extract the resolutions at different locations in the simulated image [24].In this method, an opaque sample with a straight edge is used as the image object, and the curve of the graylevel change in the direction of the vertical image edge in the image plane is called the ESF curve.The spatial resolution was defined as the distance between 10 and 90% of the ESF curve [25].A schematic of the resolution measurement simulation model using the ESF method is shown in Fig.7.The red box in the figure represents the imaging sampling area, and the center of the red box is located on the edge of the sample.The relative distance between the edge of the sample and the imaging center was defined asdc.The sample used in the experiment was a 1 cm-thick rectangular iron block.Different images were obtained in the simulations by adjusting the edge positions of the samples.The curves of the gray values of the images were obtained from the simulation images, and the resolution of each position was calculated using the ESF method.
The simulation results were compared with experimental images to verify the accuracy of the simulation.The yellow boxes shown in Fig.4 (L/D= 7.4) are selected as the sampling areas withdc= 1.0 cm anddc= 5.0 cm.The gray images extracted from the experimental image are presented together with the images obtained from the simulations with the same parameters ofdcin Fig.8a.The gray curves extracted from these images are compared in Fig.8b.The results show that the simulated curves agree well with the experimental curves.The calculated resolution of the simulated image deviated from the experimental data by less than 4.5%.
Based on the validated simulation analysis method, the imaging resolutions withL/D= 7.4 at different positions were first calculated.The simulation results are shown in Fig.9a.The black line represents the spatial resolutions at different positions, as shown in Fig.7, and the red line represents the deviations between the simulated and theoretical resolutions.In Fig.9a, the resolution curve exhibits a symmetrical structure, and the deviations increase linearly withdc.To further study the influence ofdcon the resolution under differentL/Dconditions, images with five differentL/Dratios were simulated, and resolutions at different imaging positions were obtained.Figure 9b presents the variations in the deviations between the simulation and theoretical calculation results at differentdcpositions.The results show an incremental deviation asdcincreases, which gradually narrows asL/Dincreases.Another interesting result(Fig.9b) is that the simulation results are consistent with the resolutions of the theoretical model at the center of the image (dc= 0), and the maximum deviation is less than 2.7%.
The experimental data analysis provided a result similar to that of the Monte Carlo simulation.Figure 9c presents the ESF curves derived from the experimental data forL/D= 7.4 andL/D= 12.Under differentL/Dconditions,there was a significant deviation between the imaging locationsdc= 1 cm anddc= 5 cm.Moreover, the deviation with a smallerL/Dratio is larger.The experimental data intuitively show the impact of geometric distortion on the imaging resolution.
Based on the above analysis, it can be concluded that geometric distortion is an important factor that leads to resolution deterioration.Under low collimation conditions,the resolution deterioration caused by geometric distortion increases linearly withdc.
To explore the mechanism underlying this phenomenon, the neutron beam emission angle distribution was calculated using a previously built Monte Carlo simulation model.Neutron emission angles were recorded on the front surface of the converter screen at differentdcintervals.Figure 10a presents the calculation results with thedcvalue intervals of 0–1 cm, 1–2 cm, 3–4 cm, 5–6 cm,7–8 cm, and 9–10 cm under the condition ofL/D= 10;Fig.10b presents the calculation results of thedcvalue range of 4.5–5.5 with 5 differentL/Dratios.
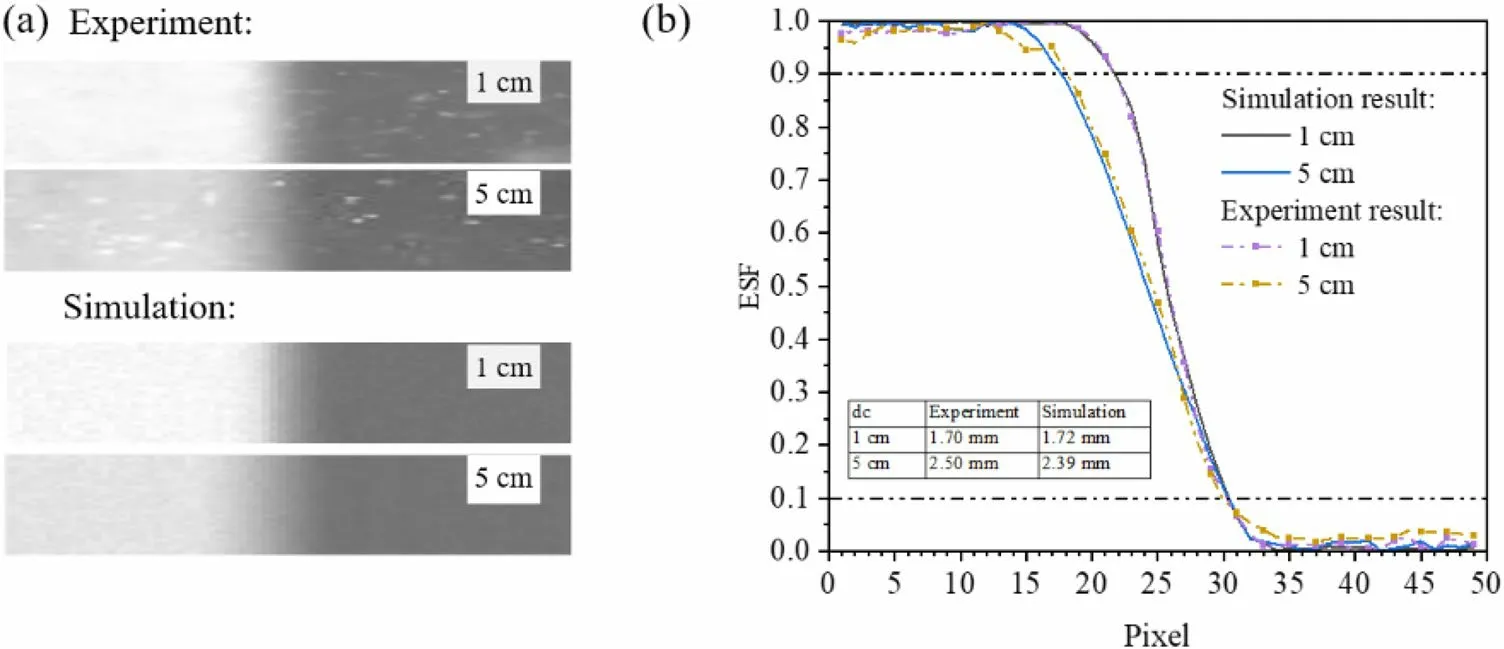
Fig.8 (Color online) Comparison of experimental and simulation results: a gray image of sample edge and b corresponding gray curve

Fig.9 (Color online) Resolution analysis of geometric distortion by LSF method: a simulation results of relationship between resolution and dc with L/D = 7.4, b variation of deviations between simulation results and theoretical calculation results with different L/D ratios,and c experimental ESF curve comparison of line-pair edge images with different L/D ratios
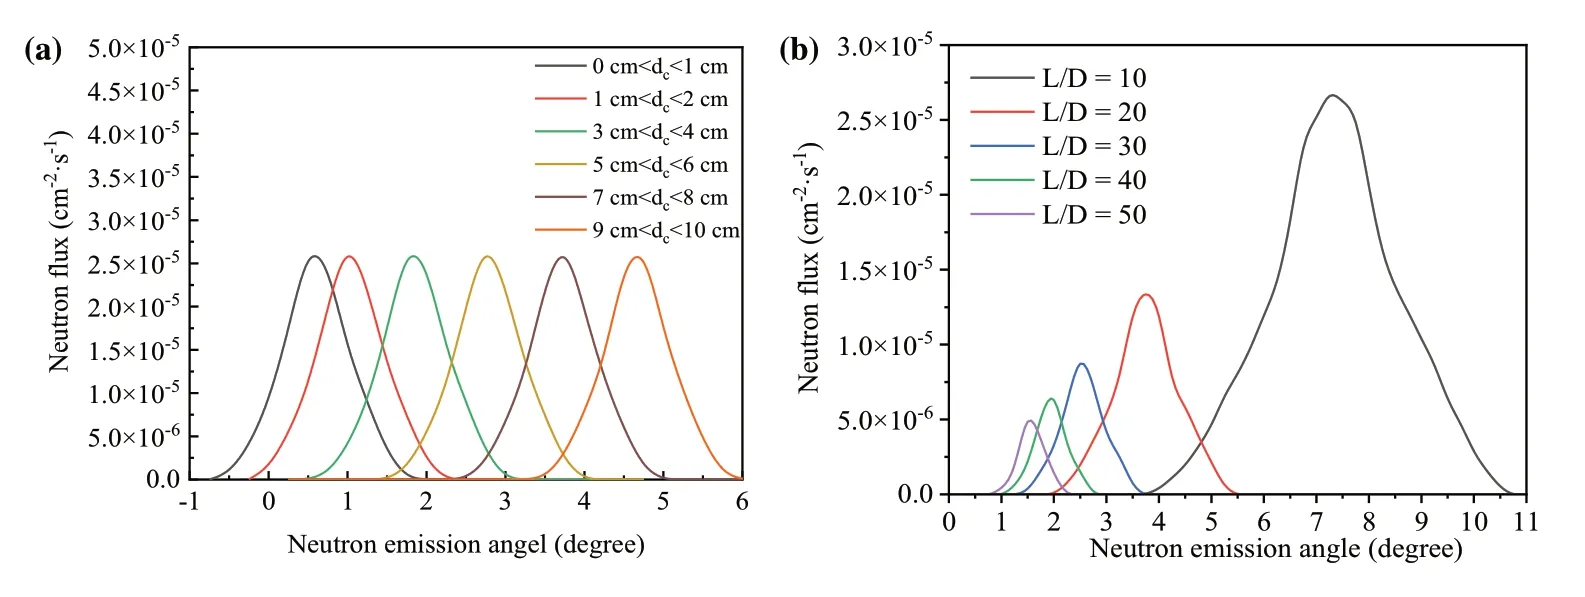
Fig.10 (Color online) Results of neutron angle distribution with different a dc values and b L/D values
The results in Fig.10 show that when onlydcincreased,the Gaussian widths of the neutron emission angle did not change significantly, whereas the average neutron emission angle gradually increased.Whendcis fixed, the average values of neutron emission angle decrease withL/D.These results indicate that the degradation of the image resolution is related to the average value of the neutron emission angle, which can be derived from the parameterdc.
Based on the above considerations, a theoretical derivation was performed in this study.Figure 11 shows the geometric layout of the collimator, object, and converter screen.The off-set distancedgbetween the original and actual positions can be calculated based on a simple trigonometric relation:

Fig.12 (Color online) Schematic of geometrical distortion on the converter screen
wheredcis the distance from the object to the imaging center,Lis the distance from the aperture to the object, anddis the distance from the object to the screen.
An oblique-incidence neutron beam also results in geometric distortion on the converter screen.A schematic of the NIL process on the converter screen is shown in Fig.12.The offset distance can be calculated using Eq.(4) as follows:
wheredsis the offset of the light output on the converter;tis the thickness of the converter screen as the effective photon yield is generated mainly by neutrons that react at the bottom of the screen; andLis the distance from the collimator aperture to the converter screen.The offset is proportional totanddcand inversely proportional to theL/Dratio.Figure 13 shows the simulation results of the light spot generated by a neutron beam with differentdcunder theL/D= 10 condition.A phenomenon in whichdsmoves proportionally withdccan be observed.
Both offsets introduced before blurred the image of the object edge and deteriorated the resolution.Geometric distortion is caused by the physical characteristics of the beam emission angle.This can also be observed in the traditional TNR and other optical imaging systems [26].In contrast to the CTNR system,L/Dis usually very large in these imaging areas, and the effect of geometric distortion is usually insignificant.
3.1.2 Effect on converter screen characteristics
The characteristic parameters of a converter screen include the photon yield and optical diffusion response [27].A series of calculations was performed to study the characteristics of the converter screen.In the neutron radiography system, the optical diffusion response (δ) of the converter screen can be calculated as follows [16]:
wherehs(x,y) is the light output distribution induced by a single neutron beam from the converter screen.Figure 14a shows the Monte Carlo simulation results of the photon output behind the converter screen, which conform to the Gaussian distribution of Eq.(5).The Gaussian widths of the photon distribution with a largeL/Dratio were obviously smaller than those with a smallL/Dratio, whereas the neutron light yield in the spot center decreased with the deterioration ofL/D.Figure 14b comparesδfitting from Fig.14a and the total neutron light yield together.δof the converter screen shows a negative relationship with theL/Dratio, which is consistent with the analysis results presented in Fig.14a.However, under differentL/Dconditions, the total photon yield of the neutrons was approximately the same.This indicates that theL/Dratio did not affect the light output of the converter screen.Figure 14c shows the variation curve of the optical diffusion response versus screen thickness under differentL/Dconditions.WhenL/D= 100,the curve shows few correlations; however, the other two curves exhibit evident positive correlations.In addition, the effect of conversion screen thickness onδincreases significantly with the decrease in collimation ratio.

Fig.13 (Color online) Light spots generated by the neutron beam vary with dc = 0 cm a, dc = 5 cm b, and dc = 10 cm c.

Fig.14 (Color online) Different characteristics of converter screen: a photon output distribution with different L/D ratios, b comparison between photon yield and δ with different L/D ratios, and c relationship between δ and the thickness of converter screen
In an ideal neutron radiography model, different components are considered independent of each other.However,from the analyses above, we can find that under a lowL/Dcondition, a change inL/Dratio will affectδof the converter screen.This is one of the factors potentially leading to the deterioration of the resolution observed in the experiments.When the thickness of the converter screen is set to 100 μm as used in the experiment,δis 6.32 μm withL/D= 10 and 3.49 μm withL/D= 100.In this situation,the MTF change caused byδis only 0.89% on the limiting resolution of devices (1 lp/mm).This result shows that the change ofδunder differentL/Dconditions can affect the image resolution.However, the effect ofδis not obvious.
3.2 Effect of high‑energy neutrons on CTNR system
3.2.1 Effect on converter screen
In the CTNR system, a moderator is used to moderate fast neutrons from the accelerator.To study the relationship between the neutron energy and spatial resolution, a CTNR system model is proposed, as shown in Fig.15a.An 8 cmthick lead layer was used as the first layer of the moderator and a 5 cm-thick polyethylene layer was used as the second layer to obtain thermal neutrons.The reflective layer material was 15 cm-thick graphite.This design can significantly improve the thermal neutron flux [28, 29].Before the first layer of moderator, a 14 MeV surface neutron source with a diameter of 1 cm was set on the central axis of the moderator to simulate accelerator neutron source beam spot.This model was used to study the thermal neutron flux, neutron beam energy spectrum, and photon yield in a CTNR system.Figure 15b presents the energy spectrum of the neutron beam emitted from the moderator.The proportion of thermal neutrons in the neutron beam was only 9.13%, which indicated that numerous nonthermal neutrons still existed in the moderated neutron beam.Therefore, it is necessary to study the effects of nonthermal neutrons on imaging.
Nonthermal neutrons work with the converter screen through different cross sections.Therefore, the photon yield with neutrons of different energies was first calculated (Fig.16a).The photon yield was roughly consistent with the microscopic cross section of6Li.Figure 16b shows the simulation results of the photon yield produced by the neutron beam exiting the moderator.The proportion of photons generated by thermal neutrons was 95.79%,whereas that of photons generated by nonthermal neutrons was 4.21%.Based on the above results, the effect of nonthermal neutrons on the imaging resolution can be neglected in CTNR systems, even with a low proportion of thermal neutron beams.
3.2.2 Effect on CCD
The shielding of a CTNR system is limited by its geometric dimensions, and it is difficult to completely shield highenergy neutrons and their secondary gamma rays.When radiation particles reach the CCD chip, they deposit energy that generates electronic noises [30].The noisy images obtained under different experimental conditions are shown in Fig.17.As shown in the figure, the effect of white spot noise cannot be neglected, even with shielding.The proportions of noise in the neutron radiography images with and without shielding were 2.07% and 7.09%, respectively.

Fig.15 (Color online) Simulation of the CTNR system: a GEANT4 model and b neutron energy spectrum on the converter screen

Fig.16 (Color online) Simulation results of photon yield: a photon yield of different energy neutrons and b light yield distribution of neutrons exiting the moderator

Fig.17 Noisy images under different experimental conditions: a before the experiment,b without shielding, and c with shielding

Table 4 Comparison of resolutions obtained by different methods
The presence of radiation noise in images is harmful to the quantitative analysis of the resolution.The ESF and MTF methods are based on the numerical analysis of the gray curve in the sampling area.Because of the limited sampling area, a few random white spots significantly interfered with the grayscale curve, which in turn affected the resolution analysis results.Median filtering is sometimes used to eliminate noise in neutron radiography images.However,median filtering also leads to an overall decrease in imaging resolution, and the algorithm cannot eliminate white spots completely [31].The theoretical resolution model does not consider the effect of electronic noise and background radiation, which is negligible compared with the radiation noise in a short imaging time.A quantitative study of the effect of radiation noise on image resolution is introduced in the next section.
where MTF0is the theoretical MTF, which is not affected by geometric distortion, and MTFpis the MTF measured experimentally.The image of a slit was obtained by subtracting the ESF curves of the two edges of the slit.Because of the narrow width of the slit, the two curves are assumed to be identical.Imax−Iminis proportional to the slope of the ESF curve.The slope is inversely proportional to the ESF resolution of the curve.According to Eq.(7), the measured MTFpcan be expressed as follows:
where ESFpdenotes the ESF resolution of the line pair.ESF0is the ESF resolution atdc= 0.The relationship between ESFpand ESF0is obtained using Eq.(6).When the corresponding resolution of ESF0and the theoretical resolution are assumed to be the same, the MTF at the line pair can be calculated as:
4 Optimization of the theoretical resolution model for CTNR system
4.1 Correction of geometric distortion
The geometric distortion effect deviates from the projection position of the object, which leads to the horizontal stretching of the ESF curve.According to the above analysis, the total stretch length of the ESF curve is the sum of the spot position offsetsDgandDsin Eqs.(3) and (4).The ESF after geometric distortion can be calculated using Eq.(6):
where ESFpdenotes the actual resolution.ESF0is the resolution atdc= 0.The constant 0.8 is derived based on the ESF method (the difference value between 10% and 90%).Table 4 presents a comparison of the resolutions of the experimental, simulation, and theoretical results.These three results are in good agreement (deviation within 3%).
In the measurements, the MTF corresponding to a line pair was calculated using Eq.(1), and the input MTF (Min)was fixed.Owing to geometric distortion, the gradient of the curve corresponding to the gray gradient of the line pair changed.However, this did not affect inputsImaxandIminin the measurement of each line pair.The variety of MTF caused by the geometric distortion can be expressed as
This equation was used to analyze the experimental data for calculating the MTF considering geometric distortion.The results were compared with those without correction and are shown in Table 5.After considering the influence of the geometric distortion, the maximum deviation was reduced from 23.1 to 8.82%.This indicates that geometric distortion is an important factor affecting the resolution of the CTNR system.
4.2 Correction of the radiation noise
The effect of radiation noise can be regarded as an independent factor, considering the irregularity in the scattering of fast neutrons.When the effect of noise is considered, the total MTF can be calculated as:
where MTFToTis the total MTF value containing noise and MTFnis the MTF of the noise.
This was because the noise distribution was random.Equation 1 can be used to derive MTFn.Within a fixed imaging area, the number of samplings included in the area is n,

Table 5 Comparison of resolutions between experiment and the correction model considering geometric distortion

The gray value of the noise in an image is constant in a certain neutron radiography system.For single imaging,ImaxandIminare regarded as constants.Therefore,ng/(Imax+Imin)in Eq.(5) can be replaced by the constantr.Equation (11)can be simplified as:
Equation (12) shows that the proportion of noise directly affects the modulation of the image.The MTF was negatively correlated with the proportion of noise.Experimental verification of Eq.(12) has been performed in detail in the literature [32].
In this study, white spot noise parameters were extracted from the experimental images to correct the theoretical calculation results.First, the white spot noise was recognized according to the abnormal gray gradient from the experimental image in Fig.4.The average gray noise values and proportion of noise were calculated for each image.
Subsequently, MTFnfor each image was calculated using Eq.(12).Table 6 lists the corrected theoretical and experimental results.After considering both the effects of geometric distortion and radiation noise, the maximum deviation between the theoretical model and the original experimental results was reduced to 4.22%.A small systematic deviation between the revised theoretical model and the experimental values was still observed.This is mainly due to the interference of non-fixed device factors, such as neutron scattering by the experimental sample.
5 Conclusion
A significant deviation in the resolution between the experiment and the traditional theoretical resolution model was observed in a neutron radiography experiment performed by HFIPS.To explain this phenomenon, the effects of a lowL/Dratio and high-energy neutrons on imaging resolution were analyzed using Monte Carlo simulations.The results indicated that the deviation was primarily caused by geometric distortion and radiation noise.Additionally, through theoretical model optimization, the resolution deviation was effectively reduced by considering the imaging position andintroducing a noise factor.The following conclusions were drawn.

Table 6 Comparison of resolutions between experiment and corrected model considering geometric distortion and radiation noise
(1) When the imaging position is far from the imaging center, geometric distortion leads to the degradation of image resolution in the CTNR system.The geometric distortion becomes significant with a decrease inL/D.
(2) The optical diffusion response of the converter screen was not independent ofL/Dunder lowL/Dconditions.However, a change inδhas little effect on the resolution in a thin converter screen.
(3) The effect of nonthermal neutrons on the spatial resolution can be neglected in the CTNR system.However,the radiation noise induced by high-energy neutrons and secondary γ-rays will lead to a resolution degradation.
(4) Considering the effects of geometric distortion and radiation noise, the modified theoretical model agreed well with the experimental results.The maximum deviation decreased from 23.1 to 4.22%.
This study analyzed the factors affecting imaging resolution in a lowL/Denvironment, which is the main difference between the CTNR system and a traditional TNR system.Currently, resolution degradation caused by geometric distortion and radiation noise has not been fundamentally solved.The design improvement of the moderating collimator and performance optimization of imaging systems are key directions for future research.
Author contributionsAll authors contributed to the study conception and design.Material preparation, data collection and analysis were performed by Lian-Xin Zhang, Si-Ze Chen and Zao-Di Zhang.The first draft of the manuscript was written by Lian-Xin Zhang and all authors commented on previous versions of the manuscript.All authors read and approved the final manuscript.
Data availabilityThe data that support the findings of this study are openly available in Science Data Bank at https:// www.doi.org/ 10.57760/ scien cedb.j00186.00071 and http:// resol ve.pid21.cn/ 31253.11.scien cedb.j00186.00071.
Conflict of interestThe authors declare that they have no competing interests.
杂志排行
Nuclear Science and Techniques的其它文章
- GPU‑based cross‑platform Monte Carlo proton dose calculation engine in the framework of Taichi
- Simple synthesis of silver nanocluster composites AgNCs@PE‑g‑PAA by irradiation method and fluorescence detection of Cr3+
- Photonuclear production of nuclear isomers using bremsstrahlung induced by laser‑wakefield electrons
- High‑precision high‑voltage detuning system for HIAF‑SRing electron target
- Decomposition of fissile isotope antineutrino spectra using convolutional neural network
- Searching for QCD critical point with light nuclei
