A phenomenological model of the fundamental power coupler for a superconducting resonator
2023-07-11RanHuangYuanHe
Ran Huang ·Yuan He
Abstract In this study, a phenomenological model of the radio frequency (RF) behavior of a superconducting cavity fundamental power coupler is proposed by analyzing the simulation results of a transient beam-loading process in an extremely overcoupled superconducting cavity.Using this phenomenological model, the calculation of the transient reflected power from a superconducting cavity under beam loading can be mathematically simplified to algebraic operations without solving the differential equation governing the transient beam-loading process, while maintaining the calculation accuracy.Moreover, this phenomenological model can facilitate an intuitive understanding of the significant surge in the time evolution of reflected power from a superconducting cavity in certain beam-loading processes.The validity of this phenomenological model was carefully examined in various beam-loading processes and cavity conditions, and the method based on this phenomenological model was utilized in the transient RF analysis of the superconducting cavity system of the CAFe Linac, achieving satisfactory results.
Keywords Power coupler ·Reflected power ·Superconducting cavity ·Beam loading
1 Introduction
The calculation of the transient power reflected from a high-Q-value resonator under extreme over-coupling has practical significance in the field of microwave engineering because the excessive reflected power from this resonator under certain conditions may damage the radio frequency(RF) system.A superconducting RF cavity [1–3], adopted to accelerate the charged particle beams in an accelerator [4–6], is a typical high-Q-value resonator with intrinsicQ-values typically ≥ 108and loadedQ-values [7] usually ≥ 105due to the extremely low RF power loss in the cavity wall owing to the superconductivity of niobium [8,9] at ultra-low temperatures [10].Unlike a normal conducting cavity with a loadedQ-value, typically in the order of 103and near critical coupling, the transient power reflected from a superconducting cavity in certain beam-loading processes can attain values several times larger than the RF generator forward power [11], thus having a high potential to damage the RF power system, particularly the circulator,which is usually designed to withstand as large as the forward generator power considering a full reflection situation.Therefore, it is critical to calculate the time evolution of the reflected power from a superconducting cavity during various transient beam-loading processes to provide the necessary information for the design of an RF power system and a machine protection system [12]; the latter one can prevent the RF power system of an accelerator from being accidentally damaged and increase its availability.In existing calculation methods [13, 14], the transient power reflected from a superconducting cavity under beam loading can only be obtained by analytically or numerically solving the differential equation governing the transient beam-loading process inside the cavity, which is relatively complicated and can be time-consuming.For certain specific requirements, such as designing a high-level RF system concerning the RF power waveguide or the circulator between an RF power generator and a superconducting cavity, the transient power reflected from the superconducting cavity in various processes is the RF quantity of interest, instead of the time evolution of the RF fields inside the cavity [15–17]; the analysis for the latter one is usually performed by low-level RF system engineering [18–20].Therefore, a method to directly calculate the reflected power without numerically solving the beamloading differential equations was researched.In this study,we reported a method based on a novel phenomenological model of a fundamental power coupler to fulfill the aforementioned goal, which has been facilitating the transient RF analysis of the superconducting cavity system of the CAFe Linac [21–23].Thus, a phenomenological model of RF behavior of the fundamental power coupler [24] for a superconducting cavity under heavy beam loading was obtained by investigating the simulation results of a superconducting cavity in a transient beam-loading process without directly analyzing the corresponding differential equations governing such a process.Heavy beam loading refers to the case where the beam power is several orders of magnitude larger than the RF power loss in the superconducting cavity wall.Using this phenomenological model, the transient power reflected from a superconducting cavity can be converted into algebraic operations without solving the related differential equations.To verify its validity, the transient reflected power in several beam-loading processes was evaluated using the proposed model, and the results are compared with those obtained with the numerical method needing to solve the related differential equations.Moreover, the phenomenological model can analytically deduce the maximum transient reflected power during a superconducting cavity failure recovery process in an extremely high-availability accelerator, such as the one used for the accelerator-driven sub-critical system (ADS) application.
2 Existing calculation method and result analysis
2.1 Mathematical model on transient beam loading
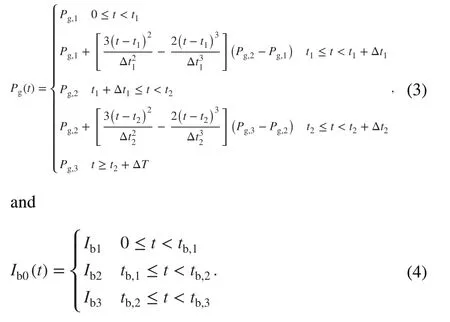
In the conventional calculation method, it is necessary to solve the following equations governing the transient beamloading process analytically or numerically to obtain the transient power reflectedPr(t) from a superconducting cavity under the Gaussian bunched beam loading [25]:
where 퐢 is the imaginary unit,⇀Vc(t)=Vc(t)exp[퐢⋅φ(t)] is the phasor of the cavity voltage without the transit time factorTtf;ω,ω0.5, and Δω=ω−ω0are the angular frequency, loaded half bandwidth, and detuning of the cavity,respectively.rcandr∕Qare the intrinsic shunt impedance androverQof the cavity withoutTtf, respectively;βis the coupling factor,Pg(t) is the forward generator power,θ(t) is the phase of the effective driven current from the generator,Ib0(t) is the time-averaged DC beam current, andφ0.5=ωσtis the half phase width of the Gaussian bunch (the effect of the beam current intensity on the bunch length is neglected here).
It can be mathematically proven that⇀Vc(t) can be analytically solved using the Laplace transformation method when the time evolutions ofPg(t) andIb0(t) in Eq.(1) conform to Eqs.(3) and (4), respectively, which is sufficient to describe a typical beam-loading process in a superconducting cavity [25]:
Substituting the resultant⇀Vc(t) into Eq.(2),Pr(t) can therefore be analytically obtained.
2.2 Simulation result and analysis
The designed RF parameters of the HWR010 [26] and RF power generator of CAFe Linac, along with the designed beam parameters, are listed in Table 1; the transient beam-loading process can be simulated using these parameters and Eqs.(1)–(4).
The time evolution of the generator power and beam current in this process is shown in Fig.1a.Att0=0 , the generator is powered up at 6.7 kW, and the cavity field buildup process begins.Att1=ΔT, the continuous-wave(CW) proton beam began injecting at the designed current of 10 mA as the cavity field reached a certain steady state I with an amplitude of 1.72 MV and phase of zero.Owing to the beam-loading effects, the field in the cavity evolved to steady state II with an amplitude of 1.00 MV and phase of –29.8°.Att2=2ΔT, the generator power was suddenly shut down and the beam continued passing through the cavity at 10 mA current, which is typical for a Linac used for ADS application to avoid a thermal shock to the reactor core due to the beam trip.This resulted in steady state III with a cavity field amplitude of 0.987 MV and phase of − 150°.Att3=3ΔT, the generator power was recovered to 6.7 kW, and the field in the cavity restored to steady state II.During the entire process, the detuning angle of the cavity Ψ maintained its optimum value for stage II with the designed beam current intensity, which is as follows:
In the simulation, we used ΔT≈8τto ensure that the cavity fields can reach the corresponding steady state at each stage.Figure 1b-f presents the time evolution of the trace of the cavity voltage on the complex plane, cavity voltage amplitude, phase, reflected power, and kinetic energy gain of the central particle in a beam bunch, respectively.The simulation results shown in Fig.1 were analyzed to obtain a phenomenological model of the fundamental power coupler for a superconducting cavity.

Table 1 RF and Beam Parameters for the evaluation
Figure 1c demonstrates that the amplitude of the cavity voltage in steady state III is the same as that at steady state II.


This indicates that the amplitude of the beam-inducing voltage is the same as that of the cavity voltage produced by the generator along with the beam, which is the case for a superconducting cavity under optimum coupling and detuning [13].
As shown in Fig.1d, although the cavity voltage amplitudes at steady states II and III are identical, there is a difference of 2π∕3 in their phases, which results in the deceleration of the beam at steady state III, as shown in Fig.1f.This can be explained through the conservation of energy principle, where the field in the cavity is induced solely by the beam in this state.In addition, Fig.1e indicates that the reflected powers at steady states II and III are significantly different.At steady state II, the optimum detuning and coupling of the cavity ensure zero-power reflection, whereas at steady state III, the cavity functions as a klystron, where the beam power is drawn out by the cavity and radiates to the waveguide through the coupler.Note the transient reflected power is three times as large as the generator forward power att3=3ΔTwhen the generator power is recovered.The excessive reflection power is due to the change in the stored energy inside the cavity, which corresponds to the last term in Eq.(2).
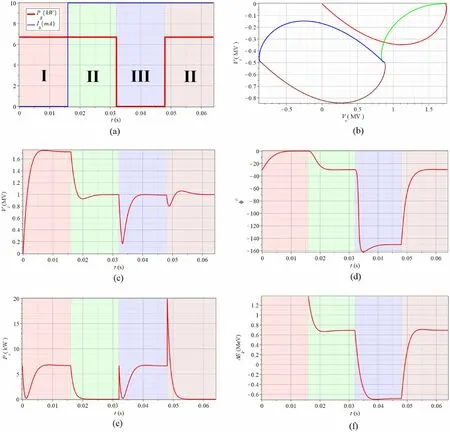
Fig.1 (Color online) A superconducting cavity transient beam-loading process.a Generator Power and Beam Current.b Trace of the Cavity Voltage.c Amplitude of the Cavity Voltage.d Phase of the Cavity Voltage.e Reflected Power of the Cavity.f Energy Gain of the Central Particle
3 Relationship between the voltage waves in the waveguide
3.1 Amplitude relationship between the voltage waves
According to the terminology of microwave engineering[27], the reflected power from the cavityPr(t) in the previous sections is termed as “backward power in the waveguide”and is referred to as “backward power”for conciseness in the following sections.Meanwhile, to maintain brevity, the symbolais used to denote the amplitude of a phasor⇀a, that is
According to the theory of transmission lines, the traveling wave power in a waveguide can be expressed by the amplitude of the normalized equivalent voltage wavevas follows [28]:

In the following analysis, the normalized equivalent voltage wave amplitudevthat was determined using Eq.(12) is termed “voltage wave”for brevity.
The backward voltage wave (“backward wave”)in the waveguide comprises the following two components:


This indicates that the reflected and radiated waves had the exact same amplitudes and opposite phases at steady state II.
The amplitude of the cavity voltage at steady state III is equal to that at steady state II; note thatve∝vc; therefore,the following can be obtained:

with the following relationships:
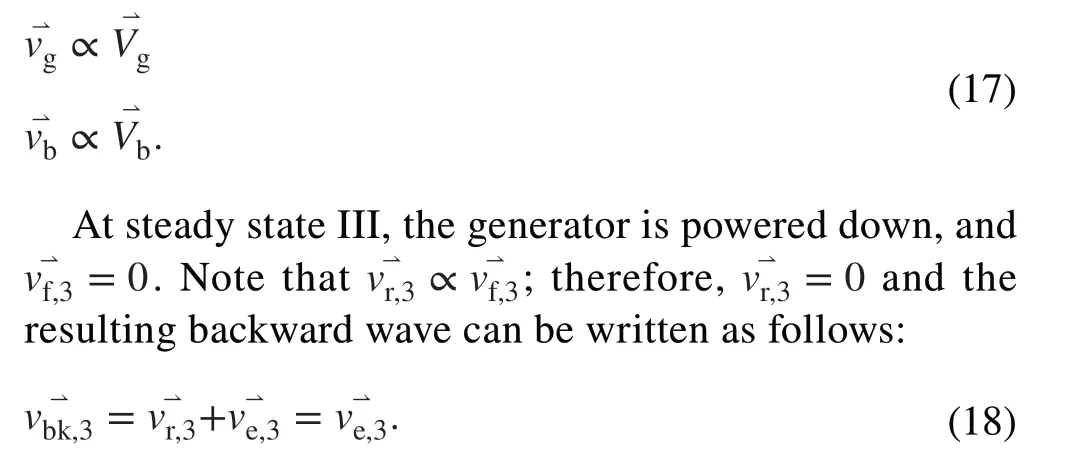
Figure 1e demonstrates that the backward power at steady state III is equal to that at steady state I, indicating that the amplitudes of the corresponding backward waves should be identical:
Note there is no beam in the cavity at steady state I due to the extreme over-coupling of the cavity (β ≫1 ), and the reflection coefficient of the cavity is⇀Γ →1 ; therefore, the following can be obtained:
The forward power from the generator remains constant at steady states I and II:
Using Eqs.(14)–(21), the following amplitude relationship can be deduced:
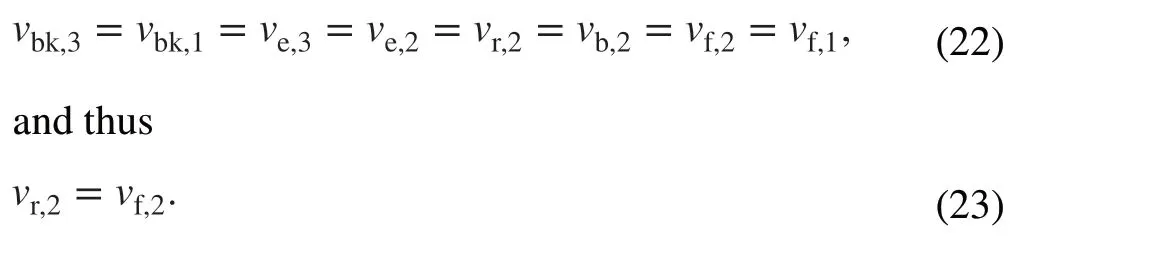
This indicates that the amplitude of the wave directly reflected from the forward wave at the coupler is exactly equal to the amplitude of the forward wave at steady state II.In simple terms, the forward wave is fully reflected by the coupler.
The proportion of the forward wave reflected directly from the coupler is determined by the geometric structure of the coupler alone, which corresponds to the coupling factorβ.Therefore, ifβis fixed, the proportion of the forward wave directly reflected by a certain coupler should also be fixed.Note thatβremains constant throughout the entire process;therefore, the following is obtained:
This indicates that the forward wave is fully reflected at the coupler during the entire process.
3.2 Phase relationship between the voltage waves
Using the above expression with Eqs.(25), (26), and (35),the phasor relationship diagram of the various voltage waves in the waveguide can be obtained as shown in Fig.2.
Substituting Eqs.(26), (35) and (37) into Eq.(16) with the phase relationships at steady state II in Eqs.(5) and (30)to solve the resultant equation obtainsve,1=2vf,2cosψ,which is then substituted into Eq.(36) to obtain the following equation:


Fig.2 Phasor relationship diagram of the voltage waves in the waveguide
4 Modeling the RF behavior of the fundamental power coupler
4.1 Reflected wave and generator‑induced radiated wave
Generalization of Eqs.(25) and (40), assuming that they are always true for a fundamental power coupler in the case of extreme over-coupling, can be expressed as follows:
Equation (41) indicates that the forward wave from the generator is always completely reflected by the coupler.Using Eq.(12), Eq.(41) can be rewritten as follows:
4.2 Beam‑induced radiated wave
To calculate the transient backward power in the waveguide,it is necessary to generalize Eq.(38).To simplify the problem, the case where the field in the cavity is induced solely by the beam was analyzed to obtain the general expression for the beam-induced radiated wave, because the field in the cavity satisfies the principle of linear superposition.
When the field in the cavity is induced solely by the beam, the power radiating from the cavity through the coupler can be obtained using Eqs.(16) and (11) as follows:

Fig.3 (Color online) Time evolution of the amplitude of the beaminduced voltage
Meanwhile, the corresponding coupling factorβcan be expressed as follows:
To deduce the relationship betweenVbandβ, a transient beam-loading process is simulated with Eqs.(1)–(4) for different values ofβ.Att0=0 , the CW beam injection begins and the field in the cavity is solely induced by the beam.The field in the cavity reaches a steady state after a sufficiently prolonged time and the detuning angle of the cavity remains constant throughout the entire process.The simulation result of the time evolution of the amplitude of the beam-induced voltage in this process is shown in Fig.3, whereVbis the amplitude of the steady state beam-induced voltage corresponding to the coupling factorβ0.
Based on Fig.3, the steady-state value ofVbconforms toVb∝β−1.Using Eqs.(46) and (47) the following is obtained:
Note thatvb,2is for the optimum detuning and coupling;therefore, the general expression forvbis as follows:

Substituting Eq.(38) into the above expression results in the following:
Using the following relationships in an extreme overcoupling superconducting cavity [14],

4.3 Phenomenological model of the fundamental power coupler
Using Eqs.(42), (43), and (53), the steady-state phenomenological model of the fundamental power coupler for a superconducting cavity with the Gaussian bunched beam loading is formulated as follows:
By replacing the beamform factor exp(−Δ/2) in Eq.(53) with the corresponding equation, the phenomenological model of the coupler for other statistical distributions of the beam bunch can be readily obtained.For cases where the beam consists of short bunches, the beam form factor can be simply approximated as 1.In a case without beam loading, substitutingIb0=0 into Eq.(53) obtains=0 , and the phenomenological model of the coupler is further simplified.
Using Eqs.(13), (16), and (11), the backward wave is obtained as follows:
Note that Eqs.(3) and (4) requirePg(t) andIb0(t) keeping constant for a short duration which is much larger than the cavity time constant after each time of their variations.
IfPg(t) andIb0(t) can be approximated to be constant during a short duration after each time of their variations,and while accounting for the cavity detuning Δωand cavity filling process characterized by the cavity time constantτ,a complex detuning attenuation factor⇀A(t) can be obtained as follows:
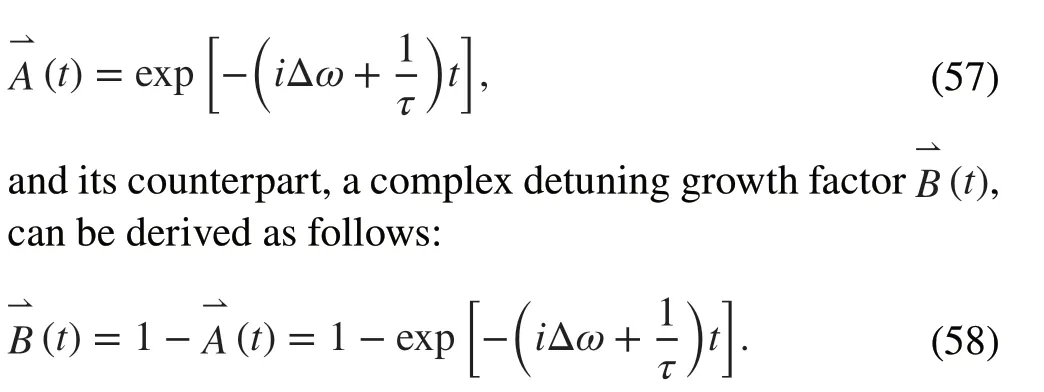
The transient-state phenomenological model of the fundamental power coupler can be obtained by multiplying the corresponding factor to each expression in Eq.(54), with which the transient power reflected from the superconducting cavity in various beam-loading processes can be easily calculated using algebraic operations.
Using the phenomenological model of the fundamental power coupler formulated by Eqs.(54)–(58), the calculation of the transient power reflected from a superconducting cavity is converted from the cavity-side of the generator–coupler–cavity system to the generator-side,thus eliminating the complexity involved in the time evolution of the cavity fields during the beam-loading process.Therefore, this phenomenological model can significantly simplify the calculation.
5 Verification and application of the phenomenological model
5.1 Transient beam‑loading process A
To validate the phenomenological model of the coupler, the time evolution of the reflected power from the superconducting cavity during the transient beam-loading process from Sect.2 was recalculated using the phenomenological model of the fundamental power coupler that was formulated using Eqs.(54)–(58).The following process exemplifies the procedure for calculating the transient reflected power from the cavity using this phenomenological model.


The transient reflected power in each stage ofPr,k(t)(k=1…4 ) can be obtained by substituting the expression of each voltage wave in each stage of Eqs.(59)–(70) into Eq.(55) and further into Eq.(56).The time evolution of the reflected power from the cavity,Pr(t) , during the entire process can be obtained by splicingPr,k(t) according to the time sequence.By substituting the parameters listed in Table 1 into the resulting piecewise analytical expression forPr(t) , the resulting time evolution ofPr(t) is indicated by the yellow curve shown in Fig.4.To verify this result,the time evolution ofPr(t) obtained using Eqs.(1)–(4) is indicated by the red curves as a comparison.The thinner yellow curve is plotted above the thicker red curve; if the difference between the two results is sufficiently small,the yellow curve should be enclosed by the red curve, that is, the compound curve consisting of the red and yellow curves should have a closed red boundary.The red boundary of the compound curve is open only at one location where the sharp peak reaches its maximum; the relative difference between the two curves is only 1.91%.
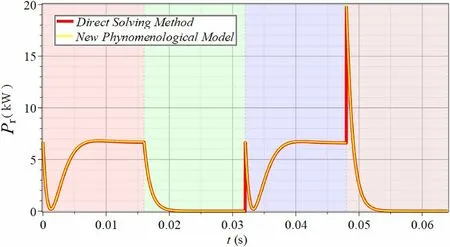
Fig.4 (Color online) Transient reflected power in process A

Fig.5 (Color online) Time evolution of the generator power and beam current in process B
5.2 Transient beam‑loading process B
To further verify the phenomenological model, the reflected power was calculated in a more complex transient beam-loading process using Eqs.(54)–(58) under the time evolution of the generator power and beam current intensity, which is shown in Fig.5.The calculation verifies where the cavity largely detunes causing a complicated trace of the cavity voltage on the complex plane.However,under real-world conditions, the likelihood of such a transient beam-loading process occurring is a low.In contrast to the previous transient beam-loading process A, the time evolution of the generator power and beam current in this process varied between two nonzero values.
The following calculation consists of two situations depending on the conditions of the cavity detuning and coupling.
5.2.1 Cavity Condition I
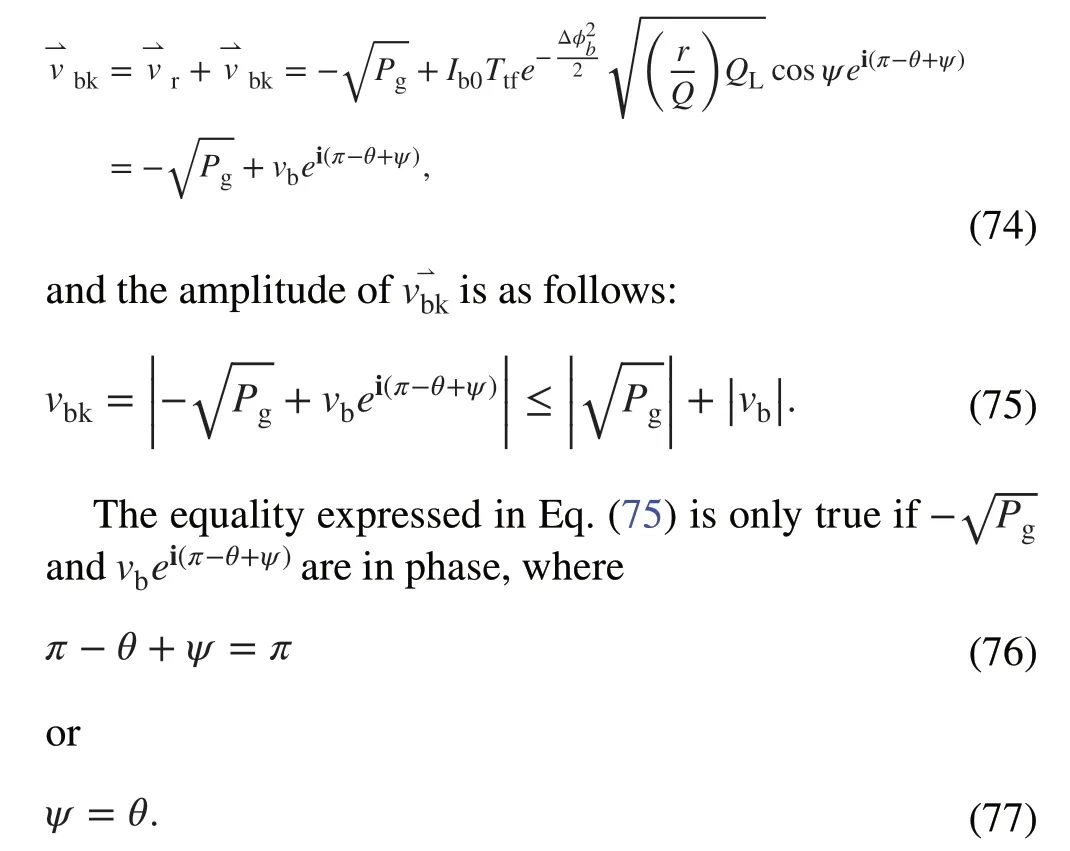
The cavity significantly deviates from its optimum detuning and coupling for the designed beam current in stage II,presenting a cavity detuning angleψ=2ψopt=π∕3 and cavity coupling factor≈653 during the entire beam-loading process.Att0=0 , the generator is powered up at 6.7 kW and the cavity field buildup process begins.Att1=ΔT, the CW proton beam at the designed current of 10 mA is injected as the field in the cavity reaches a certain steady state I with an amplitude of 1.10 MV and phase 30.6º.Owing to the beam-loading effects, the field in the cavity evolves to the steady state II with an amplitude of 0.61 MV and phase of − 5.28º.Att2=2ΔT, the generator power suddenly shuts down and the beam continues to pass through the cavity at a current of 3.33 mA, which is 1/3 of the designed beam current, resulting in steady state III of the cavity field with an amplitude of 0.417 MV and phase of 13.4º.Att3=3ΔT, the generator power is partially recovered to 5.36 kW, and the field in the cavity evolves to the final steady state IV with an amplitude of 0.790 MV and phase of 21.6º.The corresponding trace of the cavity voltage on the complex plane during the entire beam-loading process is shown in Fig.6a; the trace form is significantly different than that shown in Fig.1b, where the cavity is under optimum detuning and coupling for the designed beam current at stage II.


Fig.6 (Color online) Trace of the cavity voltage and transient reflected power: a and b demonstrate moderate detuning, whereas c and d demonstrate extreme detuning

By substituting the parameters listed in Table 1 to evaluatePr(t) , the resulting curve is shown in yellow in Fig.6b,whereas the red curve is obtained by directly solving Eqs.(1)–(4).The figure demonstrates that the red boundary of the compound curve is closed during the entire beam-loading process, implying that the transient reflected powers from the cavity obtained by the two methods show sufficient agreement.
5.2.2 Cavity Condition II
The cavity is at extreme detuning with the detuning angleψ= 7π/15, which approaches π/2 and significantly deviates from the optimum coupling for the designed beam current at stage II with the cavity coupling factorduring the entire beam-loading process.Owing to the extreme detuning of the cavity, the corresponding trace of the cavity voltage on the complex plane in this process becomes significantly more complicated than that in all the previous situations, as shown in Fig.6c.By substituting the parameters listed in Table 1 to evaluatePr(t) , the resulting curve is shown in yellow in Fig.6d, whereas the red curve is obtained via the direct solution of Eqs.(1)–(4).The red boundary of the compound curve is closed during the entire process, indicating that the transient reflected power from the cavity obtained by the two methods is in sufficient agreement, despite extreme cavity detuning.Note that the commonly used conventional method for numerically solving Eqs.(1) and (2) would be significantly time-consuming when dealing with the beam-loading process with a cavity detuning angle that is approachingπ/2, as in this case.
Additional comparisons for various beam-loading processes and cavity conditions were conducted between the transient reflected power obtained from the phenomenological model using the formulated Eqs.(54)–(58) and that obtained by numerically solving Eqs.(1) and (2); the results were in sufficient conformance with each other as long as the cavity was extremely over-coupled.
5.2.2.1 Maximum reflected power during the cavity failure recovery processAs shown in Fig.2, the peak of the transient reflected power occurs when the generator power is recovered while the beam continues to pass through the cavity during the period without the RF power feed from the generator, which is a realistic situation that occurs in an accelerator requiring an ultra-high beam availability, such as that in the CAFe Linac.The generator power driving the superconducting cavity is instantly cut off by the machine protection system to protect the cavity when the cavity quenches; thus, the trend of quenching is presented, or the instability of the cavity fields is detected.The generator power is restored after the problem of the cavity is resolved while the beam continues to pass through the cavity during the entire process.A technique for cavity failure recovery is currently under development for the CAFe Linac to ensure that its beam availability can eventually meet the ultra-high demand of beam availability for the ADS application.Therefore, for such accelerators, it is critical to calculate the maximum reflected power during a cavity failure recovery process to provide indispensable information for the design of relevant parts of an RF system.By applying the phenomenological model formulated by Eqs.(54)–(58), this maximum value can be deduced without the specific parameters of the accelerator.
At the moment when the generator power is recovered,⇀Vg=0 , and based on Eq.(17),⇀vg=0 ; therefore, the backward wave can be expressed using Eqs.(54) and (55) as follows:
For a superconducting cavity accelerating CW or long macro-pulse beam, the cavity is usually optimally detuned to minimize the required RF power from the generator, and using the first equation in Eq.(52), the following is obtained:
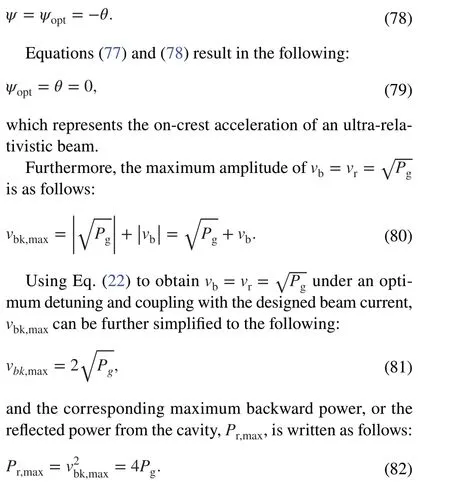
This indicates that the upper limit of the transient reflected power during the cavity failure recovery process is four times that of the forward generator power for a superconducting cavity under optimum detuning and coupling to the acceleration of the beam at the designed current.Therefore, the design of the relevant parts of an RF system should incorporate a transient power surge five times (including a one-time contribution from the forward generator power)that of the forward generator power to ensure the safety of the instrument under such conditions.
6 Conclusion
Using the phenomenological model of the RF behavior of the fundamental power coupler formulated using Eqs.(54)–(58), the mathematical calculations for the evaluation of the transient power reflected from a superconducting cavity in the presence of beam loading can eventually be converted to algebraic operations without solving the relevant differential equation numerically.This can be done while maintaining the calculation accuracy, which signifies the vast simplification of the conventional calculation process and significant reduction in the computational time, especially in the early design stage of parameter optimization.Moreover, for the beam-loading process,the difference between the theoretical results predicted by solving Eqs.(1)–(2) and the corresponding experimental values can typically reach 5%, which is larger than the difference in the results from the phenomenological model and directly solving the corresponding differential equation, indicating that the phenomenological model is sufficient to predict the transient reflected power in such a process.
Meanwhile, the simple and vivid physical demonstration provided by this phenomenological model can facilitate an intuitive understanding of the time evolution of the reflected power from the superconducting cavity in various transient beam-loading processes, especially the significant surge in the reflected power during a certain beam-loading process, such as that simulated in Sect.2.To a certain extent, the phenomenological model can be regarded as an extension of the classical transmission line theory of microwave engineering, where a radiated wave emerging from an extremely over-coupled active microwave impedance is introduced under the circumstance of the superconducting acceleration.
Note that by using a simple beam-loading process to deduce the phenomenological model, the model may appear to be valid only for the beam-loading process with a simple time evolution of the generator power and beam current intensity.However, the model can be validated for any transient beam-loading process because the time evolution of excitations described by an arbitrary continuous curve can always be approximately described by a staircase-like polygonal curve similar to Eq.(3), where a piecewise function with more nodes is required to approximate the original curve for the time evolution of a more complex excitation.For each stage of the piecewise function, the duration needn’t to be significantly longer than the cavity time constant to reach the corresponding steady state; instead, it can be significantly shorter than the cavity time constant to describe a notably more rapid process.
The method reported in this study based on the phenomenological model of the RF behavior of the fundamental power coupler was successfully utilized in the transient RF analysis of the superconducting cavity system of the CAFe Linac over the past several years and has achieved satisfactory results, while vastly simplifying the calculation process and significantly reducing the computational time.
Conflict of interestYuan He is an editorial board member for Nuclear Science and Techniques and was not involved in the editorial review,or the decision to publish this article.All authors declare that there are no competing interests.
杂志排行

Nuclear Science and Techniques的其它文章
- GPU‑based cross‑platform Monte Carlo proton dose calculation engine in the framework of Taichi
- Photonuclear production of nuclear isomers using bremsstrahlung induced by laser‑wakefield electrons
- High‑precision high‑voltage detuning system for HIAF‑SRing electron target
- Resolution analysis of thermal neutron radiography based on accelerator‑driven compact neutron source
- Decomposition of fissile isotope antineutrino spectra using convolutional neural network
- Searching for QCD critical point with light nuclei