A characterization study on perovskite X‑ray detector performance based on a digital radiography system
2023-07-11YangWangQiongZhang
Yang Wang ·Qiong Zhang
Abstract X-ray imaging technologies such as digital radiography (DR), is an important aspect of modern non-destructive testing and medical diagnosis.Innovative flexible X-ray detector technologies have recently been proposed and are now receiving increasing attention owing to their superior material flexibility compared with traditional flat-panel detectors.This work aims to study these innovative flexible X-ray detectors in terms of their effectiveness in DR imaging, such as detection efficiency and spatial resolution.To achieve this goal, first, a Monte Carlo model was developed and calibrated to an in-lab 150 kV DR imaging system containing a flat-panel X-ray detector.Second, the validated model was updated with various types of flexible X-ray detectors to assess their performance in nearly realistic conditions.Key parameters such as the detection efficiency pertaining to the crystal material and thickness were studied and analyzed across a broader energy range up to 662 keV.Finally, the imaging performance of the different detectors was evaluated and compared to that of the flat-panel detector in the 150 kV DR imaging system.The results show that the flexible detectors such as the CsPbBr3 crystal detector deliver promising performance in X-ray imaging and can be applied to a wider range of application scenarios, especially those requiring accurate detection at challenging angles.
Keywords Flexible X-ray detector ·DR imaging system ·Monte Carlo simulation
1 Introduction
In recent years, the rapid development of advanced manufacturing has led to a significant increase in the demand for advanced non-destructive testing (NDT).Among NDT methods, digital radiography (DR) has become an important technique with many applications [1].DR technology provides a way to visualize the interior of opaque objects,which facilitates effective non-destructive analysis of internal components that cannot be detected by the naked eye.During this process, X-rays are absorbed or scattered through photoelectric absorption, Compton scattering, and Rayleigh scattering.The attenuated X-rays are then captured by the detector and transformed into images with different grayscale contrasts.The X-ray intensity is determined by the density and atomic number of the attenuation material [2].The intensity transmission equation is as follows:
whereIandI0represent the transmitted and incident X-ray intensities, respectively, andμiandxiare the linear attenuation coefficient and thickness, respectively, of theith medium interacting with the X-ray.
When attenuated X-rays reach the detector and interact with it, the counting efficiency is largely determined by detector characteristics such as material density, atomic number, detector shape, and size.These important parameters are commonly employed as criteria to evaluate detector performance when identifying materials for developing new detectors.In the past decade, flat-panel detectors have become one of the most common types of devices used in X-ray imaging.There are two categories of flat-panel detectors: direct conversion and indirect conversion.The direct conversion type converts incident X-ray energy into electronic charge with no intermediate step, whereas the indirect conversion type uses a phosphor to convert X-rays into optical photons and then into electronic charge using photodiodes [3].Indirect flat-panel detectors are typically manufactured by integrating thin film transistor (TFT)arrays, amorphous silicon photoelectric conversion layers,and crystals such as NaI, CsI, and Bi4Ge3O12(BGO) [4].In the medical industry, X-ray CT and PET scanners are generally formed by assembling multiple sets of flat-panel detectors into the shape of an arc or a 360-degree ring capable of providing imaging capabilities from different angles.However, significant installation space is required, which severely restricts the application scenarios [5].Therefore,detectors that are naturally flexible could open the door to new possibilities, such as the imaging of curved and irregular objects with small dimensions [6].
Over the last three years, researchers have focused on developing innovative materials with high absorptivity and sensitivity to X-rays.Among them, perovskite-based flexible detectors are receiving increasing attention from researchers because of their superior light sensitivity and structural flexibility.While most studies have focused on direct conversion,such as the semiconducting nature of perovskite detectors,few studies have been conducted on indirect conversion, also known as scintillating features.One of the most promising features of perovskite scintillators is the feasibility of combining them with flexible substrates, such as polyimide, thus facilitating the fabrication of flexible photon detectors.This phenomenon has attracted the attention of multiple researchers.For example, Yang et al.developed a new type of large CsPbBr3film with good photoelectric and electrical properties [7].Guo reported a highly stable, flexible X-ray detector based on a Cs2TeI6thin film that obtained clear X-ray images of objects with different materials and densities [8].Ciavatti proposed a perovskite-based flexible detector with high sensitivity, which can provide a basis for subsequent manufacturing applications [9].Meanwhile, in-lab experiments have shown that these detectors have promising potential for enhancing X-ray detection efficiency.More recently,special attention has been paid to the application of flexible X-ray detectors in medical imaging, safety, and industrial detection owing to their adaptability and operability under non-planar and confined conditions [10].Perovskite crystals can be combined with flexible substrates such as polyimide because of their excellent ductility [11], which facilitates the fabrication of flexible detectors.However, this is not possible when conventional crystals are used.For example, NaI is typically implemented on a rigid glass substrate because of its brittleness [12].
Generic sketches of flat and flexible detectors are shown in Fig.1 for comparison, and a geometrical example is presented in Fig.2 to visualize the imaging results under different bending angles of a flexible detector.When the bending angle of the detector is close to or coincides with the angle of the object, an image containing all the defect projections can be obtained.Otherwise, the detected image contains only a part of the area of the measured object, as is the case for a flat-panel detector.Owing to the adaptability of a flexible detector, it can reduce the image distortion of curved surfaces because it can fit the target accurately with uniform X-ray illumination and imaging contrast.Additionally, a flexible detector can capture more features than a rigid detector with the same effective imaging area [13].
Although most studies on these innovative flexible detectors have focused on material development or manufacturing processes, few have investigated their X-ray imagingabilities [14–16].It is worth mentioning that because current research on flexible detectors is still largely in the laboratory development stage, it is unrealistic to carry out precise imaging experiments based on actual flexible detectors.Consequently, these studies lack analyses of the efficiency response, such as the spectrum and image, under changes in detector characteristics.For simple geometries, such an analysis might be carried out analytically.However, in realistic cases where complex geometries are involved, key detector characteristics such as peak efficiency can no longer be calculated analytically [17].Instead, the Monte Carlo method can be employed to obtain accurate detector responses in complicated scenarios, as demonstrated in previous work[18, 19].

Fig.1 (Color online) Detector structure sketches: a flat-panel glass substrate; b flexible polyimide substrate

Fig.2 (1) Vertical view imaging model with five identical defects.The defect dimensions are 15 mm (length) × 4 mm (width) × 5 mm (depth);(2) Different bending angles of the same detector; (3) Images obtained at the corresponding bending angles
In this study, Monte Carlo simulation was employed as the primary tool to explore the characteristics of flexible detectors.A Monte Carlo model was developed to represent an inlab DR imaging system that includes a CsI flat-panel detector and was calibrated to experimental data.Based on the model,the performance of various types of flexible detectors were evaluated by updating the detector features in the model.This report includes the following sections: Sect.2 reports the benchmarks of a Monte Carlo modeled 150 kV DR imaging system for measurement, which enables the verified model to be employed for the following simulations.Section 3 studies the characteristics of flexible detectors in two aspects: (1) key parameters, such as detection efficiency pertaining to material and thickness, are studied and analyzed for a wide energy range up to 662 keV; (2) based on the modeled 150 kV DR imaging system, the spatial resolution and imaging quality of different detectors are explored to assess the feasibility of utilizing flexible detectors in real-world scenarios.
2 Development of a Monte Carlo model based on in‑lab DR imaging system
In this section, we report the development of a Monte Carlo model using the toolkit Geant4.10.06 to simulate the DR imaging process [20–22].The model consisted of an X-ray tube,a flat-panel detector, and one test object with four calibrated defects, the composition of which is shown in Table 1.The defects were formed from uniform depressions at different depths, the details of which are listed in Table 2.The X-ray spectrum was extracted from the IPEM78 Catalogue Report[23], in which the anode angle of the tube was 65° and the filtration was composed of 1 mm beryllium, 0.7 mm aluminum and 1.5 mm glass layers.The simulated spectrum obtained using these parameters matches the measured spectrum.The detector pixel resolution was modeled to be identical to that of the in-lab detector.

Table 1 Test object composition

Table 2 Detailed dimensions of four-defect sample

Fig.3 (Color online) DR imaging system setup

Table 3 Geometrical setup of simulation and experiment

Table 4 Detector composition of DR imaging system and Geant4 simulation
The DR imaging system setup is shown in Fig.3 and Table 3.The X-ray tube generates an X-ray spectrum in the voltage range of 50–150 kV with a maximum current of 3 mA.The focal spot size is 0.8 mm × 0.8 mm and the radiation angle is 80° × 100°.The flat-panel detector used was the UNI528 model from Shanghai Guanyu Testing Technology Co., Ltd.(Shanghai, China).It is composed of CsI crystal, an array of α-Si:H thin-film transistors (TFT), and a glass substrate.Its dimensions are 35 cm × 43 cm × 1.5 cm.The detector corresponds to a pixel matrix of 3534 × 4302, and the pixel size is 99 μm.Details of the dimensions and compositions are presented in Tables 3 and 4.As shown in Fig.4, the Geant4-based DR imaging system was modeled using the same parameters as those used for the measurement.It is worth mentioning that the simulated pixel matrix was set to 1800 × 1000, which corresponds to the 178.2 mm × 99 mm detection area (as shown in Table 4), which is sufficient to maintain the necessary accuracy without sacrificing simulation efficiency when simulating the designated test object, and the detector dimensions were adjusted accordingly in the model.

Fig.4 (Color online) Test object modeled using Geant4: a X-ray imaging process; b flatpanel detector (including glass substrate, α-Si:H thin-film transistors and crystal); c test object with four defects; d Simulated image of the test object

Fig.5 Variance of the variance (VOV) of pixels in the midpoint row(140th)
A total of 1011photons were simulated using Monte Carlo simulations to ensure that the required level of statistical accuracy was reached, given that the Monte Carlo simulations converge at 1010photons, as shown in Fig.5.This also enabled a fair comparison between the simulation and experiment.The energy deposition in each pixel was normalized to 0–255 grayscale to ensure consistency with reality, as shown in Fig.6.The energy spectrum extracted from the IPEM78 Catalogue Report was simulated using the Monte Carlo method, and the spectrum was estimated from 0 to 150 keV in 1-keV-wide groups.Based on the fluence recorded for each group, the entrance air kerma was calculated using the X-ray fluence-to-air kerma conversion coefficients [24, 25], as shown in Eq.(2):
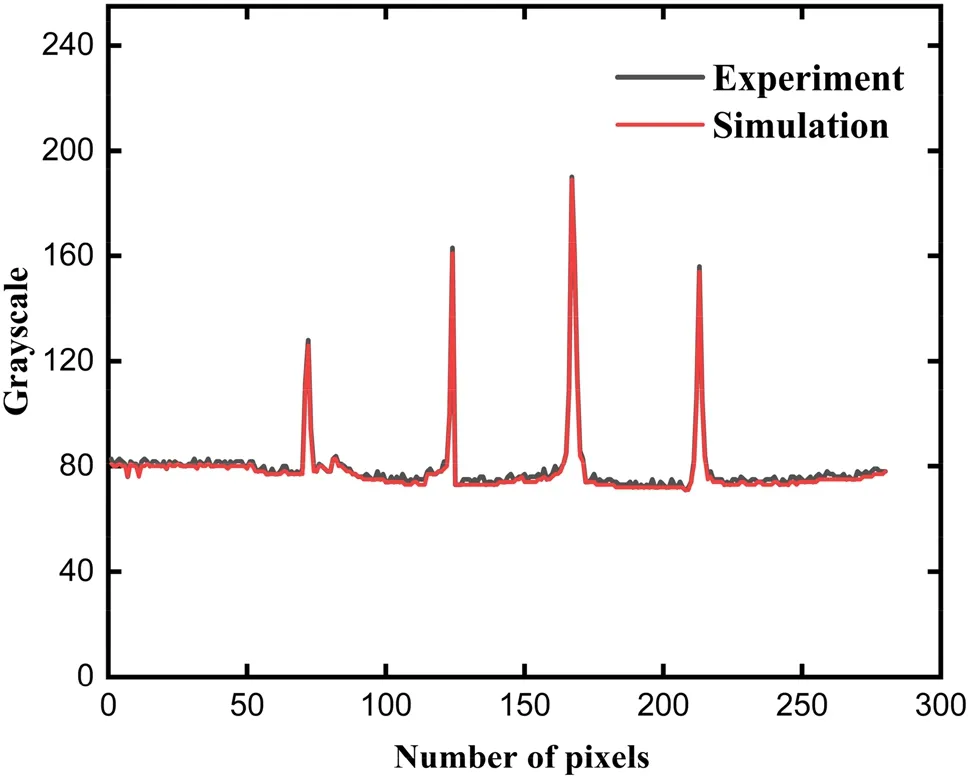
Fig.6 Grayscale profile representing four defects (140th row from test object image)
whereKais the air kerma calculated based on the Monte Carlo simulation, Φ(E) is the fluence related to the energy spectrum, andka(E) is the fluence-to-air kerma conversion coefficient.The air kerma estimated from the Monte Carlo simulation was 16.59 mGy.
For the measurement, the current and time were adjusted under a 150 kV tube voltage.Given that the dose rate measured by the manufacturer at 1 m from the tube is 3 mGy/h,it could be calculated that when the current and time were adjusted to 2 mAs, the air kerma value at 0.597 m from the tube was 16.67 mGy, and therefore the measurement matched the simulation.
wherexiis the score of theith sample,−xis the mean value,andNis the recorded number.
Three image similarity indicators, root mean square error(RMSE), mean absolute error (MAE), and structural similarity (SSIM), were employed to compare the simulation and experiment.The indicator equations and results are presented in Table 5.
3 Performance evaluation of flexible detector
In this section, two conventional crystals (NaI and CsI)and two flexible detector candidate crystals (CsPbBr3and Cs2TeI6) are selected, and spectral and imaging analyses were conducted separately under different energy ranges.In Sect.3.1, the detection efficiency of the selected crystals is evaluated using the total efficiency and peak-to-total ratio through a Monte Carlo simulation.The source energy was modeled up to 662 keV to provide a complete picture of each detector’s spectral behavior from the X-ray to gamma energy range.As described in Sect.3.2, to further assess the image quality, the four types of detector crystals were implemented in the previously validated DR imaging system model and images were obtained under different X-ray tube energies with a maximum of 150 keV.Spatial resolutions were obtained and analyzed, and three image comparison indicators–image entropy, contrast-to-noise ratio, and sharpness (quantitative calculation using MTF (modulation transfer function)) [26, 27]–were employed for comparison purposes.With these points in mind, the following section provides a detailed analysis.
3.1 Spectral analysis and comparison of four detector crystals
To investigate the detection efficiency of the different crystals, a Geant4-based simulation model was designed.In the model, the source was placed 12 cm away from the detector,which has dimensions of 5 cm (length) × 5 cm (width) × 1 cm(thickness).5×108particles were uniformly emitted from the X-ray tube, and the simulation was executed by deploying thePenelopephysics model in Geant4 [28].The peak-tototal ratios PTTR(E) of the detectors with different energies and thicknesses were calculated based on the simulated total detection efficiency εT(E) and full-energy peak efficiency εF(E) , as shown in Eqs.(3–5):whereNdetectoris the number of photons recorded in the detector,Nphotopeakis the number of counts under the photopeak andNsourceis the number of photons emitted by the source.

Table 5 Comparison of simulation and experiment

Fig.7 a Total efficiency ( εT(E) ) and b Peak-to-total ratio ( PTTR(E) )of the four crystals plotted between 49.5 and 662 keV source energy values
Figure 7 shows the total efficiency and peak-to-total ratio of four crystals in the energy range of 49.5 keV to 662 keV.From Fig.7a, the following observations can be made.First,at a thickness of 1 cm, the total efficiency decreased for all crystals as the energy increased.Second, the total efficiency of CsPbBr3remained higher than that of the other materials throughout the entire energy range.Figure b shows that the peak-to-total ratios of NaI, CsI, and Cs2TeI6all exhibit an upward-then-downward trend as the energy increases, while the ratios always remain above 0.77 for all crystals.From 165 to 662 keV source energy, the total efficiency gradually decreased for all detectors because the energy of the photons increased, resulting in some photons directly penetrating the crystal without being absorbed.For CsPbBr3, a sudden drop in the peak-to-total efficiency occurred at approximately 88 keV, because the K-edge of Pb was 88 keV.At or above this energy level, 75 keV K-alpha characteristic X-rays were generated.These escaping X-rays were not recorded under the full peak, and therefore caused a decrease in the peakto-total efficiency.Fig.8 further demonstrates this by plotting the spectra obtained for each crystal at a fixed energy of 122 keV.According to the CsPbBr3spectra, unlike the other three crystals, the CsPbBr3crystal showed a significant Pb escape peak at 47 keV (usually calculated as the photopeak energy minus the K-alpha characteristic X-ray energy),which is consistent with other experimental work [29].In summary, both the flexible detector materials performed better than NaI and CsI.CsPbBr3showed the best performance in terms of the peak-to-total ratio, which remained above 0.85 throughout the 165–662 keV source energy range.It also exhibited the highest total efficiency in the energy range from 49.5 to 662 keV.However, because of the presence of a Pb escape peak, CsPbBr3’s performance was slightly undermined at 200 keV.Meanwhile, Cs2TeI6exhibited more stable performance throughout the entire energy range from 49.5 to 662 keV.
To investigate how the peak-to-total ratio changes as the detector thickness changes, 240 keV was selected as the energy point under which the PTTRs pertaining to the detector materials and thicknesses were plotted, as shown in Fig.9.This value was selected because the most prominent differences between key parameters, for example, detection efficiency, could be perceived at this energy level, as shown in Fig.7.As the crystal thickness increased, the peak-to-total ratio of each detector increased and eventually converged.Owing to the excellent X-ray absorption ability of the flexible detector crystals, convergence was achieved at thicknesses of 20 mm for CsPbBr3and 30 mm for Cs2TeI6, while NaI and CsI converged at 50 mm and 40 mm, respectively.Notably, the peak-to-total ratio of CsPbBr3was 0.083, which was higher than that of the NaI crystal.This indicates that smaller CsPbBr3crystals can achieve the same detection efficiency as the other three detectors.
3.2 Imaging performance comparison based on DR imaging system
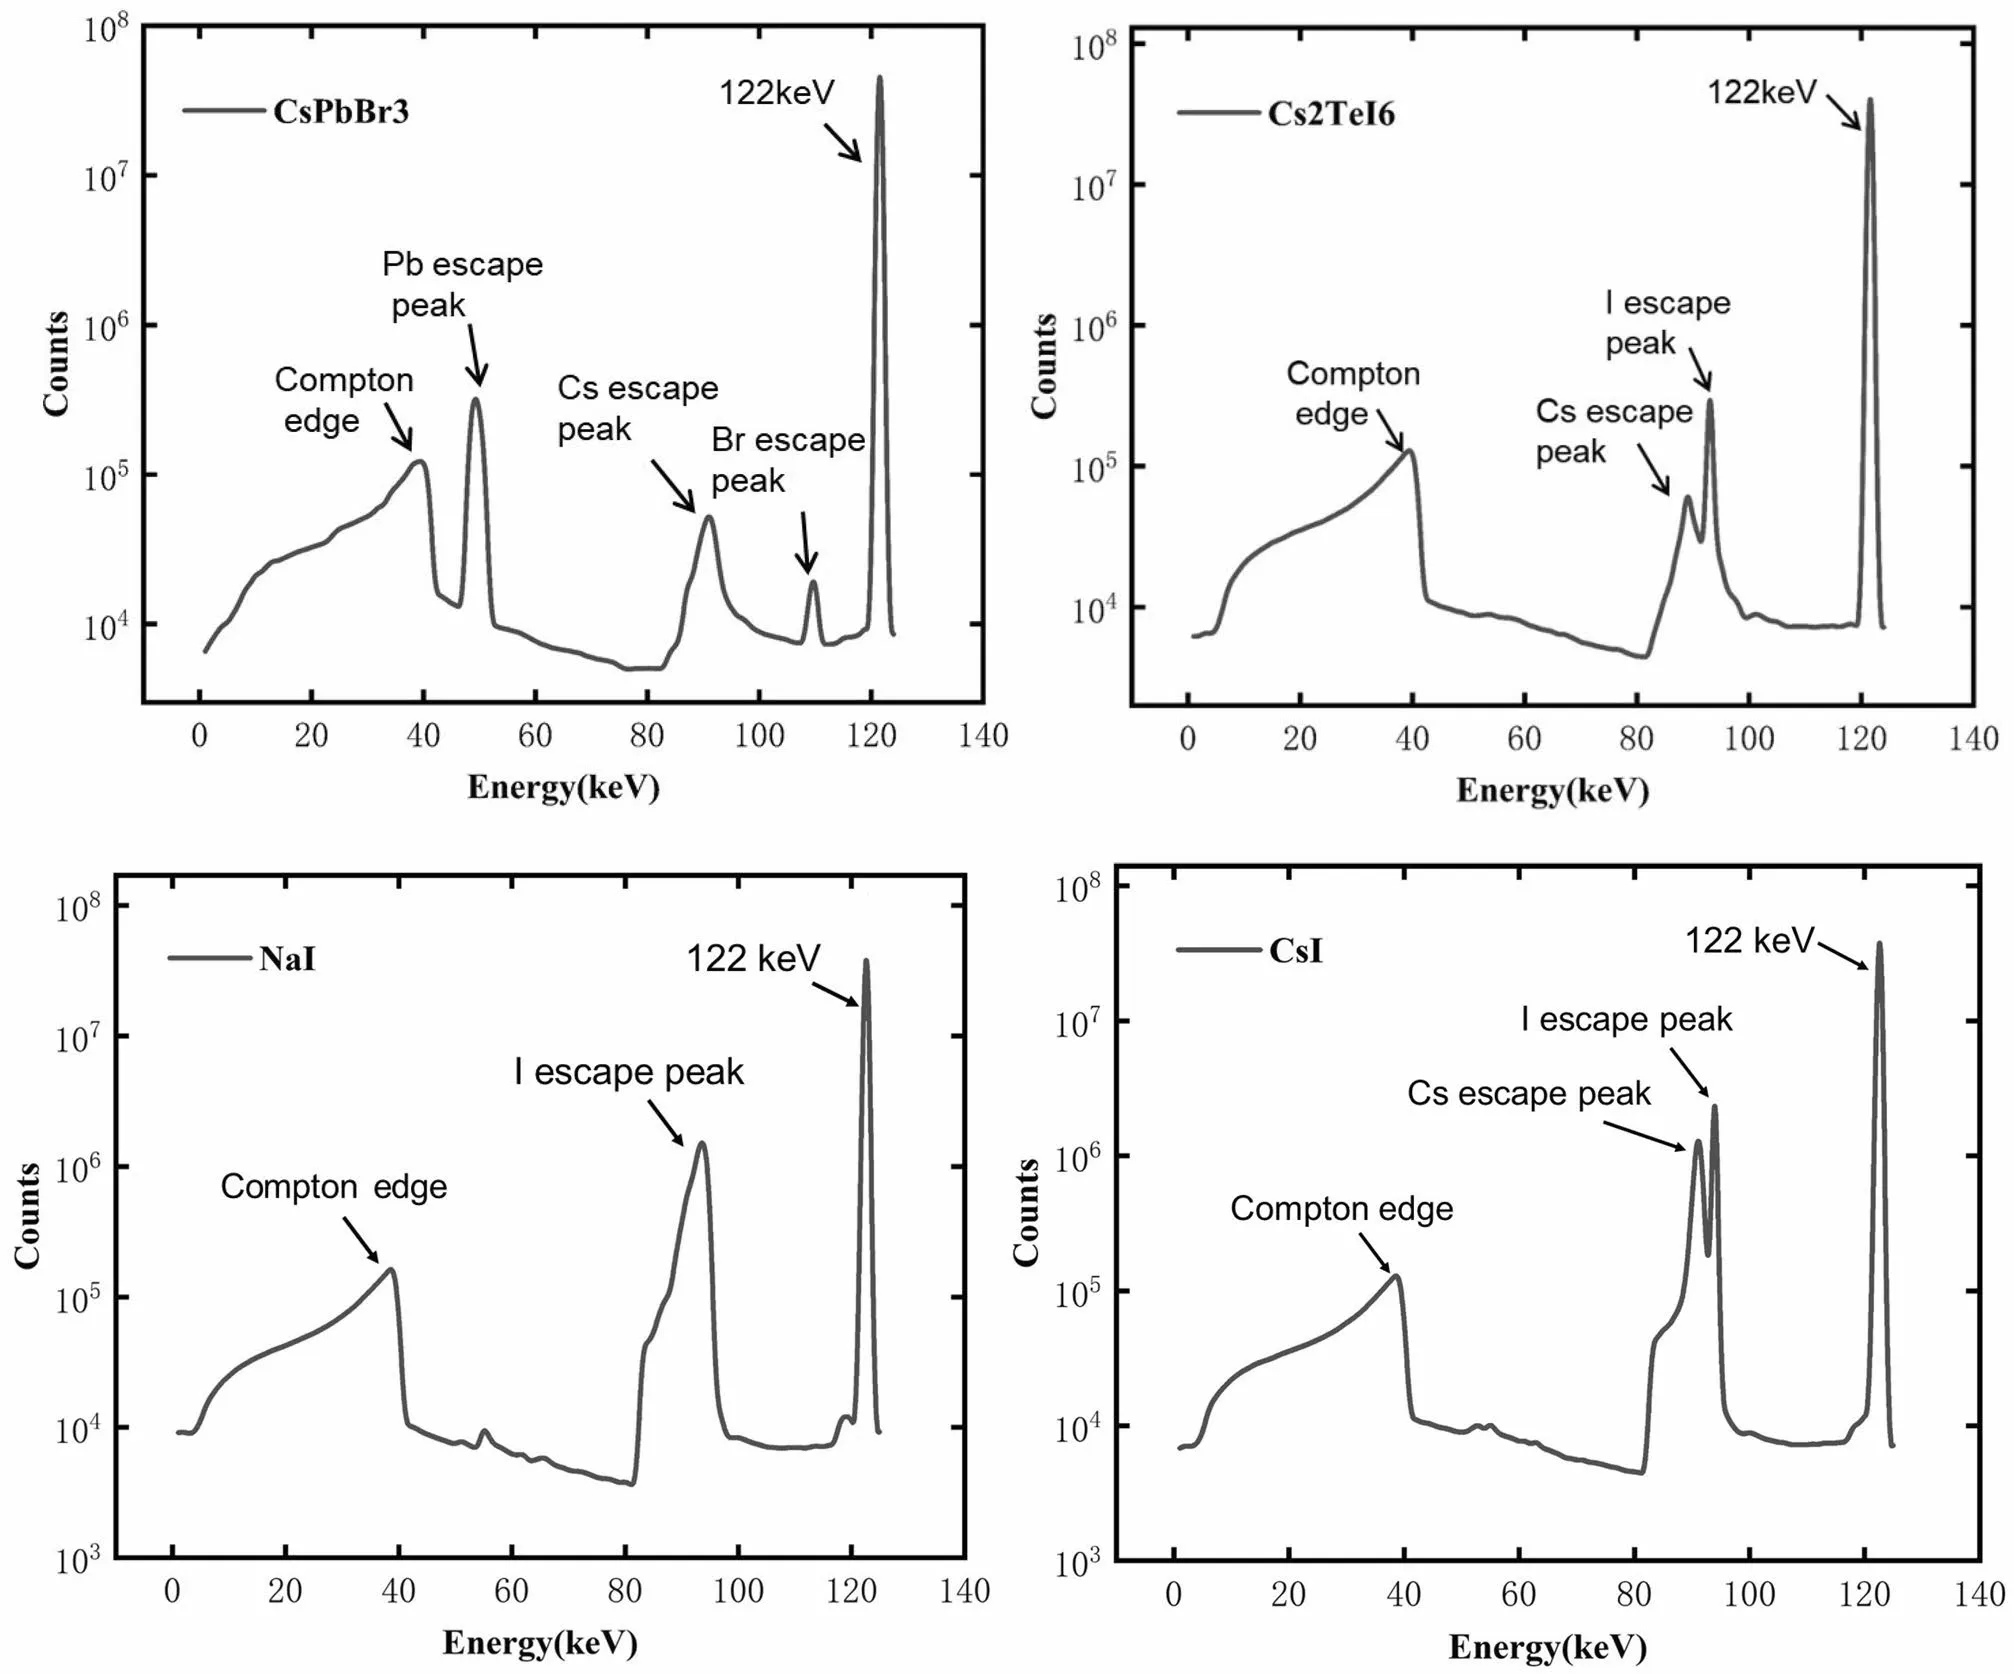
Fig.8 The spectra obtained under 122 keV X-ray using CsPbBr3, Cs2TeI6, NaI, and CsI
In this section, the imaging performance of the four types of crystals is compared and analyzed based on the DR imaging system model.To achieve this, the spatial resolution was used as a key indicator of crystal characteristics.For a complete assessment, the images obtained from each detector were also compared in terms of image entropy,contrast-to-noise ratio, and sharpness.First, the simulated and measured spatial resolutions of the CsI detector were compared to ensure the correctness of the simulation.This was achieved through the quantitative measurement of the standard dual-line image quality indicator (IQI) according to the experimental setup shown in Table 6.The experiment was repeated 20 times to ensure the necessary precision.Second, the spatial resolution [30, 31] was calculated using the MTF, as shown in Eq.(5).The MTF is defined in terms of the contrast at a given spatial frequency, which characterizes the ability of an imaging system to deliver contrast.The DR imaging results are shown in Fig.10.A corresponding Monte Carlo model was then developed for comparison.
whereC(I) is the input modulation,VBandVWare the average luminances for the black and white areas, respectively,and the calculated input modulation was 0.959 at low frequencies.C(O) is the output modulation andVminandVmaxare the minimum and maximum luminance for a pattern near a given frequency, respectively.
Taking the standard deviation of the MTF measurement as the error bar, the simulated MTFs for different line pairs were within the error bar of the measurement, demonstrating that the spatial resolutions of the simulation and measurement matched well, as shown in Fig.11.Upon verification, the Monte Carlo model was extended to evaluate the spatial resolutions of the other three types of crystals, and the results are shown in Fig.12.For all crystals, the spatial resolution in terms of the MTF decreased as the number of line pairs increased.When the spatial frequency reaches five line pairs, the MTFs could be maintained at more than 30% for all four detectors, which proves that all the crystals can achieve good spatial resolution based on the simulation.The CsPbBr3crystal exhibited the highest spatial resolution,whereas that of NaI was the lowest.The results show that CsPbBr3has the best spatial resolution among the four types of crystals, demonstrating that CsPbBr3has a stronger ability to observe tiny objects.

Fig.9 Peak-to-total ratios ( PTTR(E) ) of the four crystals under different thickness
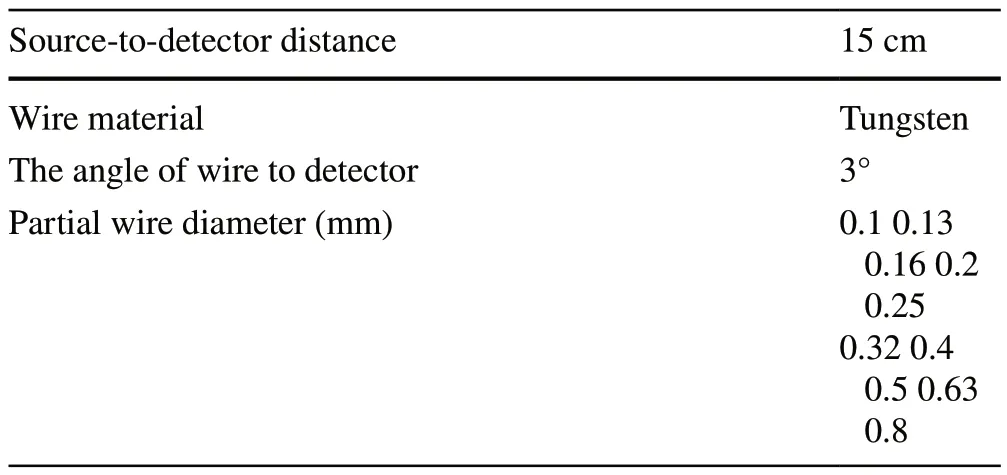
Table 6 IQI experiment setup
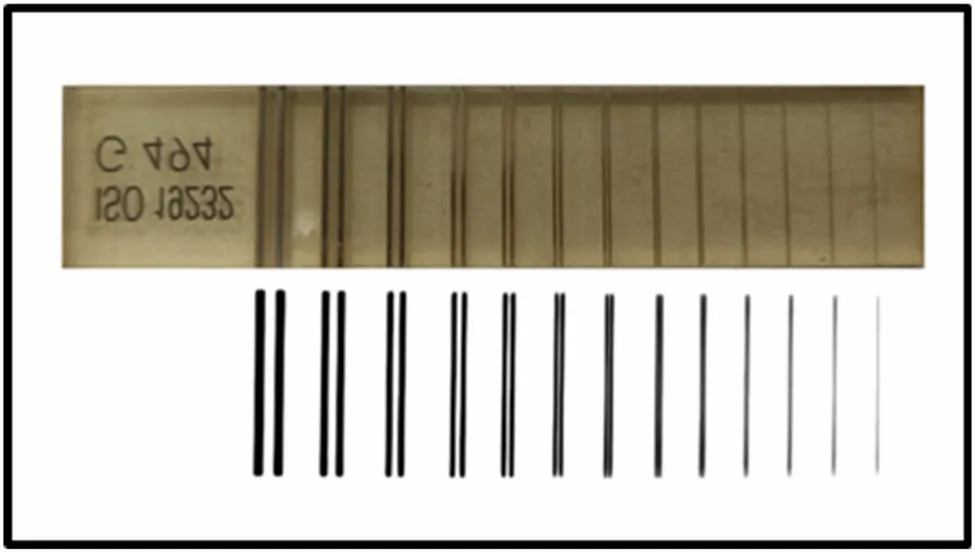
Fig.10 Dual-line image quality indicator imaging based on in-lab DR imaging system

Fig.11 Spatial resolutions of CsI detector for 150 kV X-ray spectrum based on simulated and experimental DR imaging system

Fig.12 (Color online) Spatial resolutions of different detectors for 150 kV X-ray spectrum
For image comparison, the Monte Carlo model described in Sect.2 was employed again using a four-defect test object.The simulated images were evaluated using single non-contrast image processing methods [32], where the included indicators were defined to assess image clarity and quality.
From the above results (Table 7), CsPbBr3showed the highest image entropy and contrast-to-noise ratio, indicating that its image has higher clarity and less confusion.Furthermore, when using 50% MTF as a reference [33, 34],the image obtained from the CsPbBr3simulation showed the highest spatial frequency of 3.845 lp/mm.This indicates that CsPbBr3has the best sharpness among the four crystals.

Table 7 Performance comparison of image obtained using different detectors for 150 kV X-ray spectrum(entrance air kerma is 16.59 mGy for all detectors)
4 Conclusion
In summary, this work investigated a group of recently developed innovative perovskite flexible detectors, whose X-ray imaging characteristics and feasibility were researched and analyzed in detail.This was achieved by developing a Monte Carlo model from an in-lab DR imaging system,based on which different detector materials were simulated and their performance was compared.The results show that CsPbBr3and Cs2TeI6exhibited better performance in terms of the peak-to-total ratio and total efficiency than the NaI and CsI crystals.Specifically, the peak-to-total ratio of CsPbBr3remained above 0.85 throughout the simulated energy range from 49.5 to 662 keV.CsPbBr3achieved the same level of detection efficiency at a relatively thinner crystal thickness compared to the other materials, and it also exhibited the best spatial resolution among the four crystals.Future work will focus on three-dimensional imaging using perovskite detectors (both organic and inorganic), as well as exploring the performance of other scintillation materials combined with different substrates.Experiments are currently being planned to identify and validate possible new detector designs based on their X-ray imaging ability and structural robustness.However, the potential of these detectors to mitigate the spatially heterogeneous distribution of X-ray doses over large areas requires further investigation.
Author contributionsAll authors contributed to the study conception and design.Material preparation, data collection and analysis were performed by Yang Wang and Qiong Zhang.The first draft of the manuscript was written by Yang Wang, and all authors commented on previous versions of the manuscript.All authors read and approved the final manuscript.
Data availabilityThe data that support the findings of this study are openly available in Science Data Bank at https:// www.doi.org/ 10.57760/ scien cedb.j00186.00073 and http:// cstr.cn/ 31253.11.scien cedb.j00186.00073.
Conflict of interestThe authors declare that they have no competing interests.
杂志排行
Nuclear Science and Techniques的其它文章
- GPU‑based cross‑platform Monte Carlo proton dose calculation engine in the framework of Taichi
- Photonuclear production of nuclear isomers using bremsstrahlung induced by laser‑wakefield electrons
- High‑precision high‑voltage detuning system for HIAF‑SRing electron target
- Resolution analysis of thermal neutron radiography based on accelerator‑driven compact neutron source
- Decomposition of fissile isotope antineutrino spectra using convolutional neural network
- Searching for QCD critical point with light nuclei
