GOAT: a simulation code for high‑intensity beams
2023-07-11LeiWangJianChengYangMingXuanChangFuMa
Lei Wang ·Jian‑Cheng Yang ·Ming‑Xuan Chang ·Fu Ma
Abstract A simulation code, GOAT, is developed to simulate single-bunch intensity-dependent effects and their interplay in the proton ring of the Electron-Ion Collider in China (EicC) project.GOAT is a scalable and portable macroparticle tracking code written in Python and coded by object-oriented programming technology.It allows for transverse and longitudinal tracking,including impedance, space charge effect, electron cloud effect, and beam-beam interaction.In this paper, physical models and numerical approaches for the four types of high-intensity effects, together with the benchmark results obtained through other simulation codes or theories, are presented and discussed.In addition, a numerical application of the cross-talk simulation between the beam-beam interaction and transverse impedance is shown, and a dipole instability is observed below the respective instability threshold.Different mitigation measures implemented in the code are used to suppress the instability.The flexibility, completeness, and advancement demonstrate that GOAT is a powerful tool for beam dynamics studies in the EicC project or other high-intensity accelerators.
Keywords Code development ·Numerical methods ·Beam dynamics ·High-intensity effects
1 Introduction
The Electron-Ion Collider in China (EicC) [1] is a proposed highly polarized electron-ion collider based on the highintensity heavy-ion accelerator facility (HIAF) [2] upgrade.It provides a platform for frontier research in nuclear physics with a center of mass energy of 16.7 GeV and luminosity of 2 × 1033cm−2s−1.The primary parameters are presented in Table 1.The proton ring (pRing), one of the major accelerators of the EicC project, is both the accelerator ring and the collider ring of the proton beam.In the pRing, an operation mode with multi-bunches and high single-bunch intensity is essential to achieve the design goal of high luminosity.However, this leads to enormous beam dynamics challenges in the pRing.Intensity-dependent effects, such as the beam coupling impedance [3, 4], space charge effect [5], electron cloud instability [6, 7], beam–beam interaction [8–10], and their interplay [11–14], are the most severe limitations of EicC performance.
To thoroughly investigate the machine performance, beam instabilities, and associated mitigation methods subjected to complex high-intensity effects, macroparticle tracking is the only way to model and optimize the beam dynamics in pRing.Various beam dynamics simulation codes have been developed by CERN according to specific requirements.For example, PyHEADTAIL [15] is developed for electron cloud instability and impedance induced single-bunch collective effects, PyECLOUD [16] is exploited for electron cloud establishment simulation, and the longitudinal collective effect and beam manipulation are implemented in BLonD [17].Beam-beam interactions in colliders can be studied using BeamBeam3D [18] and Athena [19] developed by LBNL and IMP, respectively.These codes have been well benchmarked with different existing codes or beambased measurements and have become powerful tools for various beam dynamics studies.However, as the machine performance is continuously pushed to a higher level, different effects can no longer be treated independently and their complex interplay should be considered in any realisticattempt to study the high-intensity beam dynamics [12, 20].The combination of different codes for cross-talk studies is impracticable because of differences in coding languages and common interfaces.Almost no code can simulate multiple high-intensity beam dynamics in hadron accelerators in a self-consistent manner.Therefore, as part of the EicC project, a new beam dynamics simulation code, GOAT,has been developed in the past few years and is capable of studying different single-bunch intensity-dependent beam dynamics, their complex interplay, and possible mitigation techniques simultaneously in the pRing.
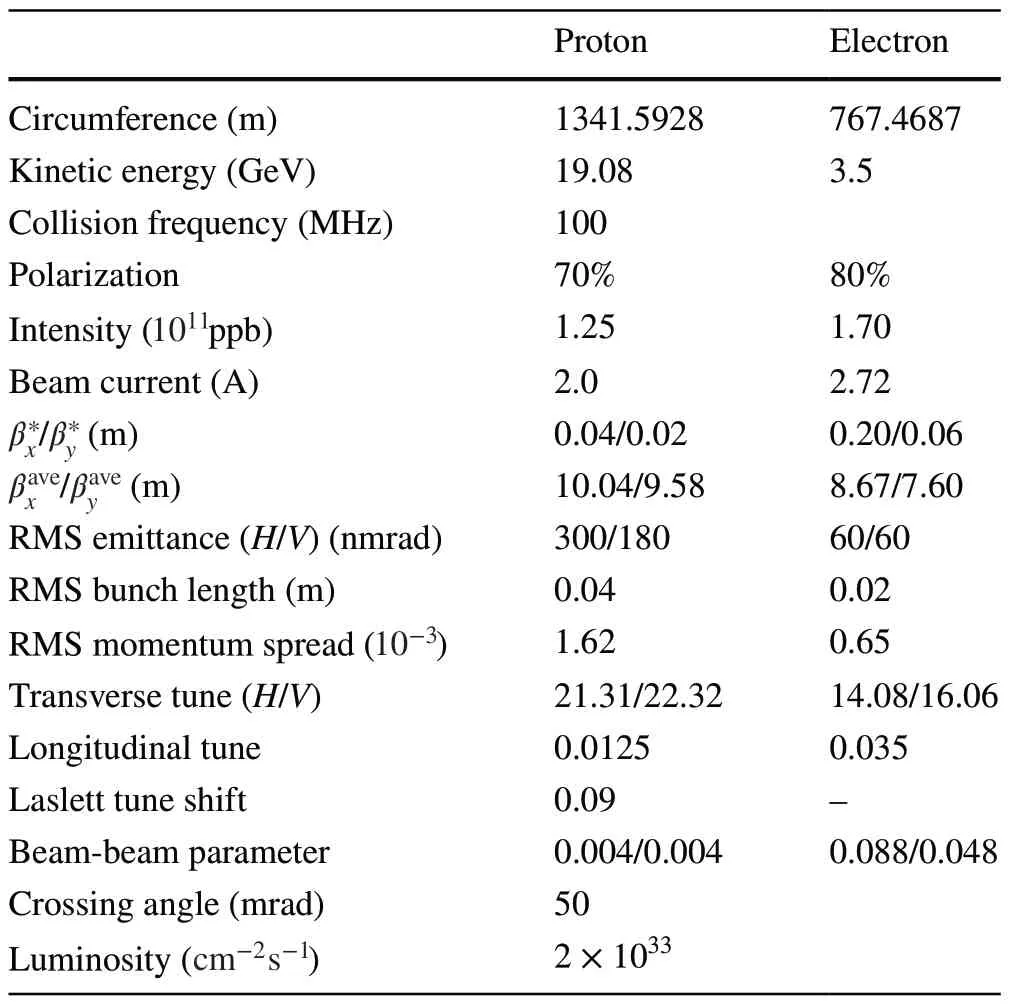
Table 1 Main parameters of EicC
GOAT is a multiparticle tracking code developed based on the Python [21] language using object-oriented programming (OOP) technology.Python significantly improves the efficiency of code development.Some of the core computing modules of the code are written using the Cython [22] package because of the slow execution speed of the interpreted language.Taking advantage of OOP technology, diversified elements and functions can be easily inserted into the code without affecting the existing ones.This also facilitates further parallelization to achieve better performance.Thus far,based on the most basic beam transportation and manipulation methods in the transverse and longitudinal planes,implementations of the impedance induced single-bunch collective instability, space charge effect, electron cloud effect, and beam-beam interaction are included in the code.
The remainder of this paper is organized as follows.The code architecture and numerical model are given in Sect.2.In Sect.3 to Sect.6, the detailed implementations of the four different high-intensity effects are explained separately,and the benchmark results against other codes or theories are presented and discussed.An application of the code for the cross-talk between two different effects is presented in Sect.7.Section 8 presents the summary and outlook.As an important aspect of simulation software, the code performance is preliminarily tested and the results are summarized in Appendix A.
2 Code architecture and numerical model
GOAT consists of a beam module, data management module, infrastructure element module, and physical element module.The code architecture is illustrated in Fig.1.All accelerator beam particles are defined in the beam module.In this module, different particle distributions, such as KV and Gaussian distributions, can be generated according to the parameters given by the user [23].Various methods for transforming the coordinates of the particles and other parameters are implemented in the beam module, which can provide suitable parameters for specific studies.In addition,the beam module includes functions for the initialization and dynamic management of the electrons distributed in the vacuum chamber used for electron cloud simulation.
The data management module can read external input files, such as beam distribution and optics files according to user commands, and convert them into data structures compatible with GOAT.The data, such as turn-by-turn particle statistical information and instantaneous particle distribution at specified time steps during the simulation process,can be stored by this module and written to the disk with time stamps.This module also includes data post-processing functions, such as reading the output files from the simulation, picking up the required data, and automatically generating charts.
Infrastructure element module and physical element module constitute the physical kernel of the GOAT code.The former typically contains elements that provide auxiliary functions for simulations, such as beam slicing elements and PIC method-based Poisson solvers.Intensity-independent beam transportation and manipulation can also be achieved by combining infrastructure elements.The latter specifically refers to the four types of high-intensity beam dynamics elements implemented in GOAT.Each of the four elements is used to describe a particular physical process.Based on the OOP technology, it is convenient to build new elements in both the infrastructure and physical element modules.Instead of using a command file to control the simulation procedure [16], the user can interactively customize the beamline in a specific order by using different combinations of infrastructure and physical elements to complete the desired simulation [15, 17].
In GOAT, a macroparticle beam of intensityN, energyE0, and particle chargeqis described by the 6D set of coordinates (x,px,y,py,z,pz), wherexdenotes the horizontal offset from the reference orbit,ythe vertical offset,pxandpythe corresponding transverse normalized momenta,zthe longitudinal offset from the synchronous particle, andpzthe relative momentum deviation [24].As for an electron macroparticle used in the electron cloud study, a 7D vector(x,vx,y,vy,s,vs,ne) is constructed [6, 16], wherexandyare defined in the same way as a beam particle,sdenotes the distance to the transverse reference plane,vx,vy, andvsthe absolute velocity component in the horizontal, vertical, and longitudinal direction, respectively.Further,nedenotes the amount of charge carried by the macroparticle.Hereafter,for convenience, “beam”and “electron”are used to refer to an accelerator beam and electron in the electron cloud study, respectively.
Because of the distinctive motion characteristics of the beam particles and distributed electrons (the former always fulfills ultra-relativistic conditions, whereas the latter is usually non-relativistic), different methods are required to integrate the corresponding equation of motion.GOAT models the transverse beam dynamics by tracking macroparticles linearly through a transfer matrix between interaction points around the ring [24].Longitudinal beam motion can be modeled by either linear tracking or nonlinear drift-kick integration through RF elements with a given voltage, phase, and frequency [25].However, for an electron, the corresponding coordinates are advanced by integrating the Lorentz equation that it follows directly.A second-order symplectic Boris algorithm is implemented in the code [25], and in certain specific cases, the integration algorithm can be simplified for better performance [7].
In addition, GOAT is equipped with two beam slicing methods: one is the uniform-length slicing method, in which all slices have the same length, and the other is the uniformcharge slicing method, in which each slice contains the same number of macroparticles [15].In each method, slicing is performed for the beam rather than the ring, and the upper and lower limits of the longitudinal extent are given by the user.Both methods have their own advantages and can be used for different simulations.Additionally, to meet the requirements for solving the Poisson equation, two types of solvers based on the particle-in-cell (PIC) method are implemented.One uses the finite-difference (FD) time-domain method with perfect electric conducting boundary conditions [6].The vacuum pipe is set as the boundary, which could be either elliptical or rectangular.The other method uses the integrated Green function (IGF) with open space boundary conditions [9].The boundary is assumed to be at infinity, which is valid when the beam size is much smaller than the vacuum chamber.This can save computational resources and ensure computational speed while maintaining accuracy if the ratio of the pipe size to the beam size is large.Furthermore, the linear chromaticity, the thin nonlinear elements [24], and the bunch-by-bunch feedback system[26] are available in GOAT to explore possible mitigation measures for high-intensity effects.
Relying on the abundant infrastructure element module and flexible numerical model, the impedance induced collective instability, space charge effect, electron cloud effect, beam-beam interaction, and their interplay can be simulated in the GOAT code using the kick approximation.Together with the benchmark results against other frequently-used codes, their physical models and numerical approaches are introduced in the following sections.
3 Impedance
In GOAT, the simulation of impedance induced collective instability is simple.Only beam transportation and impedance elements are required to form the beamline.The transverse dipolar impedance, transverse quadrupolar impedance, and longitudinal impedance are available in the code.Instead of the impedance, the wake function,which is the equivalent expression of the impedance in the time domain, is used to calculate the wake kick experienced by the beam particles [4, 24]:

For the broadband resonator (BBR) impedance model,a built-in method is used to calculate the wake function in the space domain.For other impedance models, coarse wake functions are obtained by reading external input files with two columns of data: one for the position and the other for the corresponding wake function.The linear interpolation method is adopted for finer wake function calculations.The slicing technique can be employed to achieve a better computational performance than calculating the wake force between two macroparticles [27].The wake force between slices is calculated using the transverse and longitudinal centroids.All the macroparticles contained in each slice experienced the same wake force.If only the transverse impedance is included, the beam is transported linearly in the ring using a transfer matrix for both the transverse and longitudinal planes.Only an RF element is required for the longitudinal impedance study.It is noteworthy that the RF element models particle motion in the ( ΔE,θ) phase space, whereas the (z,pz) phase space is used in the impedance element.The particle coordinates are transformed using the beam module.In both cases, the wake kick for the beam is integrated at a single interaction point [24, 27].
3.1 Transverse mode coupling instability
In transverse mode coupling instability (TMCI), the frequency shift of each azimuthal satellite increases with impedance or beam intensity.When two adjacent modes collide and merge, the beam becomes unstable, and the oscillation of the bunch center starts to grow exponentially[4].This type of instability usually requires a detailed study because it is destructive and can cause beam loss.Based on the beam parameters in Table 1, the impedance threshold for pRing is studied.BBR is used in the simulation to approximate the transverse impedance model in pRing, which is a reasonable estimation when the pRing’s impedance model is not fully built.The following values are considered for other parameters: quality factorQ=1 and resonant frequencyfr=1 GHz.The parameters are chosen mainly because the cutoff frequency of the vacuum chamber with an average radius is approximately 1 GHz.
The proton beam is initialized with transverse and longitudinal Gaussian distributions.Taking the vertical plane as an example, the impedance is scanned from 0 to 8 MΩ∕m at intervals of 0.04 MΩ∕m.Each set of simulations is performed for 215turns.Figure 2a shows the spectrum obtained via fast Fourier transformation (FFT) using the turn-by-turn vertical bunch centroid recorded in the simulation.As shown in the figure, with the increase in impedance, the frequency of 0-mode and −1 mode moves down and up, respectively.These two modes are coupled at an impedance of 7 MΩ∕m , after which beam loss occurs rapidly and the spectrum is no longer accurate.As a benchmark, the same simulation is performed using PyHEADTAIL, and the spectrum is shown in Fig.2b.As observed,the behaviors of the 0 and −1 modes are exactly the same as those predicted by GOAT, but the instability threshold of 7 MΩ∕m is slightly higher.The prediction of the instability threshold differs by only 0.6% between the two codes.Comparing the two spectra, −2 mode and +1 mode are also clearly visible apart from the two strongest modes.Meanwhile, several lines appeared for each azimuthal satellite, which can be interpreted as different radial modes of the same azimuthal mode.From the perspective of the spectra, the results of the two codes are consistent.
In addition, in Fig.3, the instability growth rates obtained from the two codes are compared by fitting the envelope of the bunch centroid oscillation.The fitting window is in the interval of 20–80% of the total data selected before beam loss.Again, the TMCI growth rates predicted by the two codes matches perfectly.All benchmark results against PyHEADTAIL show that the beam transportation element and impedance element implemented in GOAT function very well.

Fig.2 (Color online) Real part of the normalized mode-frequency shifts in the transverse plane given by a GOAT and b PyHEADTAIL via the macroparticle tracking with the BBR impedance model

Fig.3 (Color online) Growth rates of the transverse mode coupling instability as a function of the impedance given by PyHEADTAIL(black dots) and GOAT (red dots)
3.2 Longitudinal microwave instability
In the longitudinal plane, the induced voltage generated by the longitudinal impedance is superimposed on the RF voltage, causing potential well distortion.As the impedance increases further, the microwave instability region is reached [28].When the instability threshold is exceeded, the energy spread and bunch length start to grow drastically.Although the microwave instability can selfstabilize and will not lead to beam loss, the beam-beam performance in colliding beams is likely to be affected.Similar to the transverse plane, the BBR is used to estimate the longitudinal impedance model in pRing.The quality factor isQ=1.For the resonant frequency,fr=2 GHz is chosen such that the rms bunch length is longer than the oscillation period of the BBR model, and makes the bunch particles see mostly the inductive part of the impedance.Thus, the extent of bunch lengthening can be investigated,as it is an important factor for peak luminosity.
The simulations are conducted using BLonD and GOAT.The proton beam parameters used in the simulations are listed in Table 1.The beam size, momentum spread, and emittance are simulated by increasing the longitudinal impedance from 0 to 80 kΩ with an interval of 5 kΩ.Each set of simulations is performed for 50000 turns.In order to avoid the filamentation caused by the induced voltage at the initial stage, the impedance is elevated adiabatically to maximum within the first 8000 turns, which is more than 100 times the synchrotron period.As shown in Fig.4, the instability threshold predicted by both codes is 35 kΩ.All the results plotted in the figures are obtained by averaging the bunch statistics after reaching a dynamic balance.In the potential well distortion region, the predictions of the longitudinal beam parameters from the two codes are identical.Note that the bunch length increased and the momentum spread shrank with an increase in impedance.This is because of the absence of synchrotron radiation in proton beams.Below the instability threshold,the evolution of the bunch length and momentum spread must ensure that the longitudinal emittance is conserved[29], as shown in Fig.4c.

Fig.4 (Color online) a Bunch length, b momentum spread, and c emittance as a function of the impedance obtained by GOAT (black dots) and BLonD (red dots)
However, as the strength of the microwave instability is enhanced with higher impedance, divergences gradually appeared in the simulation results.Taking the momentum spread as an example, the maximum relative error between different codes is approximately 9%.Similar to results reported in Ref.[30], bifurcations arise between the different simulation codes when the microwave instability becomes sufficiently strong.Nevertheless, both BLonD and GOAT provide the same instability threshold, and the tendencies of the beam parameters obtained through the different codes are not significantly different.The correctness of the GOAT code in modeling the longitudinal collective effect is verified.In addition, other information, such as the bunch distribution and detailed evolution of the beam parameters,can also be extracted from the simulations.Figure 5a shows the longitudinal bunch shape in the potential well distortion region with an impedance value of 25 kΩ , and Fig.5b shows the evolution of the bunch length and momentum spread,where the microwave instability has already occurred with an impedance value of 45 kΩ.
4 Space charge effect
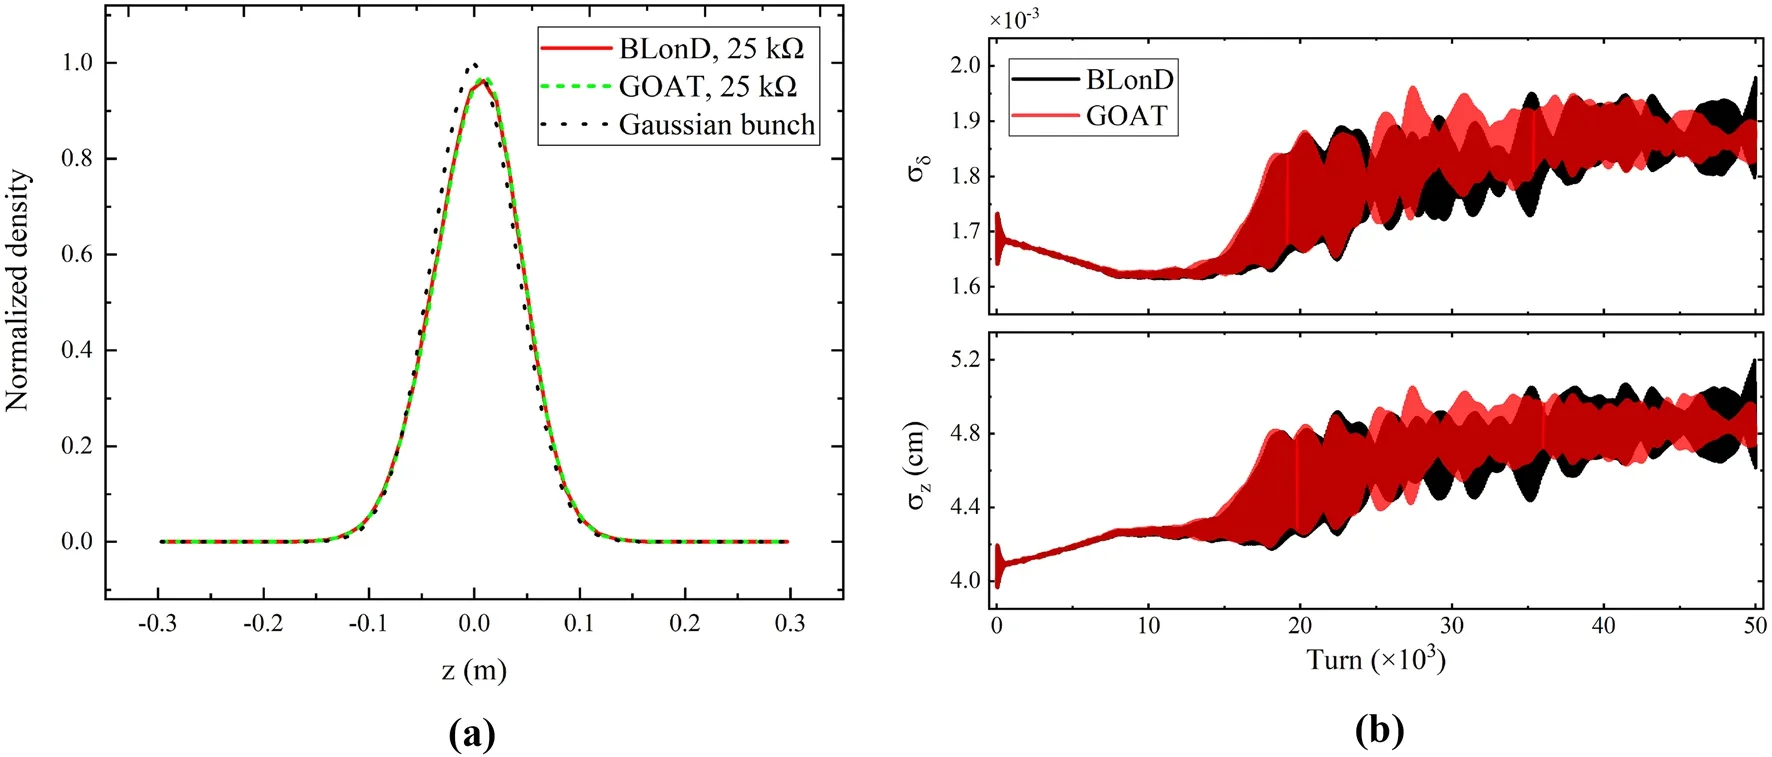
Fig.5 (Color online) a Longitudinal bunch shape normalized to unit with the longitudinal impedance value of 25 kΩ in the PWD region.b Evolution of the bunch length and momentum spread with the impedance value of 45 kΩ in the microwave instability region
The simulation of the space charge effect is straightforward.However, the particle motion is continuous under the action of the space charge self-field.Applying an integrated space charge kick to the beam once per turn leads to incorrect results [27].Therefore, the ring is divided into several segments using an external optical input file.These segments can be uniform or nonuniform.A space charge element is placed at each node.Within each space charge element, the particle coordinates are first Lorentz boosted from the comoving laboratory frame to the beam frame, and the FD Poisson solver is used to compute the electrostatic field slice-by-slice in the beam frame.After considering the magnetic field when converted to the laboratory frame, the space charge kick is applied to each particle.The transverse tracking between two adjacent space charge elements is linear.When synchrotron motion is considered, longitudinal dynamics can be considered as either linear or performed by the RF element.
Considering the space charge self-field, the envelope equations can be written as [31]
whererdenotes the rms beam widths,K(s) the focusing function of lattice,εgeothe geometry emittance,ε0the permittivity of vacuum,γthe Lorentz factor, andλthe beam line density.The coherent quadrupolar tune that describes the envelope oscillation can be derived analytically using the coupled envelope equations in a smoothly approximated ring [31]:
whereDdenotes the coupling parameter andQx,yare the bare tunes in the horizontal and vertical, respectively.
GOAT code is employed to study the transverse coupling phenomenon induced by the space charge effect.As indicated in Eq.3, the envelope tunes depend on the bare transverse tunes of the ring.Thus, seven groups of simulations with different initial bare tunes are performed by tracking the beam for 512 turns under the action of the space charge selffield.The bare vertical tune changes fromQy= 21.28 toQy= 21.34, whereas the horizontal tune is fixed atQx= 21.31.The beam is initialized as a coasting beam with a transverse KV distribution represented by 1× 10⁶macroparticles.The horizontal and vertical beam sizes are 20 and 10 mm, respectively.According to numerical convergence studies, 500 space charge elements are uniformly placed along the ring.The smooth approximation is used in the optics file.In the simulations, the rms beam size is calculated and recorded at each node.Perform FFT on the turn-by-turn beam size at one node, and two envelope coherent modes are obtained.In Fig.6, the simulated coherent tunes are compared with those predicted by Eq.3.The variation in the vertical beam size owing to the vertical beta function scaling with the vertical tune is considered for both the simulation and analytical calculation.As shown in the figure, GOAT matches the theory well.
In addition, the incoherent tune spread of the beam particles with different amplitudes is a direct dynamic result of the space charge self-field.It can be used as a crosscheck for space charged elements.Under the smooth approximation,all particles in the KV distribution have exactly the same incoherent tune shift when subjected to the space charge self-field, which can be expressed by the following formula[31]:
whereRx,yare the rms beam sizes of a KV distribution in horizontal and vertical plane, respectively.Here, a KV beam with a radius of 10 mm is used, and the incoherent tune shift calculated using Eq.4 is −0.04.Correspondingly, the maximum incoherent tune spread of a Gaussian beam can also be obtained by analytical calculations [31]:whereβ(s) is the beta function and theσx,ythe rms beam size of a Gaussian distribution in the horizontal and vertical plane, respectively.According to the theory in accordance with the rms equivalence principle, a Gaussian beam with an rms size of 5 mm is considered, and the maximum incoherent tune spread is −0.08 , which is twice the incoherent tune shift in the KV beam [5, 32].For comparison, the numerical tracking is performed using the beam parameters employed in the analytical evaluation.In both cases, the beams are initialized with 5 × 10⁵macroparticles, and 100 space charge elements are uniformly distributed along the ring.The beams are tracked linearly in the transverse plane,and the longitudinal motion is frozen.As shown in Fig.7,the black and red dots represent the incoherent tune spreads of all particles in the Gaussian and KV beams, respectively.The incoherent tune spread of the Gaussian beam particles reaches the theoretically calculated value indicated by the blue pentagram.Although the tune spread of the KV beam given by the simulation is not strictly a point marked by the green pentagram, as predicted by theory, the dispersion is very small.This is consistent with the results reported in Ref.[5].This may be caused by fluctuations in the particle distribution or numerical errors in the field solver.Overall,the space charge element implemented in GOAT is correct.
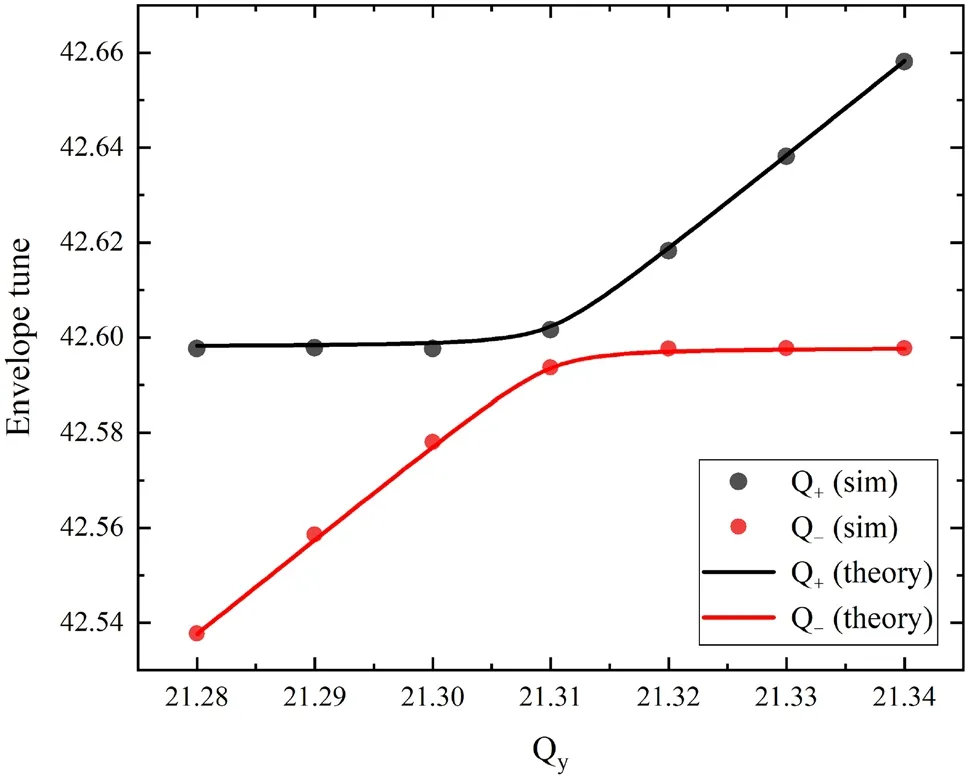
Fig.6 (Color online) Envelop mode tunes as a function of the bare vertical tune of the machine for the coasting pRing beam obtained by theory (lines) and macroparticle tracking (dots)
5 Electron cloud effect
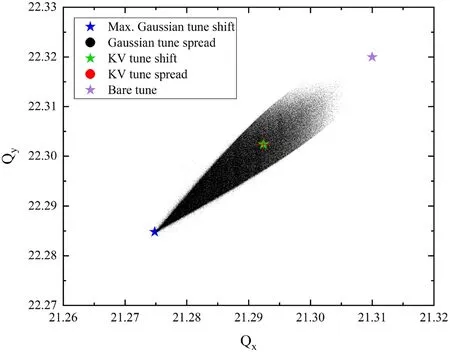
Fig.7 (Color online) Incoherent tune spread obtained by the macroparticle tracking with transversely a Gaussian distribution (black dots) and a KV distribution (red dots).The incoherent tune shift of the KV distribution is denoted by the green pentagram, and the maximum incoherent tune spread of the Gaussian distribution is marked by the blue pentagram.The bare tune is represented by the purple pentagram
In modeling electron cloud effects, the cloud build-up process and beam-cloud interaction are treated separately, or the so-called “weak-strong”model [6].This is because the dynamic balance of the electron cloud density in the vacuum chamber can be reached in a single or very few turns,whereas the beam-cloud instability study requires tracking the beam for many turns, at least longer than the instability growth time.In GOAT, two methods are established for beam-cloud interactions: the linearized method [31] and the self-consistent tracking method [7].The linearized method is based on cloud dipolar and quadrupolar forces obtained from dedicated simulations.In the self-consistent tracking method, both the beam particles and electrons are characterized by macroparticles.The electromagnetic interaction between the beam and cloud is modeled by a set of thin interactions along the ring, and the forces acting on each other are solved numerically using the FD Poisson solver implemented in the code.Currently, the linearized method is preferred for studying the beam-cloud instability because the computation overhead for the tracking method is expensive.
5.1 Build‑up simulation
In the build-up simulation, the very low density cold electrons are uniformly generated in the chamber as the “seed”electron at the initialization stage.When the bunch passes,primary electrons are created due to the residual-gas ionization or beam loss.These electrons, along with the surviving electrons, are accelerated to some energy under the action of the beam field.Secondary electrons are produced as energetic electrons hit the chamber wall.Only elastic scattering and real secondary emission are included in the secondary electron emission model.The energy carried by the electron determines the secondary electron yield (SEY) of an elastically scattered electron [6]:
whereR0corresponds to the elastic reflection probability for an electron in the limit of zero primary electron energy,the fitting parameter of experimentally measured energy spectrum of elastically scattered electrons (chosen as a specific value according to the vacuum chamber’s material),andEthe energy of the incident electrons (calculated via the velocity of each electron in the simulation, in unit of eV), or a true secondary electron is produced with SEY [6]:
whereEmaxis the energy of the electrons at which the SEY is maximum,δmaxthe maximum value of the SEY at normal incidence, andsthe fitting parameter of measured SEY curve (s= 1.35 is used widely since it provides the most reasonable fit to the experimental data.).The newly generated electrons follow a logarithmic normal distribution in energy and a cosine distribution in direction.This process is repeated successively according to the user-defined beam filling pattern.It is worth noting that, due to the multipacting effect, the number of electron macroparticles and the charge carried by a single electron change constantly during the simulation [16].For considerations of computing performance and memory, as in PyECLOUD, both the number of macroparticles and the amount of charge of single macroparticles are dynamically managed.All alive electrons are mixed and redistributed in the 6D phase space when the above two quantities exceed the pre-defined threshold.After the regeneration process, the charge of each electron is at the same level.
Electron cloud build-up simulations are performed in the drift, dipole, and quadrupole regions using PyECLOUD and GOAT software.The numerical parameters in Table 2 are used.Figure 8 shows the evolution of the electron line density within the vacuum chamber simulated by the two codes.The line density in the quadrupole region shown in the figure is halved for comparison.Both codes yield the same results.The time scale shown here is only 1/8 of the revolution period.Nevertheless, owing to the extremely short bunch spacing, the electron cloud reaches equilibrium after dozens of bunches pass through.As the cloud becomes saturated, the electron densities in the field-free and quadrupole regions are relatively close, at approximately 4 × 10¹⁰/m.Although the horizontal motion is frozen in the presence of a dipole magnetic field, the electron density also reaches 2.5 × 10¹⁰/m and tends to increase slowly.In addition, the oscillation amplitude of the electron density is smaller in the presence of an external magnetic field than in the field-free region because most electrons are trapped by the magnetic field lines.
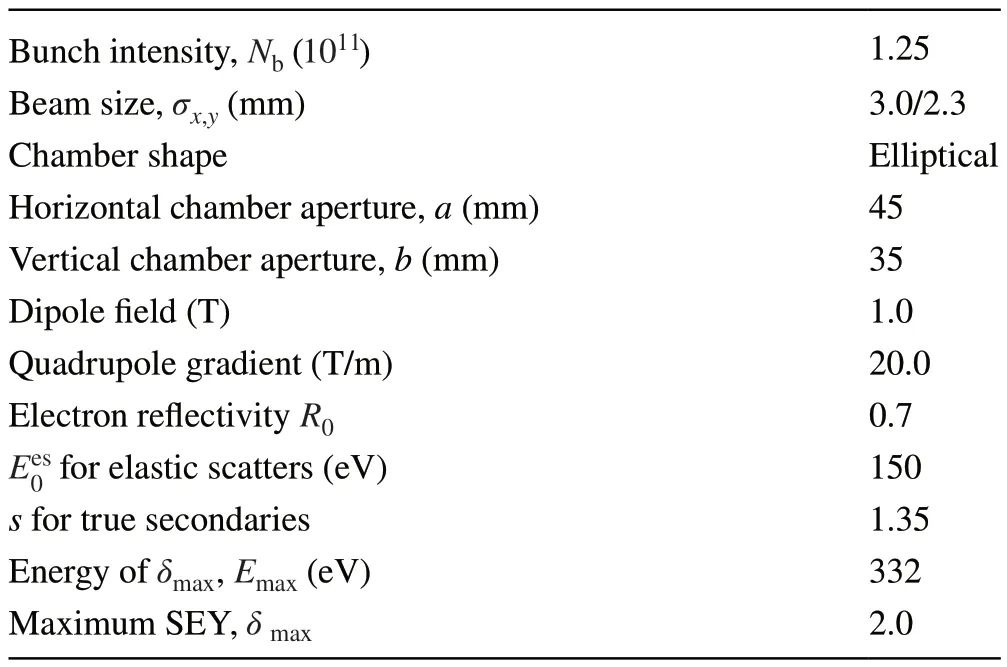
Table 2 Numerical parameters used for electron cloud simulations

Fig.8 (Color online) Comparisons of the evolution of the electron line density in the drift, dipole, and quadrupole regions.The results are obtained by PyECLOUD (solid lines) and GOAT (dashed lines).The electron line density in the quadrupole region is halved
Figure 9 shows the electron spatial distribution exported from GOAT in the dipole region just before the bunch arrival.Similar to other studies, vertical stripes are formed in the horizontal direction in the presence of a dipolar magnetic field [6, 7].In Fig.10, comparisons of the transverse phase space and corresponding histograms of the two codes are shown.In the horizontal direction (Fig.10a), the electron distribution is figure 8 shaped.The central density is relatively low.Almost all the electrons gather in the range of two stripes.The velocity distribution of the cloud is Gaussian-like, and the electrons are nearly static.In the vertical direction (Fig.10b), however, the electrons are distributed over the chamber since the motion is unconstrained.At the same time, it can be noted that the electrons are highly concentrated near the chamber wall, which is a significant feature of a saturated cloud.The electrons in the vicinity of the chamber wall form a potential barrier to prevent the energetic electrons from hitting the pipe and producing secondary electrons.The vertical velocity component is sharper than the horizontal one, and the value is approximately an order of magnitude higher.The comparison shown in the histograms further confirms the consistency between PyECLOUD and GOAT.

Fig.9 (Color online) Snapshot of the electron distribution in the dipole region before the bunch arrival at the cloud saturation stage
5.2 Beam‑cloud interaction
Two quantities are required due to the electron pinch as the bunch passes through in modeling the beam-cloud interaction using the linearized method: the generalized 2D dipolar wakefield [33–35] and the longitudinally varied betatron tune shift [32, 36].The dipolar term is first discussed.When an on-axis bunch passes through a cloud, the electrons are attracted toward the axis and the centroid of the cloud does not move.However, the situation changes if a small transverse offset is introduced to the bunch.When the displaced bunch passes through a cloud, the cloud is redistributed and begins to oscillate.Then, the subsequent portions of the bunches are deflected.Therefore, to obtain the dipolar wakefield, the bunch is sliced longitudinally, and a transverse offset is added to the driving slice.The dipolar wakefield generated by the driving slice can be computed for the subsequent testing slices via [35]
whereLdenotes the length of the cloud,Ex,ythe electric field averaged over the particle distribution, Δ the transverse offset attached to the driving slice containingNparticles,and the subscriptiandjare, respectively, the driving and the testing slices.Instead of depending on the relative distance between theith driving slice and thejth testing slice only, the dipolar wakefield produced by the electron cloud depends on two longitudinal positions simultaneously as a result of the electron pinch.For example, in the field-free region, by changing the position of the driving slice along the slice sequence, the generalized dipolar wakefield can be obtained, as shown in Fig.11.z>0 corresponds to the bunch head.The electron distribution used in the simulation is extracted from the dedicated build-up simulation described in the previous section.The transverse offset is 10% of the vertical beam size.Longitudinally, a Gaussiandistribution with nominal bunch length is used.The bunch is cut into 50 slices within the range of ( −4σz, 4σz), whereσzis the rms bunch length.It is worth noting that for the purpose of reducing the numerical noise in the simulation,the electron distribution is created by merging ten realistic distributions at the same time step just before the bunch arrival.Moreover, a set of reference “driving slice”groups without attached initial transverse offset is established in each simulation, which has the same distribution as the beam and is used as the base of the numerical noise.

Fig.11 (Color online) The generalized 2D dipolar wakefield generated by the electron cloud in the field-free region.z > 0 means the head of the bunch.The realistic distribution of electrons from dedicated buildup simulation is used
As shown in Fig.11, the consequences of the electron pinch are significant.The generalized dipolar wakefield does not satisfy the translational invariance.This is a basic property of the conventional electromagnetic impedance.The generalized wakefield peaks at the bunch head at a value of 8 × 10¹⁶VC−1m−1.In contrast to the results reported in [35] with an initially static electron distribution, no significant increase in the wakefield amplitude caused by the electron pinch is observed when a realistic electron distribution is used.This illustrates that the enlargement of the wakefield amplitude is closely related to the electron velocity distribution.
To obtain the betatron tune shift variation along the bunch length, the self-consistent macroparticle tracking method is used.A symplectic expression has been derived for the beam-cloud interaction [37]
where Φ is the electrostatic potential of the cloud.Instead of the typical approaches of including only the transverse part of this map, the complete map is implemented in GOAT.Based on the numerical convergence studies, 20 thin electron cloud elements are uniformly placed around the ring.The beam is represented by 5 × 10⁵macroparticles with 50 longitudinal bunch slices.Fresh cloud distributions with approximately 2 × 10⁶macroparticles at each node are generated and saved at the initialization stage.Again, a realistic electron distribution is used.Between electron cloud elements, the beam is linearly transported in the transverse plane.And the longitudinal motion is frozen to obtain the instantaneous tune spread.
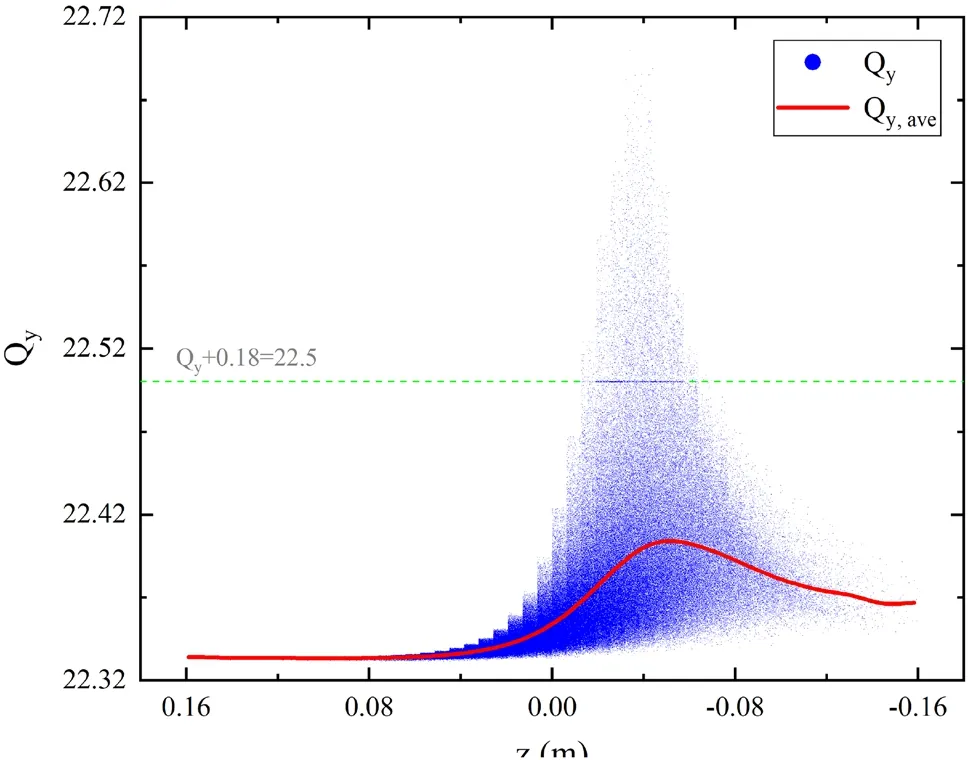
Fig.12 (Color online) Incoherent tune spread (blue dots) of the bunch under the action of the electron cloud force in the field-free region.The varied transversal tune shift in y direction (red line) along the longitudinal position can be obtained by averaging the incoherent tune spread of particles in the slices at each longitudinal position.The half-integer resonance line Qy + 0.18 = 22.5 is shown in green dashed line
In Fig.12, the blue dots represent the incoherent tune spread caused by the electron cloud force.There are several steps in the tune spread distribution, particularly at the bunch head withz>0.This is mainly because the discrete equation of motion is used to integrate the electron motion, and the change in the spatial morphology of the cloud is discontinuous.The tune shift obtained by averaging over the tune spread of particles within the slices at different longitudinal positions is plotted as the red line.The electron pinch effect results in a change in the focusing forces during the bunch passage, and therefore, in the betatron tune modulation with longitudinal coordinates.One can observe that the tune shift increases by a factor of eight from the head to the center of the bunch and then slowly decays toward the tail.In addition,a line parallel to the horizontal axis at ΔQy=0.18 is clearly visible.This is because some particles at the bunch center experiencing very strong cloud-gradient forces and crossing the half-integer resonanceQy+0.18=22.5, as indicated by the dashed green line.
Taking the above results as a wakefield file for the external input, the impedance element can be used to simulate the beam-cloud instability.The cloud-generated dipolar and quadrupolar forces can be modeled by transverse driving and detuning impedance implemented in the impedance element.The impedance element is well benchmarked in Sect.3.The nonlinear characteristics of the beam-cloud interaction are omitted in such a linearized method.However, this method is correct and has advantages obviously in fast and enormous parameter scans [32].
6 Beam‑beam interaction
For colliding beams, the GOAT code describes the electromagnetic interaction of two counter-rotating beams through the 6D symplectic Synchro-Betatron Mapping method [38]:

The calculation sequence of the beam-beam interaction is as follows.The two bunches are first sliced longitudinally using the uniform-charge slicing method implemented in the code, and then the bunches collide sliceby-slice.At each collision step, the particles contained in the slice are drifted from the interaction point (IP) to the collision point (CP) located atS=(z1+z2)∕2 , wherez1andz2are the longitudinal centroids of the two slices.The IGF Poisson solver is used to compute the electric fields generated by the slices according to the current distributions.Subsequently, taking into account the magnetic field and time-of-flight effects, the kick is applied to the particles in the opposite slice.Finally, the particles are transferred back to the IP via the inverse drift operator.In general, the linear interpolation method [39] is applied to calculate the kick for each particle in terms of computational convergence and speed.
In addition, the requirements for the fast separation of the two colliding beams, the overall detector component and interaction region (IR) magnet arrangements strongly depend on a large crossing angle shown in Fig.13.To include the crossing angle in the beam-beam simulation procedure given by Eq.10, which is derived without the crossing angle, the Lorentz boost [40]:

Fig.13 (Color online) Beams colliding at an angle in the original laboratory frame (top) and in the boosted head-on frame (bottom)
can be used to transform the beam particles from laboratory frame to head-on frame.A variable marked with and without a superscript tilde indicates the quantity in the head-on frame and laboratory frame, respectively.The variableθcdenotes the half-crossing angle, and thehhamiltonian,
After collision, the beam particles need to be transformed back to the laboratory frame via inverse Lorentz boost,
Currently, only the ‘strong-strong’model is available in GOAT.
Predicting beam parameters such as luminosity, beam size, and centroid oscillation, studying the dependencies between different parameters, and investigating the role of beam-beam dynamics on the cross-talk of multiple beam dynamics are the main tasks of the beam-beam simulation.In order to check the validity of the beambeam model implemented in GOAT, a set of beam-beam simulations is carried out with and without considering the crossing angle utilizing Athena and GOAT.The beam parameters in Table 1 are used.The luminosity and beam size are shown in Figs.14a and 15.When the two beams collide in the head-on frame, the transverse beam sizes of the proton beam are stable at the design value due to its small beam-beam parameter.For the electron beam,the beam sizes in both the horizontal and vertical directions shrink to slightly smaller values than the design value, which is also why the luminosity is higher than the calculated value.For the collision with a crossing angle of 50 mrad, although the luminosity is reduced by more than six times compared to the head-on collision,the beams are stable, and no significant beam sizes blow up are observed.The transverse beam sizes of protons and electrons are stable around the design values after reaching equilibrium.This indicates that the luminosity degradation is caused by geometric loss.Again, the simulation results given by Athena and GOAT agree very well with each other.

Fig.14 (Color online) a The luminosity evolution in case of collision with and without considering the crossing angle obtained by Athena and GOAT.b The impact of the crab cavity frequency on the luminosity obtained by GOAT
In the EicC conceptual design, the luminosity reduction caused by the crossing angle is compensated by the crab cavity.The transfer map of the crab cavity in thex-zplane for each particle is given by [41],
whereVis the voltage of the crab cavity,ωthe angular frequency of the cavity, andφthe phase of the cavity.The cavity voltage is chosen as:
whereβ∗is the beta function at the IP,βCCthe beta function at cavity location, and Δψthe phase advance between the IP and the cavity.For the proton beam, the higher energy and smaller beta function at the IP lead to a much higher cavity voltage requirement than that for the electron beam.Generally, higher frequencies are preferred for reducing the cavity voltage.Figure 14b shows the luminosity evolution obtained by scanning the crab cavity frequencies at a fixed half-crossing angle of 25 mrad.The luminosity degradation is low since the cavity frequency is below 200 MHz.As the frequency continuously increases, the luminosity degradation becomes higher.This phenomenon can be explained by thex-zdistribution at the IP for different crab cavity frequencies, as shown in Fig.16.Because of the incomplete deflection caused by the crab with a higher frequency (lower wavelength), the head and tail of the bunch are farther offfrom the axis at the IP, resulting in an increase in the overlap area of the two bunches and a decrease in luminosity.In addition, the simulated luminosity over 20000 turns is higher than the design value, even for a cavity frequency of 400 MHz.However, the synchrotron-betatron (SB) resonance may still be excited owing to the longitudinally positiondependent beam-beam kick, causing a reduction in the luminosity lifetime [42].
7 Application of cross‑talk
The physical elements implemented in GOAT are well benchmarked in the previous subsections.Thus, its validity is guaranteed.However, the beam in a real machine cannot be affected by a single effect, and there is cross-talk between different effects.Among the many high-intensity effects in a collider, the beam-beam interaction is one of the most important beam dynamics processes, which has a direct impact on the luminosity and integrated luminosity of the machine.Several instabilities have been observed in previous studies due to the cross-talk between the beam-beam interaction and other intensity-dependent effects [11–13,43, 44].It is necessary to explore the mechanisms of these instabilities and corresponding mitigation measures at the machine design stage.
In this subsection, a numerical example is presented for the cross-talk between the beam-beam interaction and the pRing’s vertical impedance in EicC.To emphasize the importance of cross-talk simulation, three sets of simulations are performed.The first purely includes the effect ofthe pRing’s vertical impedance, the second considers only the beam-beam interaction, and the third considers the selfconsistent treatment of the two effects.The first two sets of simulations are performed in previous subsections, and the results of the evolution of beam parameters are presented here.In the self-consistent simulation, the transverse impedance element, beam-beam interaction element, and transverse and longitudinal linear transportation elements are combined to form a ring.A vertical impedance value of 6 MΩ∕m is chosen, which is below the instability threshold.And the beam-beam interaction is assumed to take place in the head-on frame.Figure 17a and b show the evolution of the beam vertical centroid and emittance for the three cases.It can be observed that below the instability thresholds of TMCI and beam-beam interaction considered alone, a dipole instability arises in the simulation.The vertical centroid grows exponentially, and the emittance blows up.The simulation results suggest that there is no coupling between the coherent beam-beam mode and the longitudinal sideband because the bare tunes of the two beams are different.This is very different from the mode coupling instability for symmetric collisions reported in Ref.[12].It is also worth noting that such a dipole instability does not appear in the horizontal plane.This implies that the observed head-tail type instability is closely related to the hourglass effect, because it is the only major difference between the two transverse planes.Further studies are still required to identify and understand the underlying mechanisms of this coherent instability.
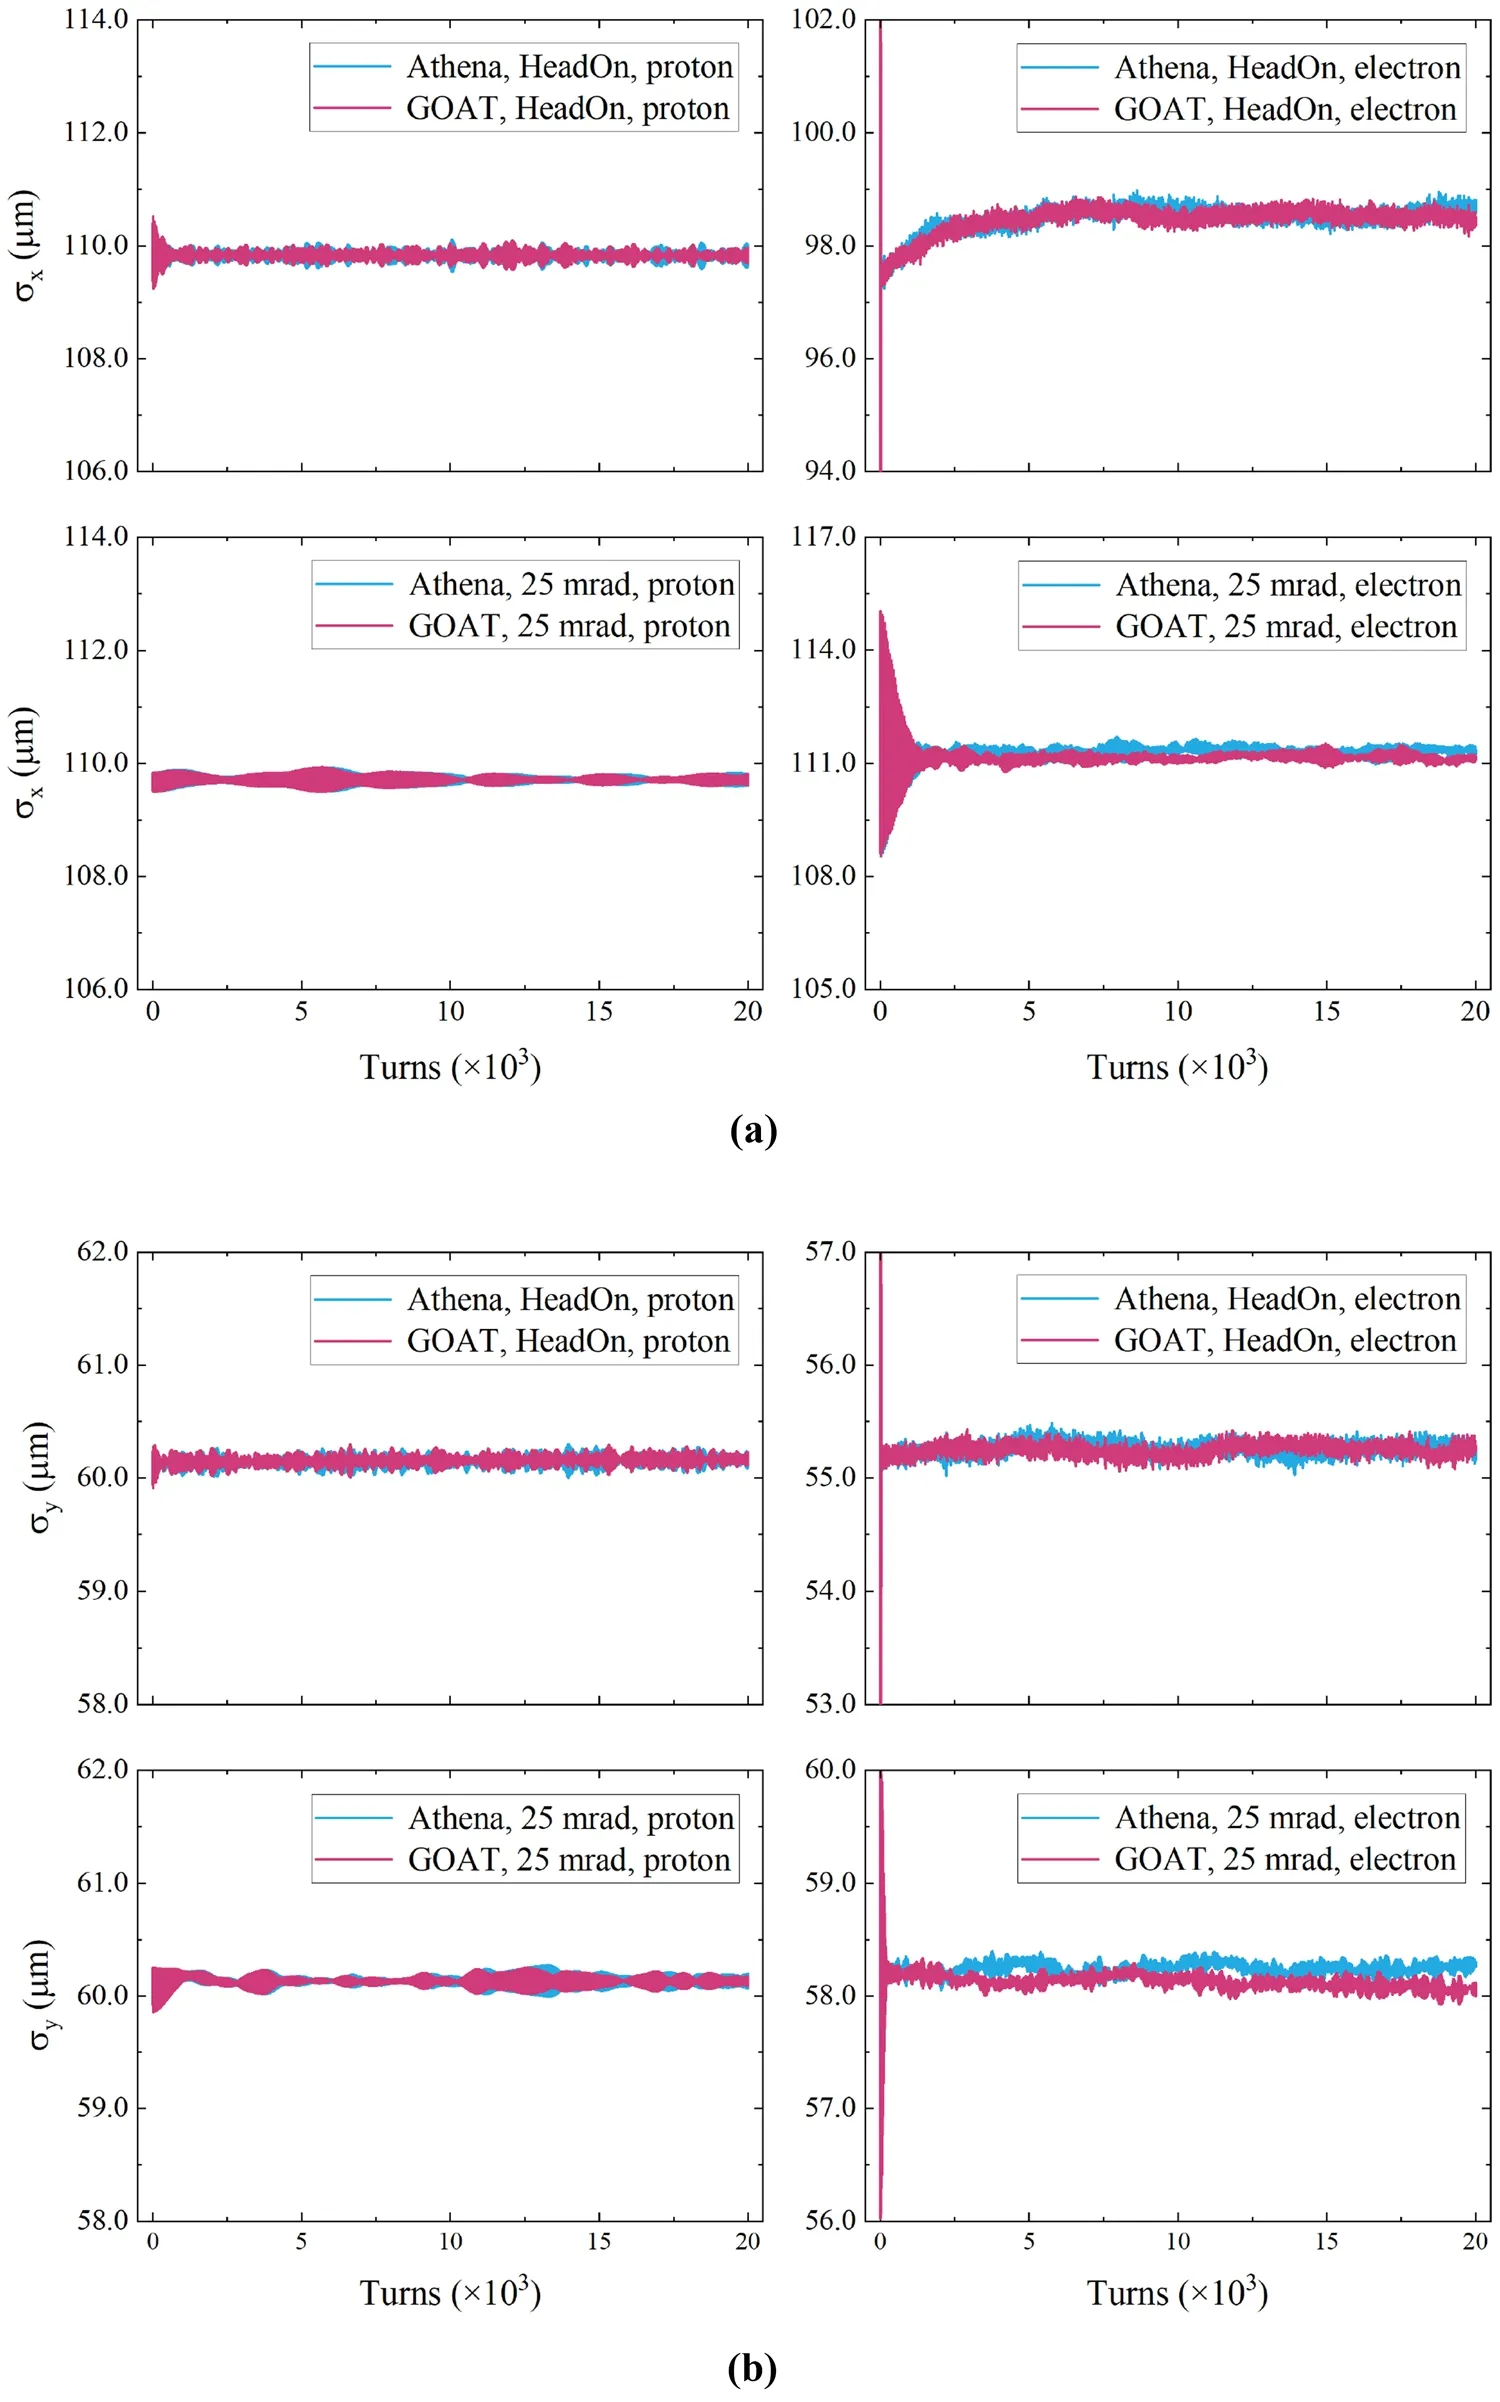
Fig.15 (Color online) The corresponding horizontal (a)and vertical (b) beam sizes of colliding beams for the cases of Fig.13a

Fig.16 (Color online) The x-z distributions of the bunch at IP with different crab cavity frequencies.The axis are normalized to the nominal horizontal beam size and bunch length.The crab frequency is 100 MHz (top left), 200 MHz (top right), 300 MHz (bottom left), and 400 MHz (bottom right)
Obviously, this numerical application indicates the necessity of simulating multiple physical processes in a self-consistent manner.This also demonstrates the flexibility, completeness, and advancement of GOAT.
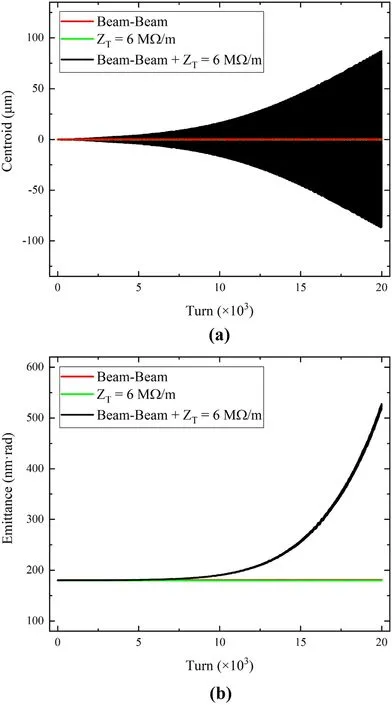
Fig.17 (Color online) Evolution of vertical bunch centroid (a) and emittance (b).Three cases are considered: first is purely beam-beam interaction, second is purely transverse impedance, and third is crosstalk of beam-beam interaction and transverse impedance
In addition, the linear chromaticity and the ideal bunchby-bunch feedback system implemented in GOAT are utilized to suppress this coherent instability.In Fig.18, the instability growth rates for different chromaticity values are presented in the range from − 10 to 10.The growth rates increase and then remain almost constant when the chromaticity values are negative.For positive chromaticity values,non-monotonic growth rate behavior is observed.When the chromaticity value is greater than eight units, the instability is fully suppressed.Then, the ideal bunch-by-bunch feedback system is employed to damp the instability.The evolution of the vertical centroid and emittance for different damping rates are presented in Fig.19a and b, respectively.Compared to chromaticity, the feedback system is more effective in suppressing this instability.It can be seen that the dipole motion is suppressed, and the emittance is conserved, even though the damping rate is very small.This can be explained by Fig.20, which illustrates the intra-bunch motion of the proton beam extracted from the simulation in successive turns.The most unstable mode is the 0-mode and the bunch-by-bunch feedback can eliminate the oscillations of the bunch as a whole.
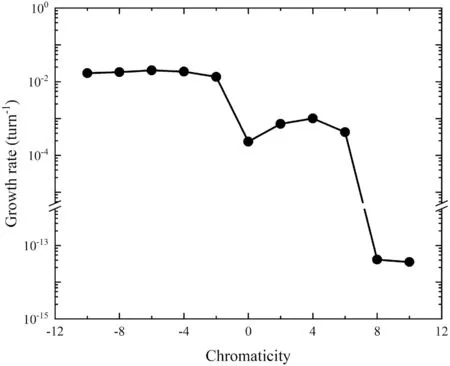
Fig.18 The impact of chromaticity on the growth rate of coherent instability
8 Summary and outlook
In this paper, a simulation code, GOAT, is developed for single-bunch high-intensity beam dynamics.It can be used to simulate all intensity-dependent effects in the pRing of the EicC project.The code architecture and numerical model are introduced.Four simulation examples, including impedance induced collective instability, space charge effect, electron cloud effect, and beam-beam interaction, are conducted based on abundant elements and the flexible numerical models provided by GOAT.The results are well benchmarked with other codes and theories.In addition to separate simulations, an application is presented for cross-talk between the beam coupling impedance and the beam-beam interaction.The comprehensiveness and correctness of GOAT are verified.The Python program coded by the OPP technology ensures the scalability of GOAT as well as the independence of the modules.Different effects can easily be integrated into the code.GOAT can also be used to simulate the intensity-dependent beam dynamics in other accelerators and colliders.In the future, it is planned to improve the performance of the GOAT code, including algorithm optimization and hardware support(such as parallelization based on GPU (Graphic Processing Unit)).With the help of parallelization techniques, GOAT can be upgraded to include the multi-bunch beam dynamics.
Appendix A: Estimation of the code performance
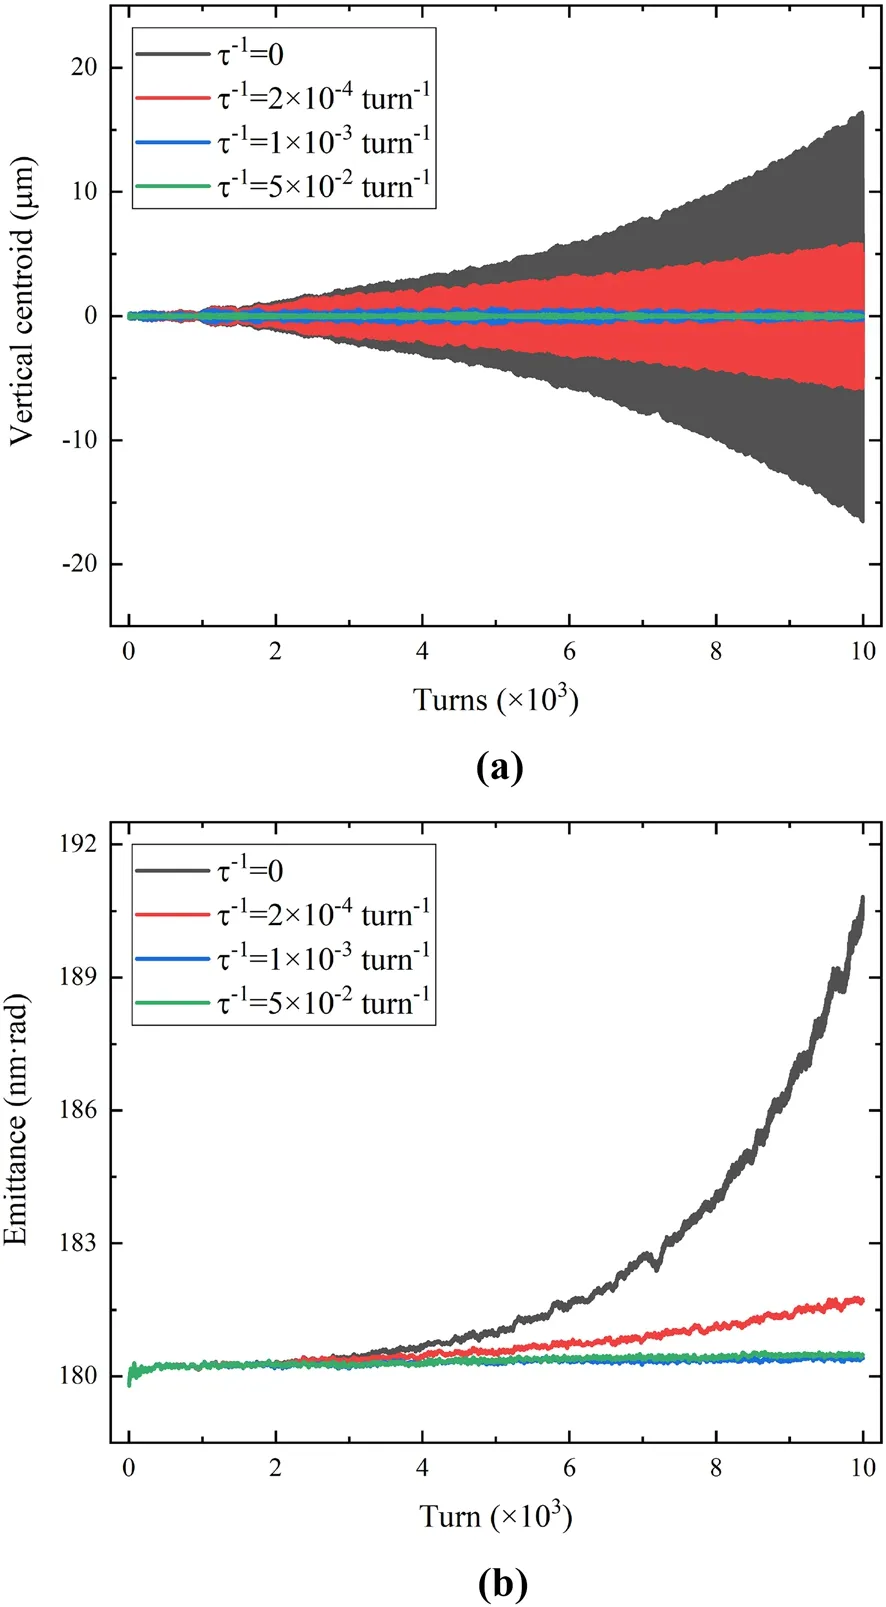
Fig.19 (Color online) The impact of ideal bunch-by-bunch feedback system on the coherent instability.The evolution of vertical bunch centroid (a) and emittance (b) with different damping rates
The code performance is a crucial aspect of simulation software.Due to the abundant physical modules implemented in GOAT, a substantial number of numerical parameters contribute to the computational speed.Therefore, three typical quantities, namely the number of macroparticles, slices, and mesh grids in the field solver,are selected as test quantities.Table 3 summarizes the performance of all modules mentioned in the paper.All tests are run on Intel(R) Core(TM) i9-9900K CPU @ 3.60GHz(RAM 16.0 GB) adopting single-core and single-thread.Some notes are attached to the test results.(1) The slicing is performed on the ring in the simulations of space charge effect and electron cloud build-up, while on the beam for the other three simulations.(2) The saturated electron cloud is usually established after the passage of multiple bunches within one revolution period, thus the time spent for each bunch passage is used to describe the elapsed time of the electron cloud simulation.Also, it is more intuitive and convenient to use the time step corresponding to eachslice to describe the number of slices used in the electron cloud effect simulation.(3) As mentioned, in electron cloud simulations, the number of electron macroparticles and the amount of charge carried by each macroparticle are constantly changing due to secondary electron production, and there is no fixed number of macroparticles.Two typical preset values given by the user during the initialization stage are used.The first number indicates that:when the number of macroparticles exceeds this value,the coordinates and charges of all particles are mixed and regenerated, and the meaning of the second number is: the total number of macroparticles after regeneration.
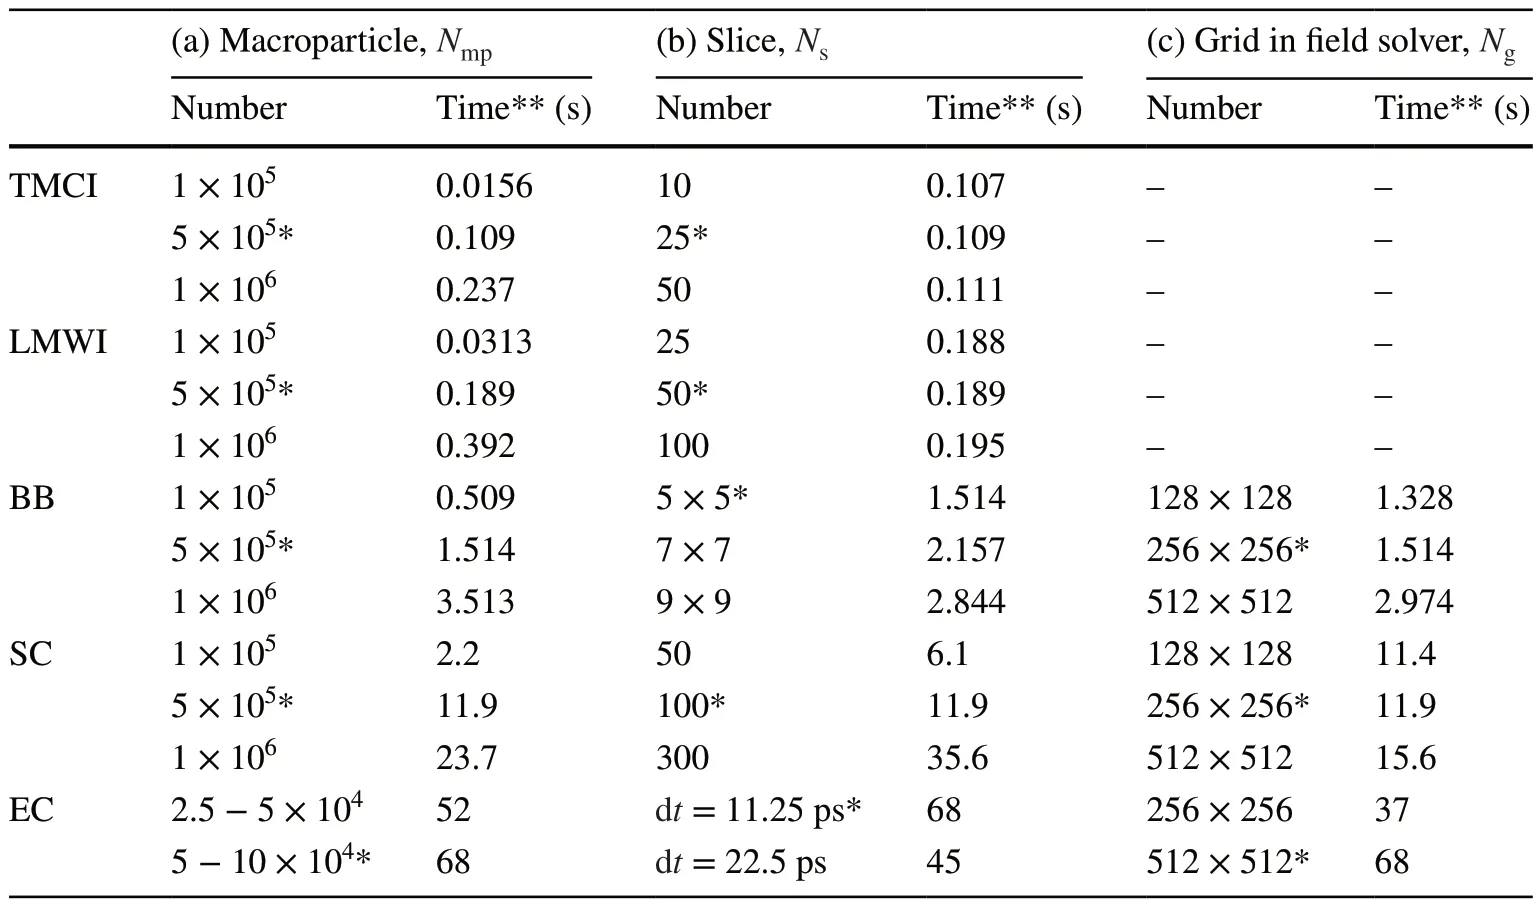
Table 3 The computation performance of each physical module under different numerical parameters

Fig.20 Intra-bunch motion for successive 100 turns of proton beam extracted from the cross-talk simulation.(Color figure online)
For impedance induced collective effects, the main limitation comes from the number of macroparticles; for other effects, the increase in all three test quantities significantly increases the computation time.
AcknowledgementsThe authors would like to thank Dr.W.W.Ge for a careful reading of the manuscript and helpful discussions and suggestions.
Author contributionsAll authors contributed to the study conception and design.Material preparation, data collection, and analysis were performed by Lei Wang, Jian-Cheng Yang, Ming-Xuan Chang, and Fu Ma.The first draft of the manuscript was written by Lei Wang and all authors commented on previous versions of the manuscript.All authors read and approved the final manuscript.
Data availabilityThe data that support the findings of this study are openly available in Science Data Bank at https:// doi.org/ 10.57760/ scien cedb.j00186.00067 and https:// cstr.cn/ 31253.11.scien cedb.j00186.00067.
Conflict of interestJian-Cheng Yang is an editorial board member for Nuclear Science and Techniques and was not involved in the editorial review, or the decision to publish this article.
Competing interestsAll authors declare that there are no competing interests.
杂志排行
Nuclear Science and Techniques的其它文章
- Resolution analysis of thermal neutron radiography based on accelerator‑driven compact neutron source
- Simple synthesis of silver nanocluster composites AgNCs@PE‑g‑PAA by irradiation method and fluorescence detection of Cr3+
- Photonuclear production of nuclear isomers using bremsstrahlung induced by laser‑wakefield electrons
- High‑precision high‑voltage detuning system for HIAF‑SRing electron target
- Decomposition of fissile isotope antineutrino spectra using convolutional neural network
- Searching for QCD critical point with light nuclei
