Microwave absorption properties of carbonyl iron-based paint coatings for military applications
2023-05-06WojciechPrzyyAdmJnuszkoNorertRdekMrcinSzczepnikKrzysztofBogdnowiczIreneuszPlenkiewiczBogusSzczodrowskRoertMzurczuk
Wojciech Przyył ,Adm Jnuszko ,Norert Rdek ,Mrcin Szczepnik ,Krzysztof A.Bogdnowicz ,Ireneusz Plenkiewicz ,Bogusłw Szczodrowsk ,Roert Mzurczuk
a Military Institute of Engineer Technology,ul.Obornicka 136,Wrocław,50-961,Poland
b Kielce University of Technology,Faculty of Mechatronics and Mechanical Engineering,Al.1000-lecia P.P.7,Kielce,25-314,Poland
Keywords:Radar Attenuation Carbonyl iron Coating Camouflage
ABSTRACT The paper explores the possibilities of using carbonyl iron in the form of a powder for the manufacture of radar-absorbing paints — reducing the radar signature of the objects that they cover.The attenuation values in the range of 4—18 GHz for various coating thicknesses,ranging from 0.5 to 2.00 mm with 0.5 mm increment,and for different absorber content -75% and 80%,as well as the use of two different binders in the form of epoxy resins with hardeners,were investigated.For the frequency of 18 GHz and a 1.5 mm thick coating with a 75%absorber content,Epidian 112 resin and Saduramid 10/50 hardener used as a binder,and the maximum attenuation level obtained equalled 20.2 dB at 16 GHz.Additionally,the absorber particle size ranging from 3 to 4 μm and its higher mass content resulted in achieving the reflection loss above-12 dB in the entire 8—12.5 GHz range for layers between 1-and 1.5 mm thickness.The qualitative assessment of the tested samples in the context of camouflage in the radar range was also performed,using statistical analysis.
1.Introduction
One of the vital capabilities of the modern battlefield is to conceal the actions of one's forces and prevent the adversary from being aware of them [1].This is done in several ways,including observation with the use of radar systems.Commonly,radars are labelled by their characteristic wavelength or frequency band in which they function according to the band designations based on IEEE standards.The bands widely used in military technology include the C(4—8 GHz),the X(8—12 GHz)and the Ku(12—18 GHz)bands.Therefore,the focus in the paper is on wave absorbers,which,when applied in the form of thin paint coatings onto military equipment,would exhibit electromagnetic wave attenuating properties in the microwave range 4—18 GHz.To meet these requirements,materials in a form of the coated layer were tested for high attenuation in terms of the relative permittivity and permeability,and the impedance of the absorption layer compared to the impedance of free space [2].Additionally,the change of attenuation as dependent on the radiation frequency had to be investigated.
Currently,various materials are used as microwave absorbers(radar-absorbing materials),including metals,such as aluminium sheets[3],electroplated nickel coatings[4]or nickel-iron alloys[5].However metals,apart from their high magnetic permeability,which is a highly desirable property,are characterized by a very high reflectance,which makes them of little use as radar-absorbing coatings.Also,the non-metals can play the role of efficient absorbers,such as carbon in its electricity-conducting allotropes,e.g.graphite [6],graphene [7],aerogels [8,9],nanotubes [10],nanofibers [11]or flakes [12].Also,composites consisting of ferromagnetic materials and conductive non-metals are characterized by high microwave absorption.These include e.g.iron and nickel alloys in form of powders and carbon nanotubes [13],or iron and graphene nanoparticles[14].Other examples include ceramics[15],but only those with ferromagnetic properties,e.g.magnetite [16].However,due to very low conductivity,these materials are not suitable as microwave absorbers on their own,and therefore they are used as an element of composite structure enriched with conductors,i.e.metals [17],carbon [18],metal oxides [19],or conductive polymers [20].Also,the non-conductive polymers are used to reduce the microwave background,rather than as a matrix for other absorber material to form a vehicle coating [21],As an absorbing additive to polymer matrices improving the conductivity of whole layer flake carbonyl iron powders (FCI) can be used [22].
In this research,the absorption coating model was adopted as a system of two adjacent layers: metal and a lossy layer with a thicknesss,for which the reflection coefficient(Γ)is equal to 0,and the wave impedance (Zn) equals 1.The relationship between the wave impedance Γ and the reflection coefficientZnis expressed by Eq.(1).
For a flat wave,it was assumed that
where λ is the wavelength in free space,εr(f)=ε’(f)—j∙ε”(f) and μr(f)=μ’(f)—j∙μ”(f) are complex permittivity and magnetic permeability,respectively,and j is the imaginary part
Having the above equations in mind,the measured reflection loss(RL)of incident EM wave for single-layer absorber compared to the reference aluminium plate can be calculated as
This paper contains the study of a radar-absorbent paint,with a focus on the investigation of electromagnetic attenuation in the 4—18 GHz range.The commercially available carbonyl iron,a permeable and permissive ferromagnetic material,was selected as the absorbent.The nanostructure of carbonyl iron composed of magnetic dipoles,as well as the electric polarizability of iron,interact with the magnetic and electric fields of the radiation source,which fosters radiation absorption.With sufficiently thin paint layers produced using carbonyl iron,such parameters should promise good attenuation properties.Therefore,two paint systems based on two different epoxy resins with 75 and 80% w/w iron carbonyls content were tested.Coatings of varying thickness:0.5 mm,1 mm,1.5 mm,and 2 mm,were manufactured with the use of these compositions.In the final stage,the coatings’ attenuating properties were tested under laboratory conditions.
2.Materials and methods
2.1.Materials
For this study,the iron powder was obtained as the result of the thermal decomposition of iron carbonyl (Fig.1) and manufactured by the German chemical company BASF under the trade nameCarbonyleisenpulver EB(designated as EB) was selected as the absorber.The EB absorber was a grey powder with a faint ammonia odour.The melting point and boiling points were 1535°C and 2730°C,respectively,with a flash point above 100°C and a specific weight of 76.518 N/m3[23].The selected parameters of the EB carbonyl iron are presented in Table 1.

Table 1 Selected absorber composition.
Two sets of resins were used in the study.Set No.1 consisted of Shell Epikote 828 resin characterized by the following parameters:viscosity (25°C) 12—14 Pa s;epoxy group content of 5260—5420 mmol/kg,the density of 1.16 g/ml at 25°C,flash point -over 150°C;Ancamine 1618 hardener with the following parameters: viscosity of 0.300—0.600 Pa s (at 25°C),amine value equal 260—285 mg KOH/g,the average active equivalent weight of 115,the exothermic peak of 90°C,recommended use level of 60 ns,and gel time of 90 min(150 g mixed at 25°C).The formulation also included additives produced by Amepox Microelectronic Co Ltd.company:AX-R to reduce viscosity,and AX-S to improve plasticity.Set No.2 consisted of Epidian 112 epoxy resin (epoxy number 0.1—0.13 val/100 g)with Saduramid 10/50 polyamide hardener.The parameters following the mixing of Epidian 112 resin and Saduramid 10/50 hardener were the following:viscosity of 0.450—1 Pa s(at 25°C);usability of 6 h(at 25°C);dust-free time of 6 h max(at 25°C),the total drying time of 24 h max.;dielectric strength after hardening at 120°C (kV/mm),resistance to cracking when subjected to bending around a 1 mm mandrel,and binding agent content of 60 ±2%.
2.2.Paint preparation
Three components were prepared for the manufacture of paints:liquid phase A,the absorber,and liquid phase B.For paints utilizing Set No.1,liquid phase A consisted of Shell Epikote 828 resin (100 parts by weight),AX-R viscosity-reducing agent (10 parts by weight) and AX-S plasticiser (7 parts by weight).EB carbonyl iron was used as the absorber,whereas liquid phase B consisted of Ancamine 1618 chemical hardener.For all the paints,the weight ratio of the liquid phase A to the liquid phase B was 10:5.2.For the paints utilizing Set No.2,the liquid phase A consisted of Epidian 112 epoxy resin(100 parts by weight),the absorber -the EB carbonyl iron and the Saduramid 10/50 hardener (90 parts by weight).
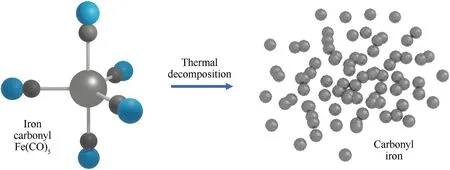
Fig.1. Graphical representation of carbonyl iron preparation via thermal decomposition of iron carbonyl Fe(CO)5.
The ingredients were mixed using a mechanical stirrer with a speed of 3000 min-1for about 10 min or until a homogeneous consistency was obtained.The paint was ready for use within 20 min and spread easily.Fig.2 and Fig.3 show each step of the paint manufacture process for Set No.1 and Set No.2,respectively.
The paint samples were applied with a special applicator (Set No.1) or with a paintbrush (Set No.2) onto an aluminium plate surface with dimensions of 300×300×4 mm3,which constituted reference coating for radar measurements.Fig.4 presents the method of applying the coatings.After the paint coatings had dried,their thickness was measured using a coating thickness gauge and left for hardening.
For the study,the authors recorded experimental attenuation test results obtained for 4 paint formulations (see Table 2) in the range of 4—18 GHz Each composition was applied in a form of layers with 0.5 mm,1.0 mm,1.5 mm and 2.0 mm thicknesses onto an aluminium plate with dimensions of 300×300×3 mm3.Carbonyl iron with spherical particle sizes 3—4 μm(BASF Aktiengesellschaft,Carbonyleisenpulver EB — marked as EB) was used as an electromagnetic radiation absorber.All the tested samples revealed the attenuation properties characterized by one dominant maximum and with a shape similar to that of the Gaussian curve.

Table 2 Paint formulations prepared.
3.Methods
Microwave attenuation studies were performed using a PR-17 CXKU reflectometer (Millimeter Wave Technology INC,Marietta,USA).The device enables recording of the intensity of the incident wave reflected from the tested sample for selected frequencies and comparing it with the intensity of the wave reflected from a reference flat aluminium plate.The result is given in dB.Measurements were taken in the frequency range of 4—18 GHz with an accuracy of 10 MHz.The measurement uncertainty of the dynamic range determined during the calibration was 0.7 dB for the entire measuring range.The testing bed consisted of a reflectometer equipped with two horn antennas: the transmit-and the receive one (located at a distanceL=21.3 cm away from the sample) and supports made of a dielectric.The data from the examination were recorded on the computer[24](Fig.5).

Fig.2.Manufacture of Set No.1 paint: (a) Liquid phase A preparation;(b) Addition of carbonyl iron absorber;(c) Manufacture of the paste.
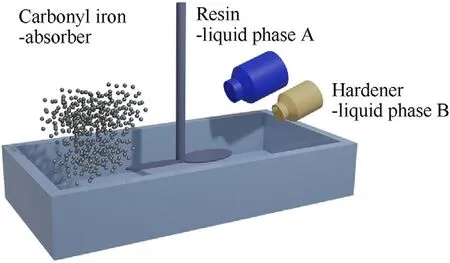
Fig.3.One-step manufacture of Set No.2 paint.
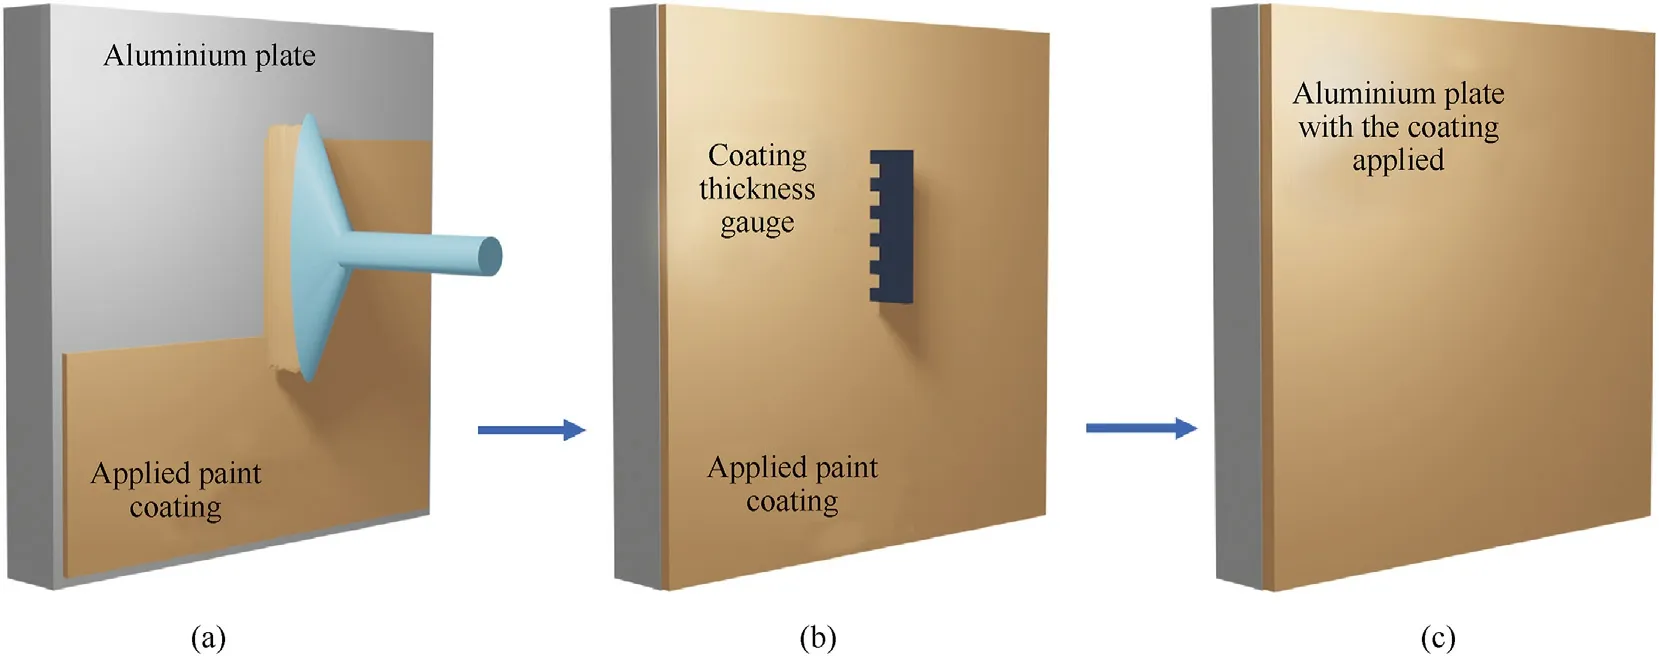
Fig.4.Process of applying paint onto an aluminium plate: (a) Paint application;(b) Coating thickness measurement;(c) Coated plate ready to dry.
To compare and normalize indication of one universal supreme attenuating formulation for the frequency range of 4—18 GHz,as defined by the absorber content,coating thickness and(Fig.6)type of binder used,a statistical analysis was conducted relative to samples that meet the following conditions:
(1) Attenuation exceeding 12 dB;
(2) Maximum attenuation in the frequency range of 8—12 GHz(X-band).
4.Results and discussion
In the first step including the paint formulations’preparation,a high proportion of absorber in the paint was used to ensure high attenuation what unable preparation of all paints in a single step.The crucial parameters such as appropriate viscosity and adhesiveness need to be considered for applicability reasons.This was the reason for the selection of low-molecular epoxy resins as the matrices.Two different sets of resin and additives were used in the research.Set No.I included Shell Epikote 828 epoxy resin and the AX-R and AX-S additives as viscosity reducing agents and a plasticiser,respectively,and Ancamine 1618 as a hardener.Whereas,the second set included Epidian 112 epoxy resin and Saduramid 10/50 hardener only.For the first set,resins with low initial viscosity were selected,since the increase in the absorber content causes an increase in viscosity,hence the need to use additional ingredients to improve the final properties of the paste.For resins of this type,the absorber content could slightly even exceed 80%.Further increase of the EB carbonyl iron content (above 85%) resulted in high viscosity of the product,which made it impossible to apply as thin layers.The second set of resins was a simple two-component system consisting of a resin and a hardener.For the tests,both for Set No.1 and No.2,paint formulations with two different EB carbonyl iron(absorber) percentages: 75% and 80% were used.
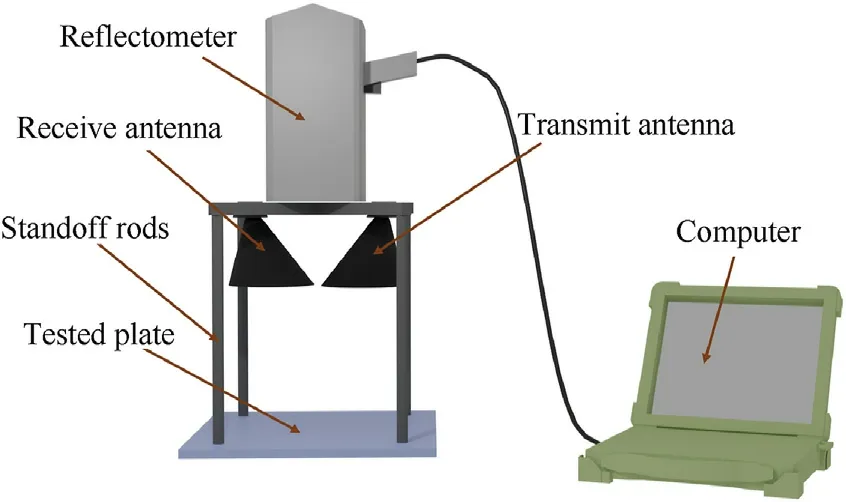
Fig.5.Testing setup.
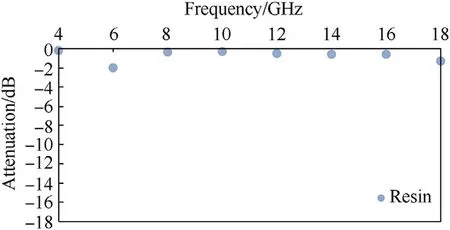
Fig.6.Attenuation of the sample containing resin only (no absorber).
Preparation of paints for Set No.1 consisted of three stages.The first stage included the manufacture of liquid phase A comprising resin and AX-R and AX-S additives,reducing the viscosity and improving plasticity,respectively.In the paint manufacture process,the absorber was added at the second stage by dispersing appropriate portions of iron(in powder form)in the liquid phase A.This mixture took the form of a paste which could be stored in tightly closed containers for up to 1 year,which was confirmed via accelerated ageing tests.The last step involved adding the hardener to the mixture and stirring it until a homogeneous consistency was obtained.The paint fabricated in this manner was ready to be used within 20 min.
The preparation of paints for Set No.2 was limited to mixing the components in the appropriate proportions — resin,absorber and hardener,taking the required time between the addition of individual components,thus ensuring the homogeneity of the mixture.
4.1.Attenuation in radar range
Each paint was applied in coatings of four different thicknesses:0.5 mm,1 mm,1.5 mm and 2 mm.The thickness of the liquid product was additionally measured with the help of wet film thickness gauges.In accordance with Beer's law,the examination of coatings of different thicknesses was to provide information on the effectiveness of camouflage,while maintaining the same absorber percentage.The first step was to conduct tests of paint with no absorber added as a control sample.The 1 mm thick layer showed a maximum attenuation level of-2 dB for a narrow frequency range,with a maximum at 6 GHz and around 18 GHz,proving that matrix material has neglectable attenuation.
The attenuation performance of coatings prepared by paints based on the Shell Epikote 828 epoxy resin and the absorber content of 75% w/w,for various thicknesses: 0.5 mm,1 mm,1.5 mm,2 mm,are illustrated in Fig.7.The best result was obtained for the thickest layer,where the attenuation level was above -18 dB,but the attenuation maximum was below 4 GHz.This was unacceptable for the tested application being very close to the lower level in the radar range.The remaining paint layer thicknesses showed attenuation in the desired range,with a maximum located between 9 GHz and 9.5 GHz.As would be expected,the lowest level of attenuation was observed for the thinnest layer of 0.5 mm and that was -7 dB,which is almost 3 times higher than that of the resin alone.This confirms good alignment with Beer’s law concerning the relation between the increase of the absorption level with increasing thickness.The results for 1.0 mm and 1.5 mm thick layers were -12 dB and -13 dB,respectively.
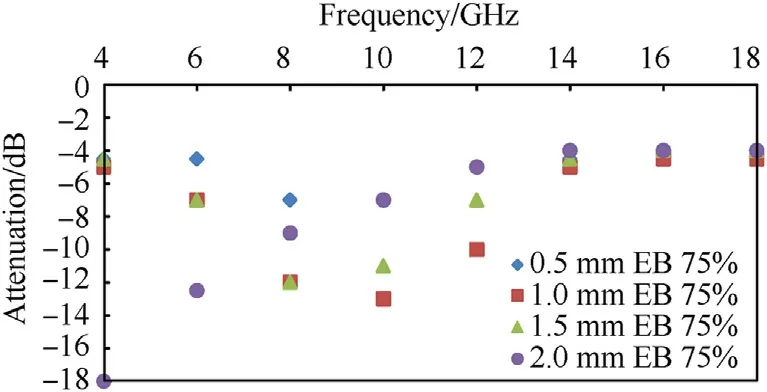
Fig.7.Attenuation for paint with 75% EB absorber content and different coating thicknesses — resin Set No.1.
Afterwards,measurements were performed for the same resin system,but with an increased amount of absorber,i.e.80%.w/w(see Fig.8).In this case,the lowest attenuation was noted for the thinnest layer,amounting to approx.-6 dB with a maximum above 18 GHz,therefore outside the range the authors were interested in.For the remaining (1.0 mm,1.5 mm and 2.0 mm thick) layers,attenuation levels were achieved at -10 dB,-12.5 dB and-14 dB,respectively,with a maximum of 14—18 GHz,10 GHz and 8.5 GHz,for increasing thickness.With the increase of the layer thickness,a dependence of the change of the maximum value towards lower frequencies was also noticed.
In order to investigate the impact of the absorber content on the attenuation,measurement results for the same coating thicknesses,but with a different absorber percentage,were compared in pairs.For a thickness of 0.5 mm (Fig.9) in the studied frequency range,the coating with a smaller absorber content(75%)achieved higher attenuation -7 dB than the coating with a greater (80%) content,equalled -6 dB.In addition,the absorber percentage also affected the locations of the attenuation maximum,which for the thinner layer appeared around 9 GHz,while for the higher absorber content it exceeded the upper limit (>18 GHz).Therefore,the distance between the attenuation peaks of both coatings was estimated to be at least 8 GHz.
For 1 mm thick coatings(Fig.10),higher maximum attenuation values were observed,for 75% of the absorber content amounted to -13 dB,and located at around 9 GHz,while for 80% it reached 10 dB at approx.14 GHz.
Increasing the thickness of the coatings further,to 1.5 mm(Fig.11),did not increase the maximum attenuation value giving-12 dB for the sample with a 75%absorber content,and did not shift the location of the maximum attenuation(approx.8 GHz).increased absorber content,slightly increased the maximum attenuation value to -12.5 dB and shifted towards lower frequencies(10 GHz),thus giving 2 GHz of difference.
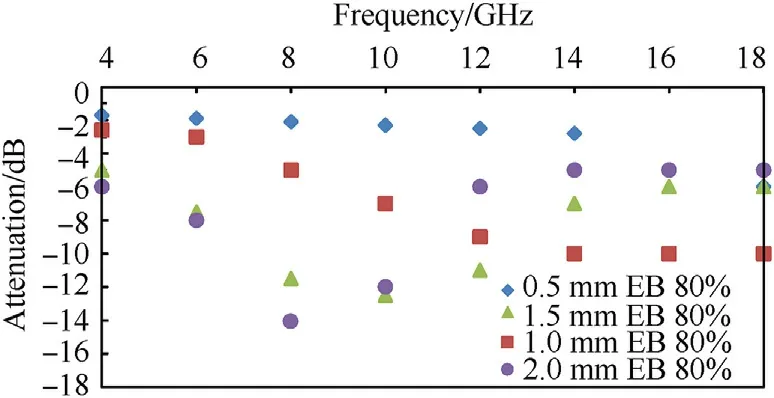
Fig.8.Attenuation for paint with 80% EB absorber content and different coating thicknesses — resin Set No.1.
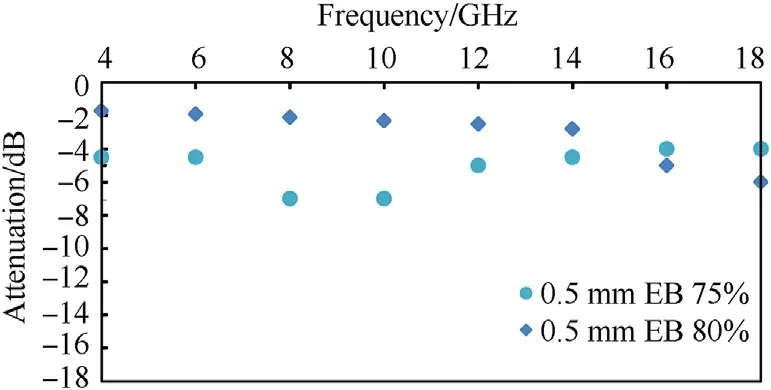
Fig.9.Impact of absorber on attenuation for a 0.5 mm thick coating —resin Set No.1.
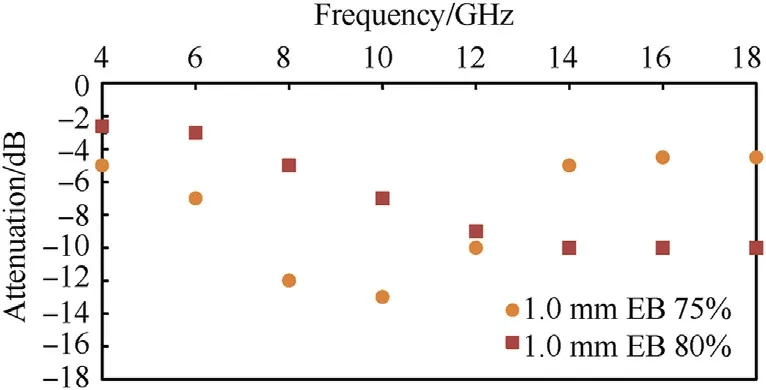
Fig.10.Impact of the absorber on attenuation for a 1.0 mm thick coating — resin Set No.1.
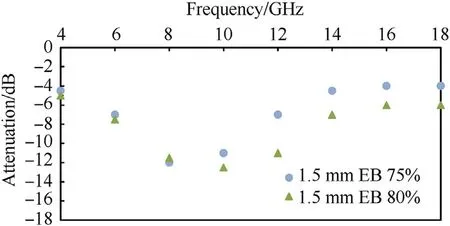
Fig.11.Impact of the absorber on attenuation for a 1.5 mm thick coating — resin Set No.1.
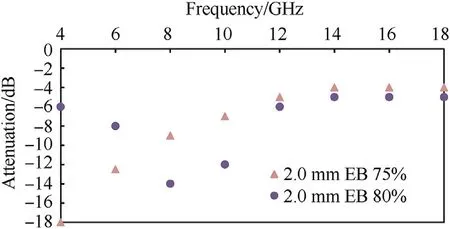
Fig.12.Impact of the absorber on attenuation for a 2.0 mm thick coating — resin Set No.1.
For the thickest of the tested coatings — 2 mm (Fig.12) — the maximum attenuation in the case of 75% absorber content exceeded the lower limit of the measuring range (4 GH),it reached -18 dB,and in the case of the sample containing 80% EB the value was -14 dB maximum located at 8 GHz.
Differently form the Set No.1,for Set No.2 (coatings based on Epidian 112 epoxy resin and Saduramid 10/50 hardener) and the absorber content of 75%w/w(Fig.13),the highest attenuation was recorded for the 1.5 mm layer,for which it exceeded 20 dB for 17 GHz.
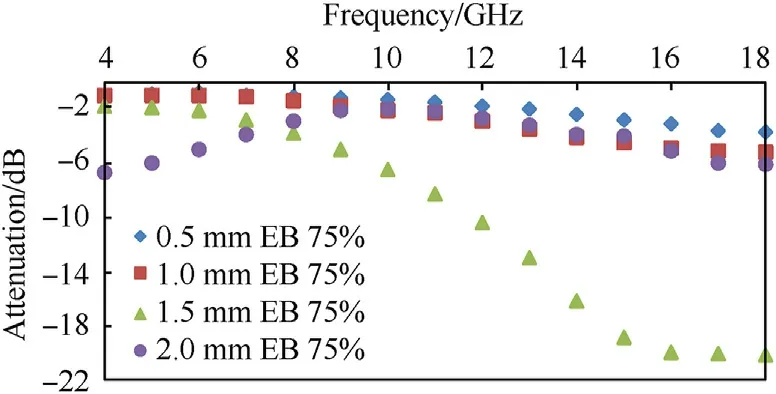
Fig.13.Attenuation for paint with 75% EB absorber content and different coating thicknesses — resin Set No.2.
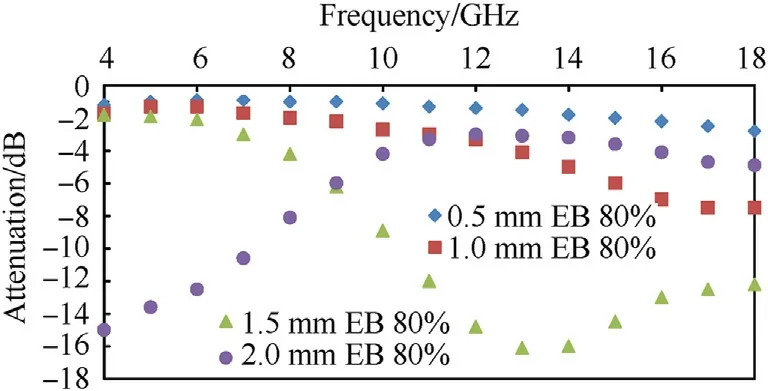
Fig.14.Attenuation for paint with 80% EB absorber content and different coating thicknesses — resin Set No.2.
Then,measurements were performed for the same frequency range(4—18 GHz)and the same resin system but with an increased amount of absorber — 80% w/w (Fig.14).The highest attenuation of-16.1 dB was once again achieved for the 1.5 mm thick coating,with a maximum of around 13 GHz.The thickest layer(2 mm)had the maximum attenuation value outside the lower limit of the measuring range(4 GHz),where it reached the-15 dB.The 0.5 mm and 1 mm thick coatings had their maxima fell outside the measuring range,above 18 GHz,for which those coatings reached -2.8 dB and -7.5 dB,respectively.
Similarly,as in the case of Set No.1,the lowest attenuation level for the second set was noticed for the thinnest,0.5 mm layer.It was equalled -2.8 dB for 80% absorber content and -3.7 dB for the absorber comprised 75%(w/w)of the absorber,which nonetheless is more than twice as high as the value recorded for the resin itself.A tendency towards the transposition of the maximum value towards lower frequencies with increasing layer thickness was observed.
In order to analyse the impact of the absorber content on the attenuation,this time for Set No.2,the measurement results for the same coating thicknesses,but with a different absorber content,were presented in pairs.For the 0.5 mm thickness (Fig.15) in the studied frequency range,the coating with a lower absorber content(75%)achieved higher attenuation-3.7 dB than the coating with a greater(80%)absorber content did,namely-2.8 dB.For neither of the two coatings was an evident attenuation maximum observed.However,when comparing the dynamics of the attenuation value change,it could be assumed that for a coating with a 75%absorber content,the attenuation maximum would be located closer to the measurement range upper limit (18 GHz) than for a coating containing 80% absorber.
For coatings with a thickness of 1 mm(Fig.16),higher maximum attenuation values were observed compared to 0.5 mm.In the case of samples containing 75% absorber,it was -5.2 dB,while for the 80% ones it equalled -7.5 dB.Both were in the upper limit of the measuring range (18 GHz),near which a clear decrease in the dynamics of the attenuation change suggested that it approached the maximum.
A further increase in the thickness of the coatings — up to 1.5 mm(Fig.17)—was characterized by a growing attenuation.For the sample with a 75% absorber content,it reached -20.2 dB for 18 GHz (upper limit of the measurement range),and -16.1 dB for the sample containing 80% absorber with a clearly defined maximum around 13 GHz.
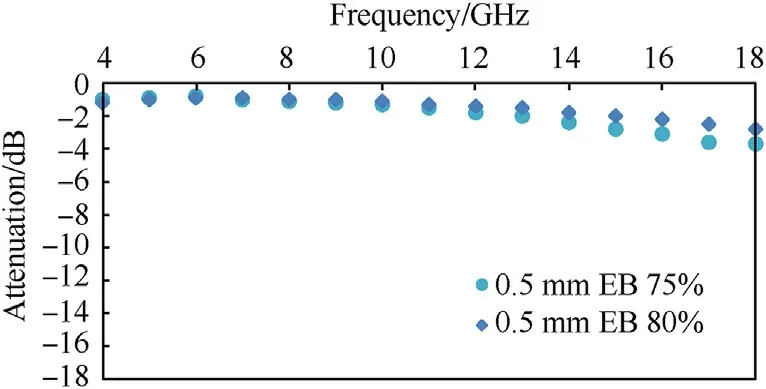
Fig.15.Impact of absorber on attenuation for a 0.5 mm thick coating—resin Set No.2.
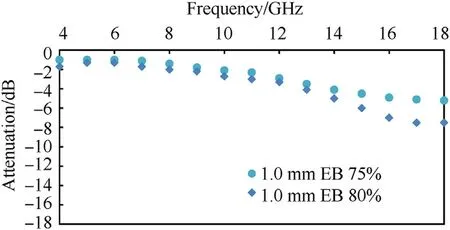
Fig.16.Impact of absorber on attenuation for a 1.0 mm thick coating—resin Set No.2.
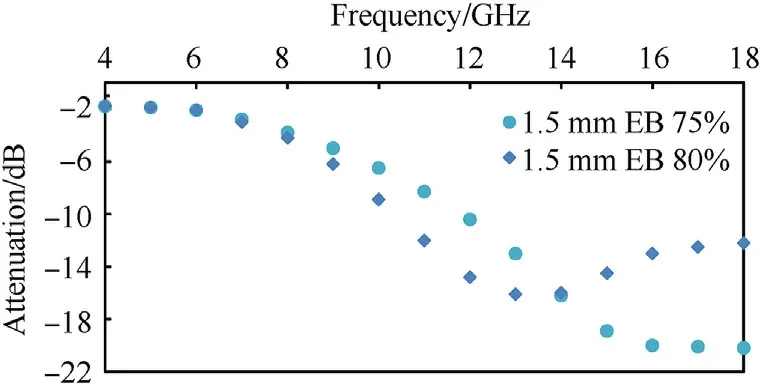
Fig.17.Impact of absorber on attenuation for a 1.5 mm thick coating—resin Set No.2.
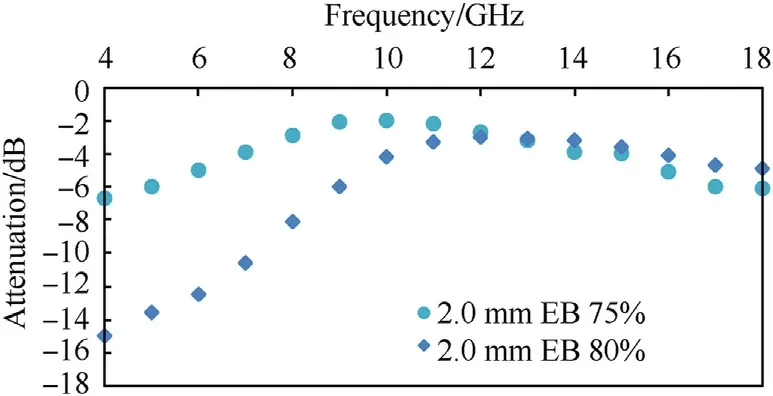
Fig.18.Impact of absorber on attenuation for a 2.0 mm thick coating—resin Set No.2.
As far as the thickest,2 mm,tested coatings are concerned(Fig.18),the attenuation maxima for both coatings exceed the lower limit of the measuring range (4 GHz),where they reached -6.7 dB for the 75% w/w absorber content sample and -15 dB for the 80% one.
In conclusion,for Set No.2,it was not clear that the increase in the absorber's content from 75% to 80% shifted the maximum attenuation to higher frequencies.Furthermore,it also could not be asserted explicitly that the increase in the absorber content around its maximum value of 75%—80% undeniably increased the attenuation.However,in line with Beer's theorem and analogous to Set No.1 it could be acknowledged that increasing the thickness of the coating results in increased attenuation.At the same time,with increasing coating thickness a shift of the maximum attenuation values towards lower frequencies was visible.
To determine the effect of the binder on attenuation,the measurement results for samples differing in the type of binder(Set No.1 vs Set No.2)characterized by identical thickness were compiled.
For the 0.5 mm coating thickness(Fig.19),binder No.1 indicated higher attenuation,both for the 75%and the 80%absorber content,up to-7 dB and-6 dB versus-3.7 dB and-2.8 dB for binder No.2.A clear attenuation maximum was recorded only for the sample containing 75% absorber and binder No.1.For all the remaining ones,the maxima fell outside the upper limit (18 GHz) of the measuring range.
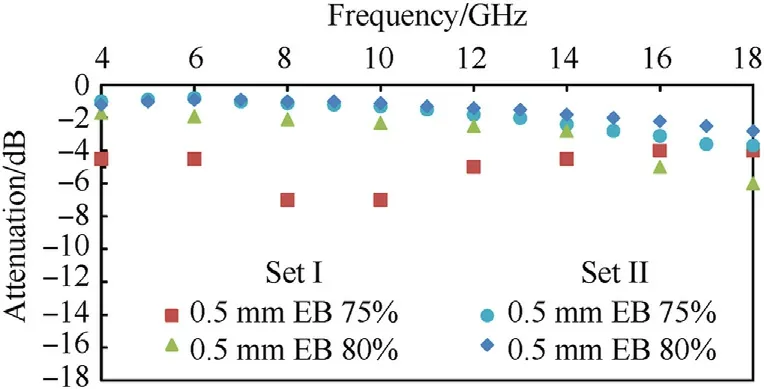
Fig.19.Impact of binder on attenuation for 0.5 mm coating — resin Sets No.1 and 2.
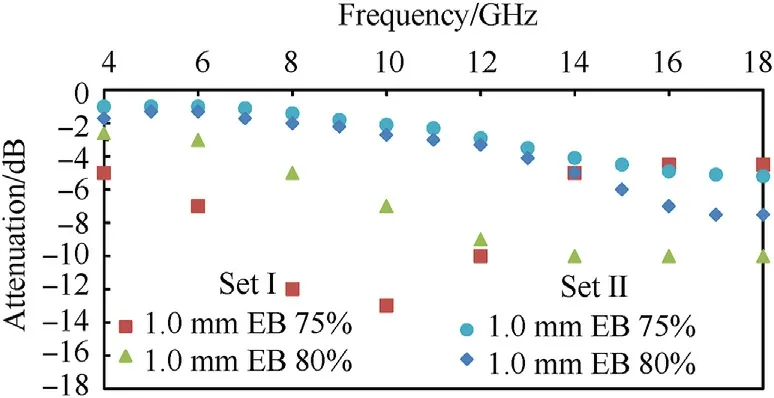
Fig.20.Impact of binder on attenuation for 1.0 mm coating — resin Sets No.1 and 2.
The highest attenuation value for the 1 mm thickness (Fig.20)was again recorded for binder No.1.For the sample with 75%absorber content,it amounted to -13 dB for the maximum of around 10 GHz,and for the 80%absorber sample,it equalled-10 dB for 14 GHz versus-5.2 dB(75%sample)and-7.5 dB(85%sample)of binder No.2,for which the highest values were in the upper limit of the measuring range(18 GHz).
For a thickness of 1.5 mm (Fig.21),where the attenuation maxima were within the measuring range,the samples based on binder No.2 exhibited higher attenuation,up to -20.2 dB (75%sample)for 18 GHz,and-16.1 dB(80%sample)for 13 GHz.Samples utilizing binder No.1 reached -12 dB (75% sample) for 8 GHz and-12.5 dB (80% sample) for 10 GHz,respectively.
For the thickest layer — 2 mm (Fig.22) — only the binder No.1 sample(80%)had a clear maximum within the measuring range—8 GHz and attenuation equalled -14 dB.The remaining samples achieved the highest attenuation at the lower limit of the measurement range (4 GHz): binder No.1 sample — 75% and -18 dB,while for binder No.2 samples -6.7 dB (75% sample) and -15 dB(80% sample) attenuation was noted.
It can be concluded that the type of applied binder influenced both the maximum attenuation value and its position in the tested frequency range.For Set No.1 the maximum attenuation values were recorded at lower frequencies.The maximum attenuation obtained also changed with greater values noted for Set No.1 for the coatings with a thickness of 0.5 mm,1 mm and 2 mm,while for the 1.5 mm thick coating higher values were recorded for Set No.2.
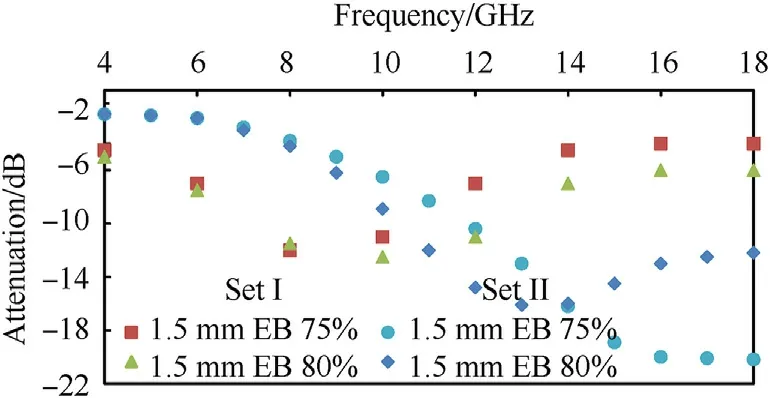
Fig.21.Impact of binder on attenuation for 1.5 mm coating — resin Sets No.1 and 2.
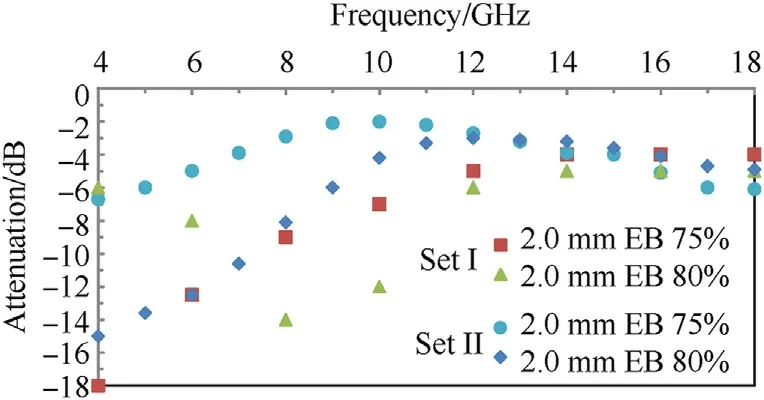
Fig.22.Impact of binder on attenuation for 2.0 mm coating — resin Sets No.1 and 2.
Considering all the results globally,in the case of resin set No.1 the lack of any clear tendency regarding the location of the maximum and its value might point to the issues with internal homogeneity.The first resin set in its composition contained additional components in order to improve its physical aspects,which were different from the ones of set No.2.As for the second set,the composition was essential,and included only resin,hardener and absorber material giving predictable tendencies,and providing improved unification of all elements.
4.2.Statistical analysis of experimental data
To compare and normalize the indication of one supreme universal attenuating composition,as defined by the absorber percentage,the thickness of the coating and the type of binder for the tested frequency range (4—18 GHz),the samples also underwent statistical analysis.The analysis consisted in compiling the samples in the full frequency range in various contexts: thickness,binder,absorber content,and then calculating the arithmetic means which determined the overall attenuation level and the maximum attenuation values.Comprehensive listings can be found in the Supporting Materials.The summary of the results for the thickness context is presented in Table 3.
The context of the absorber content(resultative)is presented in Table 4.
In case of a comprehensive comparison in the context of the binder content in the full frequency range,the average (general attenuation level) indicated that the 1.5 mm-thick samples were characterized by the highest attenuation efficiency for both absorber concentrations;for 75% the attenuation equalled-8.91 dB,and for 80%it amounted to-8.94 dB).The difference was below 0.35%.However,taking into account the maximum values,the results indicate that the samples with a 75% content had superior attenuation of -20.2 dB,compared to-16.1 dB for samples where the absorber comprised 80% of the mixture.
For Set No.1 analysis from the perspective of binder content(resultative) is shown in Table 5,whereas for Set No.2 it can be found in Table 6.

Table 3 The resultant comparison of the attenuation (dB) in the context of thickness as a parameter relative to the samples.

Table 4 Complex listing of attenuation values (dB) in terms of absorber content.

Table 5 Listing of attenuation values (dB) for Set No.1.

Table 6 Listing of attenuation values (dB) for Set No.2.
Considering the type of binder,it could be stated that theoptimal parameters were noted for a 1.5 mm thick sample from Set No.2,where the average attenuation was -9.67 dB,and the maximum equalled -20.2 dB vs the average of -7.78 dB,and a maximum attenuation of -18 dB for Set No.1.
The best attenuation parameters were recorded for a 1.5 mm thick sample with a 75% absorber content which was made based on binder No.2,for which average attenuation equalled-10.07 dB and a maximum value reached -20.2 dB.For this sample,the binder — thickness — content listing is presented in Table 7.

Table 7 Attenuation value listing (dB) for the best sample.
Attention should also be paid to the variability of the attenuation values for each sample in the tested frequency range(4—18 GHz).Accordingly,no one-size-fits-all best-attenuating composition could be identified,as defined by the proportion of the absorber,the thickness of the coating or the type of binder.
Trying to determine the best among the examined compositions,it can be stated that the sample from Set No.2 with the thickness of 1.5 mm and a 75%absorber content turned out to have the highest attenuation value (at the level of -20 dB for the frequency of 16—18 dB).However,when the X band (8—12.5 GHz),quite commonly used in military radars,is to be considered,the sample from Set No.1,1.0 mm thick and containing 75% absorber and the one 1.5 mm thick with 80% content would be the most optimal.It exceeded -12 dB attenuation for the entire X band.
In the literature,typical compositions of absorbing paints containing ferrites as microwave absorbers were set typically at 60 wt%with respect to the resin component.They yielded minimum absorption of — 9 dB from 8.7 to 10.2 GHz for a 2 mm-thick doublelayer coating [25].Other research presented the application of carbonyl iron particles as a component of absorbing materials in a range of 12.4—18 GHz,and the best results were obtained for a 2 mm-think layer containing 60% of the absorber,with themaximum of attenuation at 13 GHz(approx.—19 dB)[26].Luiza de C.Folgueras et al.in their research used polyaniline with carbonyl iron to prepare absorbing paints [27].The authors noted attenuation equal—4-6 dB and—7-8 dB for a 1.85 mm polyaniline carbonyl iron paint and a 1.1 mm carbonyl iron pain,respectively,demonstrating that polyurethane is the supreme insulator,as it reduces the possibility of polymer matrix conductivity.
In our case,the small carbonyl iron particle size in the range of 3—4 μm,insulating polymer matrices and increased absorber content to 75% or even 80% allowed the layer thickness reduction almost by half or one quarter,respectively,resulting in attenuation levels above —12 dB in the entire X band.The results presented showed results which were improved when compared with the ones in the literature for similar systems.Additionally,the simplicity of the carbonyl iron paint allows the preparation of an efficient absorption pain that could cost approx.55 USD for 1 m2,thanks to relatively the low-priced components: carbonyl iron(6—10 USD/kg) and resin (approx.25 USD).
5.Conclusions
As part of this study,a procedure for the fabrication of paints containing varying amounts — 75% and 80% by weight — of the absorber(EB carbonyl iron)was developed.Moreover,based on the paints manufactured,the camouflage efficiency tests were carried out in the microwave range of 4—18 GHz for layers differing in thickness,ranging from 0.5 to 2 mm,which were applied onto an aluminium plate.Testing the coatings for radar-absorbing properties allowed us to determine the following relationships concerning:
(1) The coating thickness: according to Beer's law,as was assumed that the attenuation increased along with the increase in thickness,reaching values above -20 dB.At the same time,what could be seen is that along with the same coating thickness increase,the attenuation maximum shifts towards lower frequencies.
(2) The absorber content: a slight reduction of the absorber content,from 80 to 75%,shifts the attenuation maximum towards lower frequencies and increases the attenuation value,which was a somewhat surprising and ambiguous finding.
(3) The binder type:the type of resin used,along with additives and hardeners,does have an impact on the attenuation.Despite the equal thickness of the coating and the same absorber content—the coatings prepared on the basis of sets of resins no.1 and 2 differed both in terms of the attenuation values,and the location of its maximum values on the spectrum.
(4) The coating homogeneity: homogenous coating does not yield attenuation above 12 dB in the entire frequency band of 4—18 GHz
(5) The epoxy resin: the epoxy resin does not contribute to the attenuation level in a significant manner.
Coatings made of carbonyl iron-based paints and resins exhibit microwave-attenuating properties and are prospective materials for coatings reducing the probability of being detected by the modern-day military radar systems.
Declaration of competing interest
The authors declare that they have no known competing financial interests or personal relationships that could have appeared to influence the work reported in this paper.
杂志排行
Defence Technology的其它文章
- Dual Attribute Adversarial Camouflage toward camouflaged object detection
- A bi-population immune algorithm for weapon transportation support scheduling problem with pickup and delivery on aircraft carrier deck
- One-step green method to prepare progressive burning gun propellant through gradient denitration strategy
- Benchmark calculations and error cancelations for bond dissociation enthalpies of X—NO2
- GO/HTPB composite liner for anti-migration of small molecules
- Resilient tightly coupled INS/UWB integration method for indoor UAV navigation under challenging scenarios
