A study of the influence of different grid structures on plasma characteristics in the discharge chamber of an ion thruster
2023-03-09MingmingSUN孙明明JianfeiLONG龙建飞WeilongGUO郭伟龙ChaoLIU刘超andYongZHAO赵勇
Mingming SUN(孙明明),Jianfei LONG(龙建飞),Weilong GUO(郭伟龙),Chao LIU(刘超) and Yong ZHAO(赵勇)
1 Science and Technology on Vacuum Technology and Physics Laboratory,Lanzhou Institute of Physics,Lanzhou 730000,People’s Republic of China
2 Gravitational Wave Universe Taiji Laboratory,Hangzhou Institute for Advanced Study,UCAS,Hangzhou 310024,People’s Republic of China
3 Key Laboratory of Gravitational Wave Precision Measurement of Zhejiang Province,UCAS,Hangzhou 310024,People’s Republic of China
Abstract The grid structure has significant effects on the discharge characteristics of an ion thruster.The discharge performances of a 30 cm diameter ion thruster with flat,convex and concave grids are studied.The analysis results show that the discharge chamber with a convex grid has a larger‘magnetic-field free area’than the others,and the parallelism of the magnetic-field isopotential lines and anode is generally the same in the three models.Plasma densities of the three structures at the grid outlet are in the range of 3.1×10¹⁶–6.9×10¹⁷ m−3.Along the thruster axis direction,the electron temperature in the chamber with the convex and concave grids is in the range of 3.3–3.5 eV,while that with a flat grid is lower,in the range of 3.1–3.5 eV.In addition,the convex and the concave grids have better uniform distribution of electron temperature.Moreover,the collision frequency ratios show that the axial degree of ionization of the three models is the highest,and the flat grid has the highest discharge efficiency,followed by the convex grid and the concave grid is the least efficient.The test and simulation results of the 30 cm diameter ion thruster with the convex grid show that the measurement and calculation results are 3.67 A and 3.44 A,respectively,and the error above mainly comes from the ignorance of the doubly charged ions and parameter settings in the model.The comparison error between the simulation and measurement of beam current density is mainly caused by the actual thermal deformation of the grids during the discharge process,which leads to the change in electric potential distribution and variation of the focusing characteristics of the grids.Upon consideration of discharge performance and the thermal grid gap variation,it can be concluded that the flat and concave grids are more suitable for small-diameter ion thrusters,while the convex grid is a more reasonable choice for the higher-power and larger-diameter thrusters.
Keywords:ion thruster,the grids,discharge characteristics
1.Introduction
As the core component of an ion thruster for the extraction and acceleration of ions,the structure of the grids(also called an ionic optical system)has a significant influence on the generation and transport of plasma in the discharge chamber and ionic optical system[1–3].The focusing of the ion beam is formed in the upstream and downstream regions of the grids[4,5].Meanwhile,due to the potential of the grids being the lowest of the entire discharge region,the electric field formed between the grid and the anode has a decisive effect on plasma characteristics and distribution in the chamber,and affects the thruster performance,such as thrust,specific impulse and efficiency.Figure 1 shows the structure of the discharge chamber of a 30 cm diameter ion thruster developed by Lanzhou Institute of Physics(LIP)and a schematic diagram of the ion beam extraction process.As shown in figure 1,the 30 cm diameter ion thruster adopts the triple grid as an ionic optical system[6,7].The discharge chamber structure is a typical combination of cylindrical and conical sections,and the screen grid and the accelerator grid load 1200 V and −220 V voltages,respectively.Meanwhile,the decelerator grid,as the charge exchange(CEX)ions bombardment target only,does not apply a voltage but improves the service life of the accelerator grid.
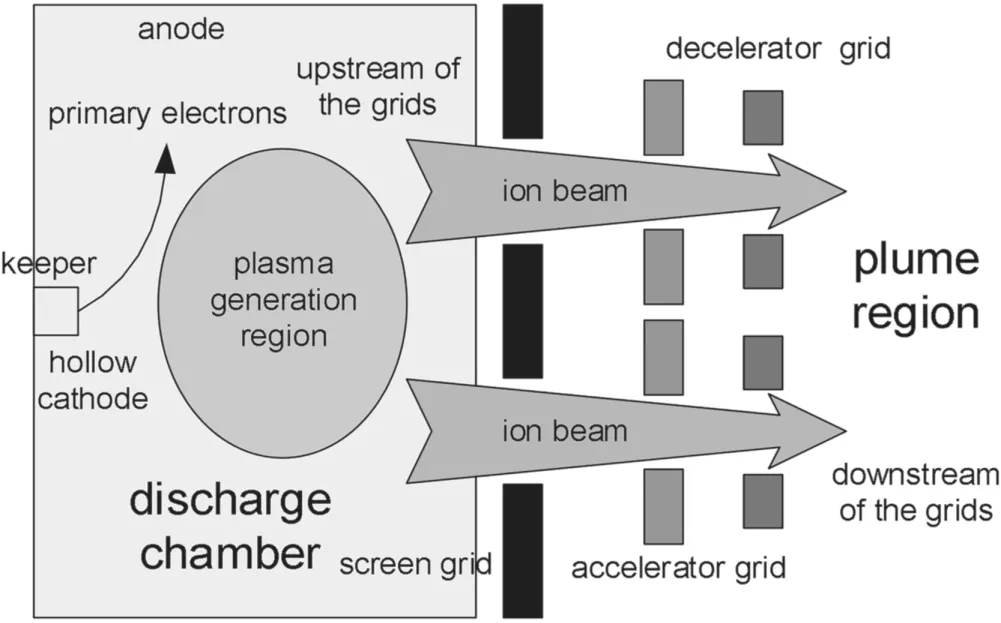
Figure 1.A schematic diagram of the ion beam extraction process.
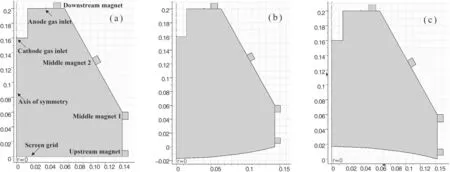
Figure 2.DCMs with a flat grid(a),convex grid(b)and concave grid(c)(unit:m).
In 2005,Wirz and Katz investigated the plasma characteristics in the discharge chamber of the 30 cm diameter NSTAR ion thruster with a convex grid using a multicomponent hybrid 2D computational discharge chamber model(DCM)[8].The purpose of the study was to calculate plasma parameters for the long-life requirement of the thruster in orbit to carry out plasma etching simulation and life prediction for the core components,mainly the hollow cathode and the grids.The results show that under TH15 working conditions,the electron density is in the range of 1×10¹⁶–7×10¹⁷m−3when the anode flow,cathode flow,screen voltage and acceleration voltage are 23.4 sccm,3.73 sccm,1100 V and −249 V,respectively.The electron temperature along the thruster axis is the highest,reaching 4.3 eV.The closer it is to the anode,the lower the electron temperature is,about 4 eV.The electron collision frequency ratio(ratio of electrons–neutrals and electrons–ions)is highest close to the anode,reaching 4.7–8.1,while the closer to the thruster axis,the higher the electron–ion collision frequency.The ion current density at the center of the grid is the highest,reaching 40 A m−2while,along the radial direction,the ion current density presents a parabolic decrease.The DCM results show that the ionization process can be more uniform throughout the discharge chamber by allowing the primary electrons to move away from the thruster axis:that is,the ionization efficiency can be improved by reducing the densities of the primary electrons and doubly charged ions on the thruster axis.In 2006,Goebel[9]developed ‘modified’NSTAR ion thruster designs that guide primary electrons away from the thruster center line to improve the performance.In addition,these designs had been validated by experiments in 2005[10],and the measurements of doubly charged ions and neutral density along the thruster axis are in good agreement with the simulations by the DCM.These previous research studies have efficiently simulated the plasma characteristics in the discharge chamber of the ion thruster,and proved the effectiveness of the simulation model in the optimization design of the thruster.However,it takes a long time to build a simulation model,and the cost is high;therefore,it is worth considering the use of mature commercial software to quickly obtain the parameters of discharge plasma to improve the optimization of a thruster or verify different structural designs.
The main purpose of this work is to establish a simple and efficient discharge model with a certain accuracy using general commercial software.Then,the effects of different grid structures on plasma parameters are calculated and evaluated,and the results of the model are verified by test.According to the simulation results of the plasma parameters of different grid structures,theoretical support will be provided for the possible design improvement of the existing grid structure in the future.
2.Discharge model and boundary settings
Due to the high costs associated with processing grid components with different structures,a numerical simulation method is used to obtain the influence of the grid structure on the plasma characteristics of the discharge chamber.COMSOL multi-physics coupling software is used in the simulation process,mainly because it is a useful tool for carrying out quick and inexpensive parametric studies of the effects of geometry,but the convergence of calculation needs to be solved[11].
As shown in figure 2,three DCMs with different grid structures are established:a flat grid,a convex grid and a concave grid.Since the study mainly focuses on the plasma characteristics in the discharge chamber,the accelerator grid does not appear in the three models.The main dimensions of the three discharge chambers are generally consistent,including the position of the hollow cathode,gas inlet and the magnet pole,and the obvious difference is the location of the screen grid.As shown in figure 2(a),the DCM is composed of column and cone structures,which are all made of tantalum material due to the small thermal deformation of titanium at high temperatures.The radius of the discharge chamber outlet,also the screen grid radius,is 0.143 m.Four annular magnets made of permanent magnetic material form a ringcusp field,which makes the discharge process more uniform[12,13].Middle magnet 2 is nearly mounted in the middle of the cone structure,and the downstream magnet is installed at the bottom of the discharge chamber.The upstream magnet is mounted near the outlet of the column structure and the location of middle magnet 1 is at the joint of the cone and column structures.The diameters of the cathode gas inlet and the anode gas inlet are 1 mm and 1.5 mm,respectively.
All three DCMs are axially symmetric;the axial length of the model in figure 2(a)is 0.16 m,which is from the chamber outlet to the cathode outlet,and the radial length is 0.14 m,from the symmetry axis to the edge of the chamber.Figure 2(b)shows the DCM with the convex grid;the main difference is the grid shape compared with the model in figure 2(a).The arch height of the convex grid is 0.017 m,and the position and sizes of other parts are consistent with figure 2(a).Similarly,the arch height of the concave grid shown in figure 2(c)is −0.017 m.
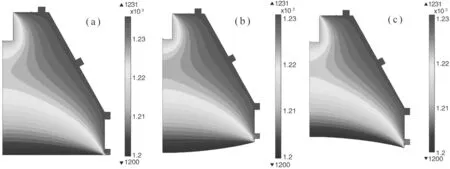
Figure 3.Potential distribution of discharge models with a flat grid(a),convex grid(b)and concave grid(c)(unit:V).
The boundary settings include the electric parameters,magnetic properties of materials,the gas supply and plasma discharge settings.The boundary settings have a significant effect on the discharge process,accuracy and convergence of the simulation results.Therefore,the working parameters of the thruster and the appropriate adjustment of the parameters according to the convergence of the simulation results should be considered.Table 1 gives the typical working conditions,such as the electric parameters,magnetic properties and gas supply settings in 5 kW operation conditions of the 30 cm diameter ion thruster.
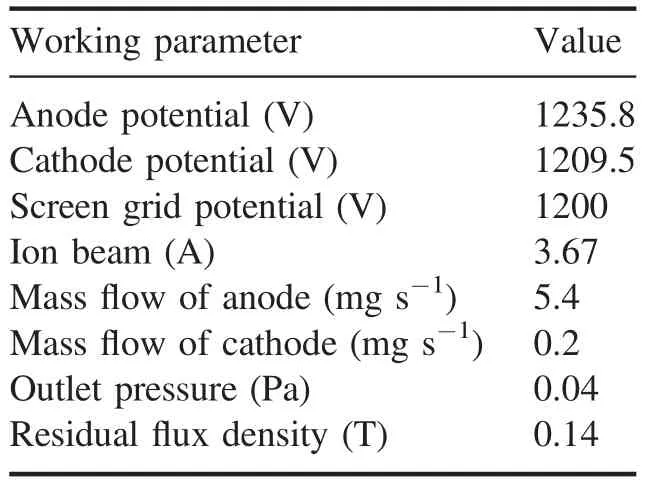
Table 1.Working conditions of a 30 cm diameter thruster.
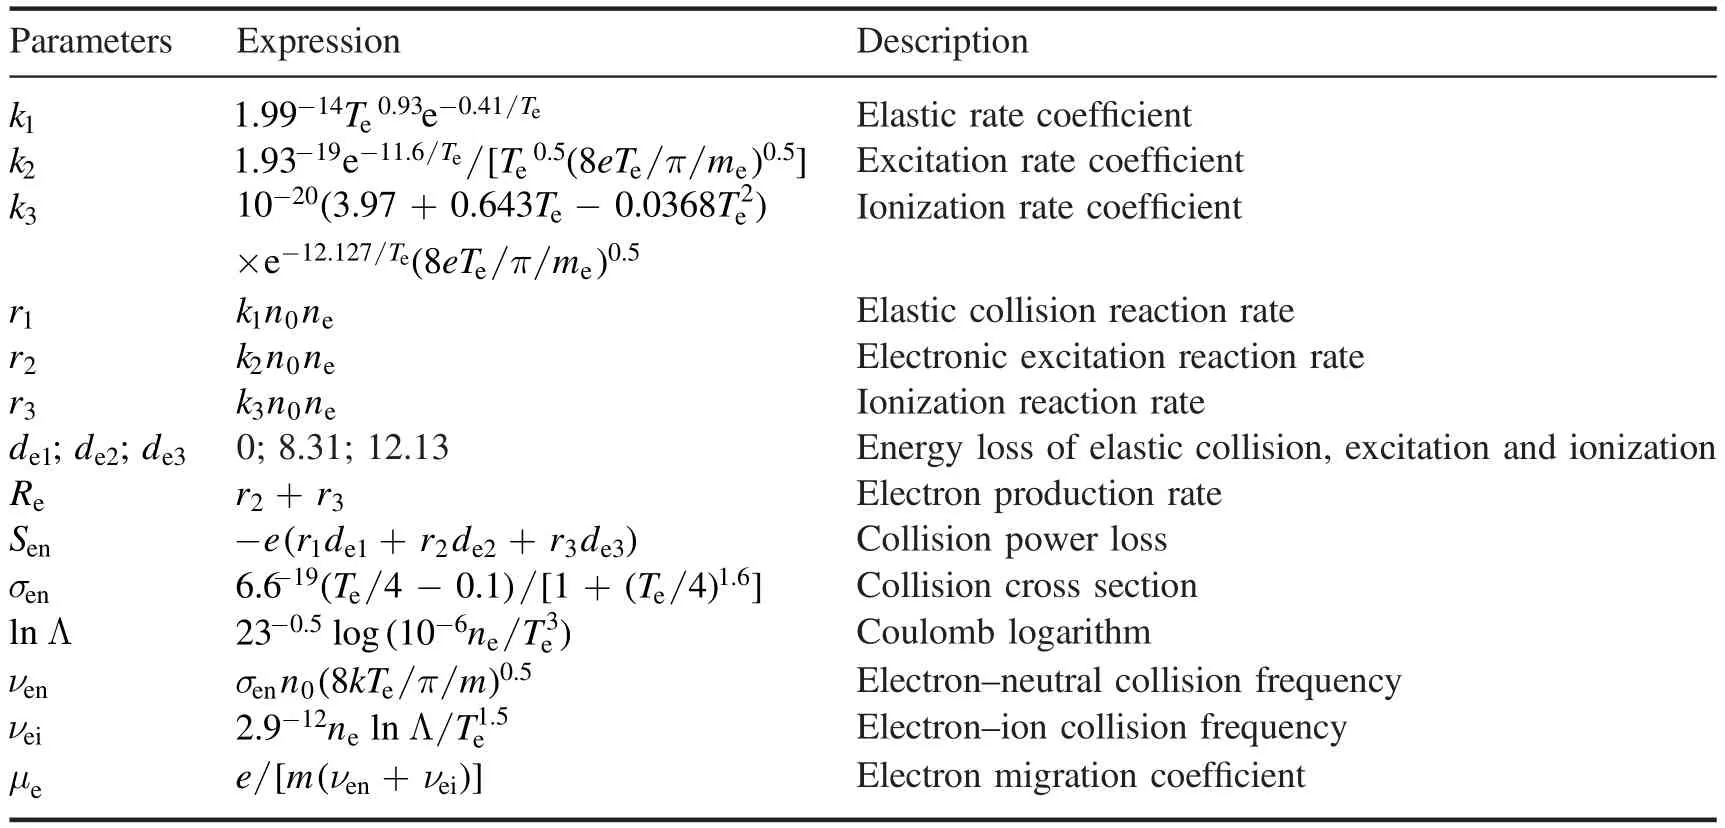
Table 2.Parameter settings of the DD module.
As shown in table 1,the discharge model is based on the thruster power supply relationship,and the cathode voltage is floating on the screen grid voltage.Then,the screen grid voltage is 1200 V;therefore,the keeper voltage is 1209.5 V and the anode voltage is 1235.8 V.The electric field can be expressed as the gradient of the electric potential,E= −∇V,and the negative sign comes from the convention that the electric field always points in the direction of ion motion.In addition,the electric field simulation is based on the assumption that plasma is quasi-steady and the self-consistent electric field of plasma is ignored(the self-consistent potential of the plasma is in the range of 0–2 V and barely affects the particle motion[14]).The static electric field(ES)module in COMSOL is used to solve the potential distribution within the discharge chamber.
Although COMSOL is convenient discharge simulation software,the convergence of simulation calculation is a prominent problem during use,especially in the fluid simulation of the discharge chamber,with the size of the gas inlet,fluid property settings and pressure conditions,which all have a significant impact on the convergence.Therefore,according to the real size and the gas supply of the thruster,the modeling and boundary conditions are set first,and then the boundaries are slightly changed according to the convergence of the calculated results.For the cathode,the diameter of the orifice is 1 mm.The keeper is a tantalum round plate with a central aperture,and the thickness and the diameter of the aperture are 1 mm and 5 mm,respectively.Neutral xenon gas is injected into the inlet of the cathode tube through a gas insulator(a ceramic component connected to the inlet of the cathode to isolate the gas discharge process toward the supply tube).The temperature of the cathode orifice is heated to over 1500 °C during the discharge process,and then the thermal electrons emit from the orifice and create thermal electron currents[15].As shown in figure 1(a)and table 1,the diameter and mass flow of the cathode are set as 1 mm and 0.2 mg s−1,respectively.Based on the same method,the diameter and mass flow of the anode are set as 1.5 mm and 5.4 mg s−1,respectively.The SPF module in COMSOL is used to solve the pressure and velocity of the fluid within the discharge chamber.According to previous test results of the same type of cathode[16],before the discharge begins,the velocity of neutral gas in the discharge chamber is at a low level,and below 0.3 Mach number.Therefore,the fluid in the discharge zone is considered as incompressible and turbulence is ignored.The temperature of the fluid is set as 300 K to obtain the fluid parameters before gas discharge.All the walls of the discharge chamber are set as the no-slip boundary,which means the fluid velocity on the wall is 0.The boundaries of the inlets of the anode and the cathode are set as a mass flow condition with values of 5.4 mg s−1and 0.2 mg s−1,respectively,and the flow direction is perpendicular to the inlet section.The initial pressure of the discharge zone is set as 0.01 Pa,and the internal gas is assumed to be a steady flow.The screen grid shown in figure 1 is defined as the gas outlet,and the boundary of the gas outlet is set as a pressure condition with the value of 0.04 Pa according to previous test results[16].
At present,the main plasma discharge simulation methods of ion thrusters include PIC-MCC(Particle-in-Cell-Monte-Carlo-Collision)and fluid simulation.The PIC-MCC simulation is relatively complex and has higher computational resource requirements and longer calculation time than the fluid simulation method.The fluid simulation method is relatively simple,but requires a large number of parameters to complete the calculations.The drift-diffusion(DD)module in COMSOL is a typical fluid simulation method based on the DD equation,which regards the motion process of charged plasma in the discharge chamber as a fluid flow process under the influence of an electric field and a magnetic field.Therefore,the DD module is adopted to obtain the characteristics of the plasma in the discharge chamber.
With regard to the potential of the plasma sheath in the discharge chamber,according to the conclusion of Goebel[17],for a quasi-neutral ionization process,the potential of the sheath can be expressed as equation(1)by assuming that the ion density is equal to electron density,that isni=ne
In equation(1),kis the Boltzmann constant,Teis electron temperature(1 eV is 11600 K),Mandmare the masses of the ion and electron,respectively,andAaandAare the areas of electron loss and the total area of ion loss,respectively.In this paper,AaandAare the areas of the anode and screen,respectively,by default,and the electron temperature is assumed to be 5 eV in the calculation(refer to the electron temperature of the NSTAR ion thruster when the discharge reaches a steady state[8]);thus,the sheath potential of the discharge model is about 36.5 V,which is essentially equal to the anode potential shown in table 1(the potential also floats on the screen grid).Therefore,the anode is taken as the sheath boundary in the simulation to simplify the calculation.
The DD module includes the electron continuity equation,electron DD equation,electron flux equation and energy equation.The electron continuity equation is shown as:
whereneis electron density,Γeis the electron flux in the cathode discharge zone,uis the electron velocity,Reis the electron generation rate and the unit is m−3s−1.The electrons are generated from elastic collision,excitation collision and ionization collision,and the expression of the reaction rate coefficient for xenon in different collision types has been given by Milleret al[18].The different reaction rate coefficients are denoted byk1,k2andk3,respectively.Meanwhile,all the different reaction rate coefficients have a similar expressed equation as 〈σν 〉(whereσ is the collision cross section,andν is the frequency of collisions between particles and is determined by the electron temperatureTe[19]).The elastic collision is ignored because there are almost no Maxwellian electrons being produced and,in most cases,the energy transfer is predominant.Then,the electronic excitation reaction rater2and ionization reaction rater3can be expressed ask2n0neandk3n0ne,respectively.Therefore,Reis expressed as:
The electron flux Γecan be given by the DD equation,which is shown as:
After all the boundary conditions of the discharge model are obtained,the solver setting is considered.The simulations in the ES and SPF modules are steady simulation.The simulation in the DD module is a transient simulation,and the time range is set from 10−8to 10−1s to ensure that the plasma properties are evolving with time until steady state conditions are reached.
3.Simulation results and analysis
The potential distributions in the discharge chamber of the three different grid structures are shown in figures 3(a)–(c).The movement direction of ions is perpendicular to the isopotential line,and the potential distribution of the convex and concave grids near the screen grid is opposite from the comparison results,which are shown in figures 3(b)and(c).Therefore,the ion beams extracted from convex and concave grids are divergent and focused,respectively.Because the focused ion beam is extracted from the grids and neutralized by the electrons emitted by the neutralizer,then,under the diffusion of fluid and the interaction between particles,the beam extraction process in figure 3(c)will therefore present the characteristics of focusing first and then diverging.The potential distribution shown in figure 3(a)determines that the beam extracted by the flat grid will present perpendicular to the grid outlet surface.
Figures 4(a)–(c)show the magnetic-field distribution of the three different discharge chamber structures.As the results show in figure 4,there is no significant difference in the magnetic-field distributions of the three discharge chamber structures.The green line in figure 4 is the 50 Gs magneticfield isopotential,and the region enclosed by this line is called the ‘magnetic-field free area’[13].The magnetic field in this region has less of an effect on the plasma than the magnetic field near the anode,and the larger the volume of the ‘free area’,the better the flatness of the ion beam.Meanwhile,the closer and more parallel the edge of the ‘free area’ is to the anode,the better the plasma uniformity and the ion current density profile that can be obtained[21],and the influence of plasma on the anode can be reduced.It is obvious that the discharge chamber with the convex grid has the largest ‘free area’,but this does not mean that the larger the discharge chamber,and the larger the ‘free area’,the better the plasma uniformity.In addition,the combined effect of fluid diffusion,the magnetic pole position,and the continuity of the 50 Gs magnetic isopotential line should be considered.Therefore,the discharge chamber has the optimum ratio of length to diameter.In addition,due to the same position and boundary settings of the magnets,the parallelism of the magnetic-field isopotential lines and anode is essentially the same in the three models.
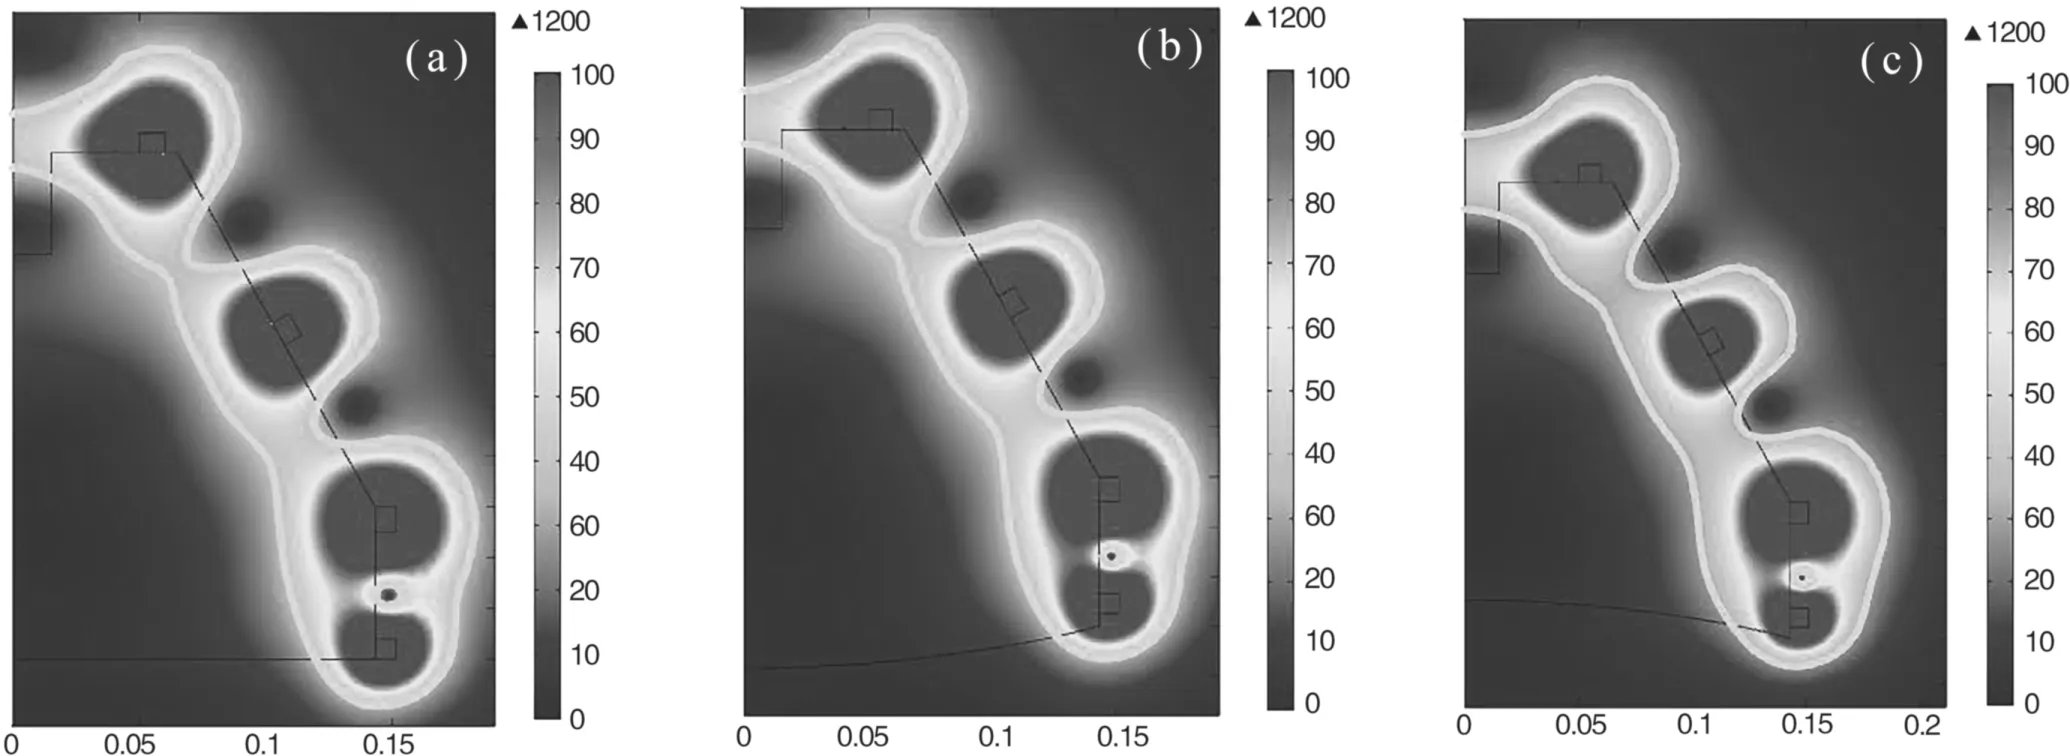
Figure 4.Magnetic-field distribution of the discharge models with a flat grid(a),convex grid(b)and concave grid(c)(unit:Gs).
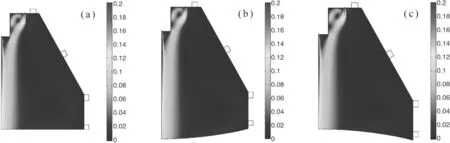
Figure 5.Fluid velocity distribution of the discharge models with a flat grid(a),convex grid(b)and concave grid(c)(unit:m s−1).
The simulation results of fluid velocity in the discharge chamber are shown in figures 5(a)–(c),and it can be concluded that fluid velocity is barely affected by the structure of the discharge chamber.The fluid velocity is the highest along the axis of the hollow cathode,and the value is in the range of 0.1–0.2 m s−1.The fluid ejecting from the anode gas inlet shows obvious diffusion characteristics,mainly because the size of the anode gas inlet is higher than that of the cathode gas inlet,and the gas mass flow is higher.In the previous boundary condition settings,the walls of the discharge chamber are all set as no-slip.In the calculation,it is further found that if the inertia term of the fluid,i.e.the friction inside the fluid,is not ignored,the calculation results can barely achieve convergence.Due to the low gas pressure in the discharge chamber,the friction inside the fluid is ignored.In addition,it is found that if the fluid outlet does not prohibit backflow,the convergence of the calculation results is difficult.According to previous calculation results[16],the backflow from the closer plume region(1–2 times the grid diameter from the grid surface)to the discharge chamber at room temperature only accounts for 10%of the total gas flow into the chamber.When the thruster is operating,the proportion of backflow will be lower.Therefore,to ensure the calculation process,the backflow is ignored.The neutral density calculated by the SPF module is in the range of 2.8×10¹⁷–7.2×10¹⁸m−3,and the neutral density in most areas is 3.2×10¹⁸m−3.
Figures 6(a)–(c)show the plasma generation process in a transient state of the discharge chamber with the flat grid at 2×10−7,1×10−4and 0.1 s,respectively.As shown in figure 6(a),at 2×10⁻⁷s,which is the initial stage of the discharge process,the plasma density along the thruster axis(as shown in figure 1(a))from the cathode to the screen grid is within the range of 1.1×10¹⁷–4.1×10¹⁷m−3.The plasma density is the highest at the cathode outlet,and the trend of moving toward the magnetic pole is obvious.This is because the primary electrons emitted from the cathode drift along the magnetic-field line(E×Bmotion),and eventually deposit to the magnetic poles.As the ionization process progresses,the plasma density distribution results after discharging for 1×10⁻⁴s are shown in figure 6(b).At this time,the ionization has expanded to most areas of the discharge chamber,and the plasma density along the thruster axis is in the range of 1.6×10¹⁷–5.7×10¹⁷m−3.Figure 6(c)shows the plasma density distribution at 0.1 s;it can be concluded that the discharge process has reached stability,and the plasma distribution in the discharge chamber does not change with time.In addition,it is evident that both primary and secondary electrons are deposited to magnetic poles and form an anode current.The plasma density along the thruster axis is in the range of 1.7×10¹⁷–6.5×10¹⁷m−3.
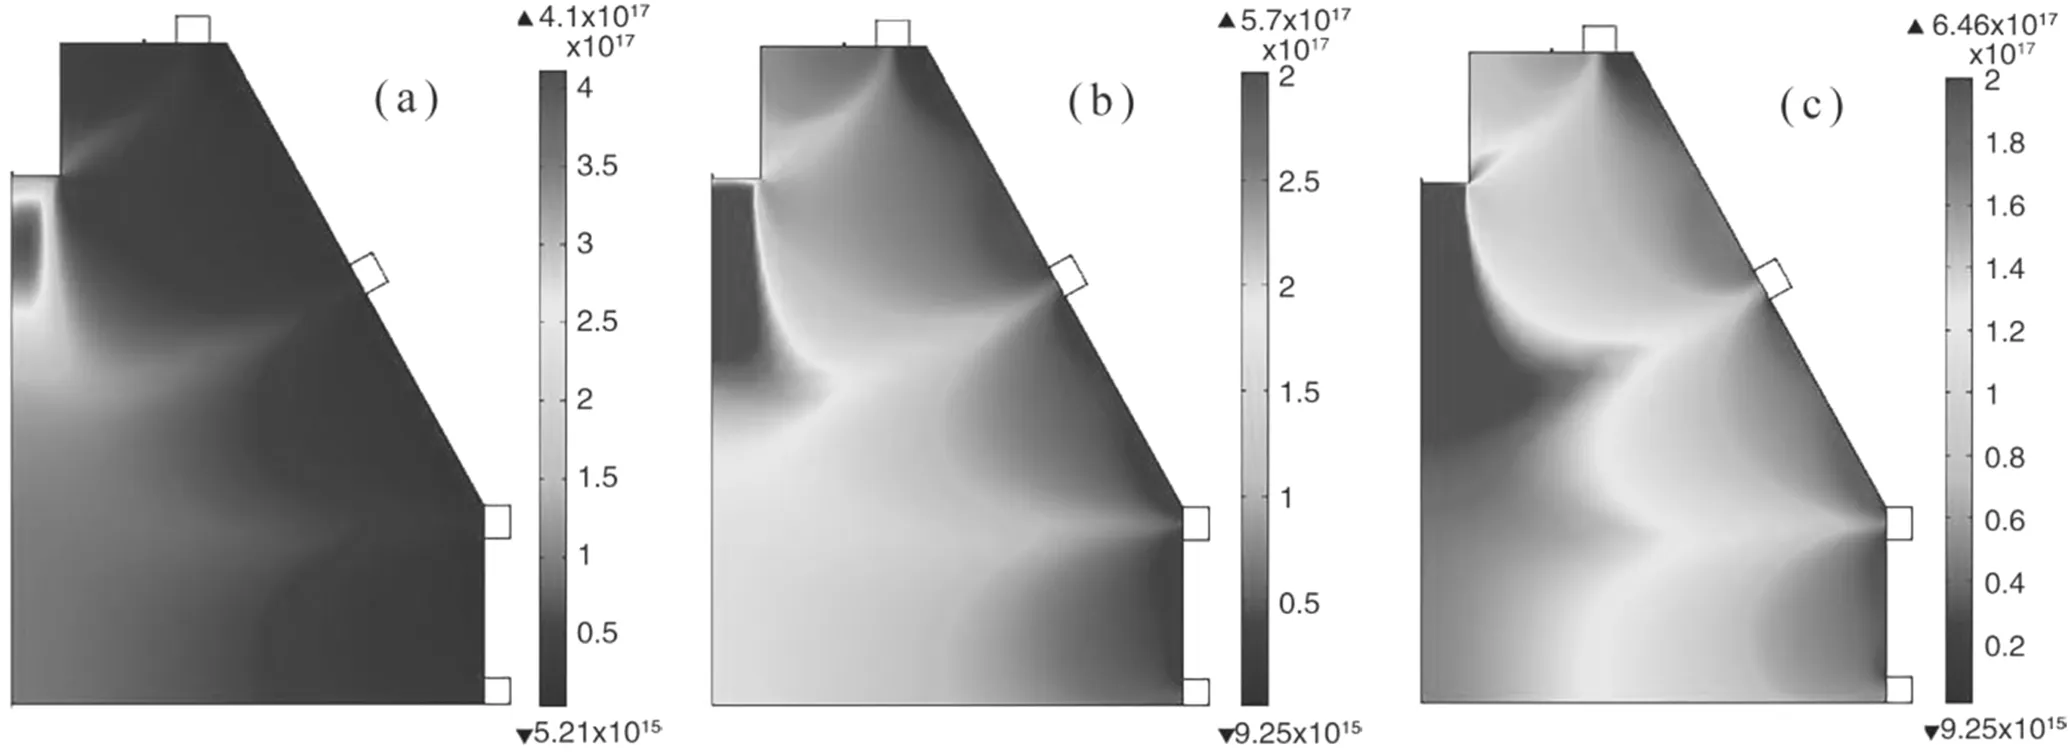
Figure 6.Distribution of plasma density at 2×10⁻⁷ s(a),1×10−4 s(b)and 0.1 s(c)(unit:m−3).
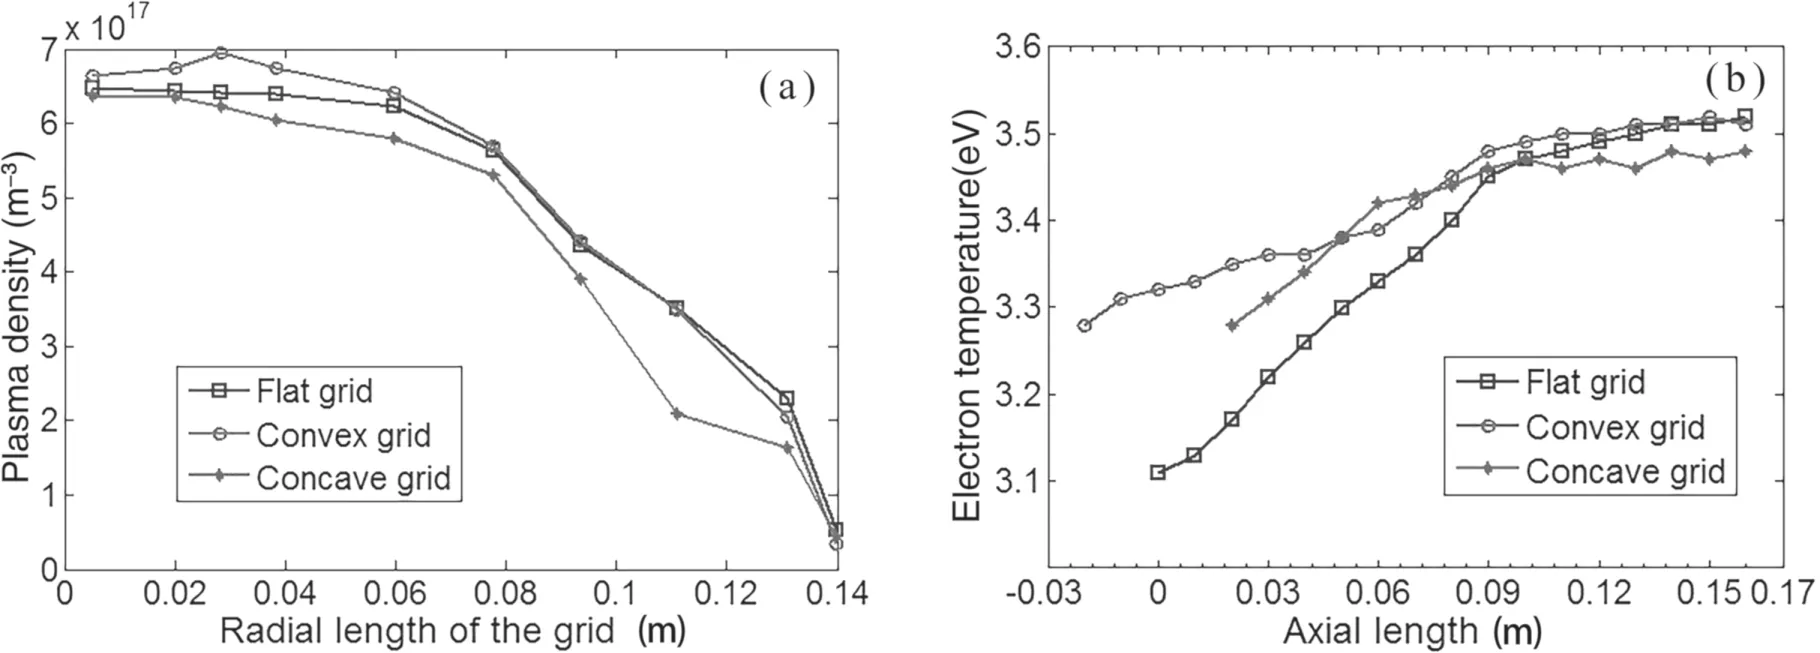
Figure 7.Simulation results of plasma density(a)and electron temperature(b).
Figure 7(a)gives the plasma density distribution along the radial direction of the screen grid after the discharge processes of the three different chamber structures reach stability.As shown in the figure,the plasma density of the three models is the highest in the center of the discharge chamber,and the density decreases as it gets closer to the edge.This is due to the combined influence of the potential and the neutral gas distribution,as shown in figures 3 and 5.
Figure 7(b)shows the electron temperature distribution along the axial region of the three different discharge chambers in the stability discharge process.It can be concluded that the electron temperature of the chamber with the flat grid is the lowest,within the range of 3.1–3.5 eV,while the electron temperature of the convex and concave grids is not much different,which is essentially in the range of 3.3–3.5 eV along the axis.To better compare the electron temperature distributions of the different chamber structures,the distribution diagram is given in figures 8(a)–(c).The results show that the higher electron temperatures of the three structures are essentially in the axial region of the thruster,while the electron temperature decreases in the region close to the upstream magnet.This is due to the low energy of the electrons emitted from the cathode,generally in the range of 2–3 eV.When the electrons are accelerating,the magnetic-field intensity of the axis of the discharge chamber is lower,and the average free path of electrons is higher;therefore,the collision probability is lower.This makes the electrons on the axis have a longer acceleration time,and the electron temperature is higher.However,the region near the anode is the main ionization region;therefore,the electron temperature is lower.In addition,the difference in electron temperature near the grid outlet of the three models is mainly caused by the distribution of potential and plasma density,as shown in figures 3 and 7(a),respectively.As shown in figure 3,the closer it is to the grid outlet,the lower the electric field acceleration effect is.Meanwhile,the region near the grid outlet is also the ion beam extraction area and,with the extraction process,the energy to maintain the discharge becomes lower;therefore,the potential of the plasma sheath decreases,resulting in the reduction of electron temperature.
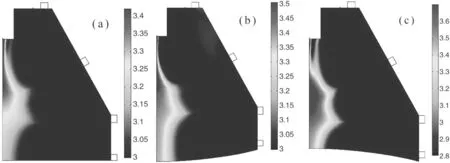
Figure 8.Electron temperature distribution of the discharge models with a flat grid(a),convex grid(b)and concave grid(c)(unit:eV).
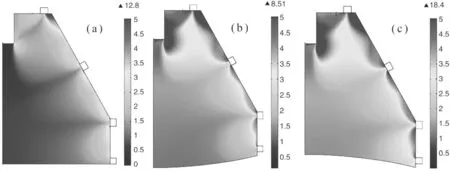
Figure 9.The electron collision frequency ratios(ν e nνe i )of the discharge models with a flat grid(a),convex grid(b)and concave grid(c).
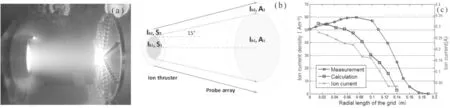
Figure 10.The Faraday probe array(a),equivalence of the ion beam(b)and comparison between the calculated results and measured results of ion beam density(c).
Finally,collisions between particles are an important part of the analysis,especially between electrons and neutral atoms,and between electrons and ions.The collision frequency of different particles can reflect the degree of ionization of different regions in the discharge chamber.The electron collision frequency ratio(νenνei)is shown in figures 9(a)–(c),and the ratio unit is dimensionless.The ratio is smaller,and the higher the collision frequency between electrons and ions is,the higher the density of ions in this region,leading to a higher degree of ionization.Conversely,the higher the ratio,the lower the degree of ionization.
According to the calculation results of the collision frequency ratio,intermediate levels(0–2)of ionization exist throughout the three different chambers.However,the area of intermediate ionization levels of the flat grid model is apparently higher than those of the convex and concave grid models.This means that the discharge chamber with the flat grid has the highest discharge efficiency,followed by the convex grid,and the discharge chamber with the concave grid is the worst.
4.Test results and comparison
In the development of the 30 cm diameter ion thruster,due to the actual thermal deformation of the grids,the processing difficulties and cost of the large area of the flat and concave grids,LIP finally selected the convex grid for the 30 cm diameter ion thruster with reference to NSTAR and XIPS-25 ion thrusters.The flat and concave grids have been used in a 10 cm diameter Kaufman ion thruster developed by LIP.Plasma density and electron temperature in the discharge chamber of the thruster with the convex grid have not been measured at present.Therefore,the accuracy of the calculated results of the convex grid discharge model is verified by the relationship between the ion beam current and plasma density in the upstream region of the grids,which is shown in equation(6).If the comparison error is small,it is considered that the calculation results of the discharge models with the flat and concave grids are also accurate,and the three models can reflect the effects of different grid structures on plasma characteristics in the discharge chamber:
whereIbis the ion beam,andAsandTsare the grid area and optical transparency(which is 67%),respectively.According to the calculation results of the electron temperature and plasma density in the upstream region of the grid shown in figure 7,the plasma density and the electron temperature from the grid edge to the center are in the range of 3.1×10¹⁶–6.3×10¹⁷m−3and 3.3–3.5 eV,respectively.The ion beam current calculated by equation(6)is within the range of 0.032–0.276 A,and the distribution along the radial length of the grid is shown in figure 10(c).Based on the plasma density distribution in figure 7(a),the total current on the screen grid is calculated to be 1.72 A and,considering that the simulation model in figure 2(b)is half of the real size of the discharge chamber,then the total beam current of the thruster with the convex grid is 3.44 A.The calculated value of the beam is obviously lower than the actual value of 3.67 A shown in table 1,because the beam current actually contains parts of doubly charged ions.However,in the simulation model,all the ions are set as singly charged and the existence of doubly charged ions is ignored.If the proportion of doubly charged ions in the total beam is assumed to be 10%,the actual singly charged ion current in the beam is 3.3 A,and the simulation results is essentially consistent with this value.In addition,the parameter settings of the model are one of the main reasons for the error.
The performance of the 30 cm diameter ion thruster with the convex grid is tested on the specific vacuum facility of electric propulsion at LIP[22];the diameter of the facility is 3 m,the length is 5 m and the working vacuum degree of the facility reaches 2×10⁻⁵Pa.The ion beam density test is measured by a Faraday probe array,which is shown in figure 10(a).The Faraday probe array is mounted on a circular support frame with a diameter of 1 m,and the distance between the frame and the outlet of the thruster is 0.5 m.The support frame has four probe mounting rods of equal length across the center of the circular frame,and each mounting rod has 20 Faraday probes.The current received by the Faraday probes is transmitted through signal lines to a computer for processing.
Since the Faraday probe array measures the received beam current,and the simulation results represent the beam value on the grid surface,the beam current density on the grid therefore needs to be equivalent to the probe array.As shown in figure 10(b),in the beam extraction process,assuming that the ion flux does not decay,then the current value does not change:mainly,the receiving area changes.The comparison between the calculation results via equivalence and measured beam density on the probe array is shown in figure 10(c).The measurements show that the beam density is the highest in the ring region in the middle of the grid,not in the center,while the beam density is lower the closer it is to the edge.There are some errors between the calculations and the measurements,as shown in figure 10(c),especially in the ring region from the middle of the grid to the edge.The analysis shows that the gap of the convex grids will be greatly reduced under the effect of thermal stress during thruster operation.Based on previous measurements[6],the gap will be decreased from 1 to 0.5 mm.Therefore,the beam density obtained by the test is measured after the thermal deformation of the ion optical system,while the focusing characteristics of the ion beam have changed significantly,which is the main reason for the existence of errors.In addition,the thermal deformation of the screen grid leads to the variation of the electric field isopotential line near the grids,which leads to the deviation between the distribution of plasma density of the upstream region of the grids and the real situation,and causes the errors between the calculations and measurements shown in figure 10(c).
5.Conclusion
The grid structure has obvious effects on the discharge characteristics of the ion thruster.According to the simulation results,the discharge chamber with the convex grid has a larger‘magnetic-field free area’and ionization region,and the distributions of collision frequency,electron temperature and plasma density are more uniform among the flat,convex and concave grids.In addition,according to the previous grid gap test results of the convex grid with 30 cm diameter,the variation of the grid hot gap is within an acceptable range(the minimum gap is greater than 0.25 mm).Therefore,the 30 cm diameter ion thruster finally chooses the convex grid as the optical system for ion acceleration and extraction.The comparison results of the ion beam show that there are some errors between the simulation results of 3.44 A and the actual value of 3.67 A because the existence of doubly charged ions is ignored and because of the parameter settings of the models.In addition,the errors between the simulation and measurement of the beam density are mainly due to the model,which does not consider the variation of the potential distribution near the grid and ion beam focusing caused by the grid thermal deformation during thruster operation.However,the analysis results show that,based on reasonable boundary condition settings and convergence of the calculation results,COMSOL can be used to obtain the discharge characteristics of the thruster and to evaluate its work performance.Meanwhile,the simulation results show that electron temperature distributions of the convex and the concave grids are more uniform.The flat grid has the highest discharge efficiency,followed by the convex grid,and the concave grid is the least efficient.This is because the convex grid gap is gradually reduced,while the concave grid gap is gradually increased during thruster operation,and the flat grid with a small area can obtain better beam flatness and its thermal deformation is small.Therefore,flat and concave grids are more suitable for small-diameter ion thrusters.At present,they have been applied in the 10 cm diameter Kaufman ion thruster developed by LIP.
Acknowledgments
This work is supported by National Natural Science Foundation of China(No.61901202),and by the Key Laboratory Funds for the Science and Technology on Vacuum Technology and Physics Laboratory,Lanzhou Institute of Physics(No.HTKJ2019KL510003).We are very grateful to the Science and Technology on Vacuum Technology and Physics Laboratory for providing the COMSOL software.
猜你喜欢
杂志排行

Plasma Science and Technology的其它文章
- Quasi-coherent mode in core plasma of SUNIST spherical tokamak
- High-resolution x-ray monochromatic imaging for laser plasma diagnostics based on toroidal crystal
- Numerical study of viscosity and heat flux role in heavy species dynamics in Hall thruster discharge
- Development of miniaturized SAF-LIBS with high repetition rate acousto-optic gating for quantitative analysis
- Focused electron beam transport through a long narrow metal tube at elevated pressures in the forevacuum range
- A nanoparticle formation model considering layered motion based on an electrical explosion experiment with Al wires