Development of miniaturized SAF-LIBS with high repetition rate acousto-optic gating for quantitative analysis
2023-03-09FeiCHEN陈斐JiajiaHOU侯佳佳GangWANG王刚YangZHAO赵洋JiaxuanLI李佳轩ShuqingWANG王树青LeiZHANG张雷WanfeiZHANG张婉飞XiaofeiMA马晓飞ZhenrongLIU刘珍荣XuebinLUO罗学彬WangbaoYIN尹王保andSuotangJIA贾锁堂
Fei CHEN(陈斐),Jiajia HOU(侯佳佳),Gang WANG(王刚),Yang ZHAO(赵洋),Jiaxuan LI(李佳轩),Shuqing WANG(王树青),Lei ZHANG(张雷),∗,Wanfei ZHANG(张婉飞),Xiaofei MA(马晓飞),Zhenrong LIU(刘珍荣),Xuebin LUO(罗学彬),Wangbao YIN(尹王保),∗ and Suotang JIA(贾锁堂)
1 State Key Laboratory of Quantum Optics and Quantum Optics Devices,Institute of Laser Spectroscopy,Shanxi University,Taiyuan 030006,People’s Republic of China
2 Collaborative Innovation Center of Extreme Optics,Shanxi University,Taiyuan 030006,People’s Republic of China
3 School of Physics and Optoelectronic Engineering,Xidian University,Xi’an 710071,People’s Republic of China
4 Shanxi Xinhua Chemical Defense Equipment Research Institute Co.,Ltd.,Taiyuan 030006,People’s Republic of China
5 School of Science,North University of China,Taiyuan 030051,People’s Republic of China
6 National Energy R&D Center of Petroleum Refining Technology(RIPP,SINOPEC),Beijing 100083,People’s Republic of China
Abstract The self-absorption effect in laser-induced breakdown spectroscopy(LIBS)reduces the accuracy of quantitative measurement results.The self-absorption-free LIBS(SAF-LIBS)has been proved to directly capture the optically thin plasma spectra by setting an appropriate exposure time.In this work,a novel SAF-LIBS technique with high repetition rate acousto-optic gating is developed,in which an acousto-optic modulator is used as the shutter to diffract the optically thin fluorescence,and a high repetition rate laser is used to produce quasi-continuous plasmas to enhance the integral spectral intensity,so that the CCD spectrometer can replace an intensified CCD(ICCD)and echelle spectrometer in SAF-LIBS.Experimental results show that the average absolute prediction error of aluminum is reduced to 0.18%,which is equivalent to that of traditional SAF-LIBS.This technique not only effectively shields continuous background radiation and broadened spectral lines in optically thick plasma,but also has advantages of miniaturization,low cost,convenience and reliability.
Keywords:self-absorption-free LIBS(SAF-LIBS),self-absorption effect,optically thin plasma,high repetition rate laser,acousto-optic gating
1.Introduction
LIBS is a multi-element analytical technique that allows qualitative and quantitative analysis of complex samples with high efficiency and almost non-destruction.At present,it plays an essential role in industry,agriculture,medical treatment and other fields[1–8].The basic principle is that when a high-energy laser beam is focused onto a sample,the matter in the laser ablation zone evaporates and ionizes,resulting in a high-temperature plasma on the sample surface.As the plasma expands and cools after the laser pulse,the continuous background radiation is emitted from its interior species via bremsstrahlung and recombination radiation,and characteristic emission lines are emitted via spontaneous radiation.After a while,as electron number density and plasma temperature decrease,the continuous radiation gradually decreases.At this time,the characteristic spectral information of the elemental components in the sample can be extracted.The analyzed spectral line should be optically thin,which requires that the radiation from the plasma core is not considerably absorbed,attenuated,or scattered during outward propagation.However,the photons spontaneously emitted by the species in the plasma core may be absorbed by similar species with lower energy levels in the moving path,resulting in the so-called ‘self-absorption effect’.This effect will alter the measured intensities and linewidths of spectral lines,distort the calibration curve,and deteriorate the quantitative analysis results[9–11].
The self-absorption(SA)effect in LIBS cannot be eliminated,but some methods can be carried out to reduce the interference to quantitative analysis results as much as possible.These methods include theoretical plasma modeling,SA coefficient method[12],spectral line fitting[13,14],blackbody radiation[15],curve-of-growth(COG)[16],experimental parameter optimization[17],laser/microwaveassisted excitation[18],etc.For example,El Sherbiniet al[12]found that the SA in Al I 394.4 nm line is more severe than those in Al II 281.6 nm and Al II 466.3 nm lines,so they suggested correcting SA by calculating the SA coefficient from the plasma electron density.Brediceet al[13]used the intensity ratios of Mn line to reference line at different laser energies and delay times to calculate the SA coefficient to correct SA.Mansouret al[14]used four neutral lines and three ionic lines of Al to draw the Saha-Boltzmann plane and determine the electron temperature,and the isolated optically thin Hαline was used to correct the self-absorbed Al I lines.Liet al[15]proposed a blackbody radiation referenced SA correction(BRR-SAC)method,which corrects the SA in CFLIBS by directly comparing the measured spectra with the theoretical blackbody radiation model through iterative operations.Aguileraet al[16]used COG to investigate the spatial inhomogeneity and temporal evolution of the atomic and ionic lines of the plasma induced from Fe–Ni alloy.The COG theory,which relates the emission intensity to optical depth,is useful to describe the saturation of the line intensities due to SA.Moonet al[17]quantified the SA degree of atomic transitions by placing a spherical mirror behind the plasma,obtained the Voigt profile fitting of the emission lines with and without the mirror,and calculated the SA correction factor,which improved the linear range of calibration curve by an order of magnitude.Horňáčkováet al[18]analyzed the zeolite samples by laser/microwave-assisted excitation LIBS and weakened the SA effects on Si and Al spectral lines by reducing the ambient air pressure.In addition,Konjevićet al[19]mentioned another technique to evaluate the SA effect is to check doublet lines intensity ratio.D′Angeloet al[20]analyzed the line profiles of Mg II doublet transition for plasma characterization.Shahet al[21]found that the delay times where the plasma is optically thin which is also in the local thermal equilibrium(LTE)were 800 ns,900 ns and 1000 ns respectively by comparing the temporal evolution trend of the intensity ratio of the two Fe I lines with the theoretical value.It can be seen that the SA effect is mainly underestimated by theoretical calculations or special experimental devices,which still need to be further improved in practical industrial applications.Houet al[22]proposed a novel SAF-LIBS,which sets the optimal exposure time window by comparing the doublet lines intensity ratio with the theoretical value,so as to directly capture the optically thin fluorescence.The optically thin condition was verified by comparing the linearity of Boltzmann plot with the traditional SA correction method and evaluating the SA coefficients.They[23]further proved that the evolution trend of doublet intensity ratio is monotonous under the assumptions that the plasma is uniform and in LTE,and the area density is constant,and derived a rapid spectral line selection criterion for SAF-LIBS applications.
The SAF-LIBS was proposed based on the study of the mechanism of SA effect.It has been confirmed that there is an optically thin state in which the plasma is small and the radiated photons have no obvious attenuation and scattering[22].In this case,the SA effect can be approximately neglected,and the spectra are suitable for quantitative analysis.Different from other traditional correction methods,SAF-LIBS can avoid the influence of parameter errors of experimental instrument,and the weakening ability to SA is reflected in the linearityR2of Boltzmann plot in optically thin state,which reached 0.99.It also improved the linearity of the calibration curve of Al from 0.86 to 0.98 and reduced the average absolute error from 1.2%to 0.13%.
In SAF-LIBS,ICCD is used for instantaneous optical gating,and an echelle spectrometer needs to be configured accordingly to record the emission of plasma[22].The doublet intensity ratio of element can be calculated from the spectrum,and then compared with the theoretical ratio to determine the optimal exposure time window(further discussion of calculation in section 2.2),so as to capture the fluorescence of optically thin plasma by setting the gating of the ICCD.SAF-LIBS can be realized by measuring at optically thin time and setting appropriate experimental parameters.A challenging problem is that the system is large,fragile and expensive,which is difficult to be applied in practice.One of the major aims of the work was to realize SAF-LIBS with compact CCD spectrometer instead of ICCD and echelle spectrometer.However,the minimum integration time of a typical CCD spectrometer is too long(a few milliseconds),which exceeds the lifetime of plasma.If a device that can accurately control the gating time is installed in front of the CCD spectrometer,the emission from the plasma within the optically thin time window can be collected.The opening time of this device shall be less than the time between the laser pulse and the optically thin time window(∼100 ns).In addition,considering the entire plasma lifetime(∼10 μs),the optical switching frequency shall be less than 100 kHz,and the gating time shall be close to the optically thin time window.Acousto-optic modulator(AOM)as an external modulation device with high modulation frequency(kHz–MHz),is based on the photo-elastic effect or the interaction of sound and light in a crystalline material.An acoustic wave is generated within the crystal by applying a radio frequency drive signal to a piezoelectric transducer.This causes periodic variations in the refractive index by creating zones of compression and rarefaction in the crystal bulk.The response time of AOM is 30–80 ns,the working frequency is kHz–MHz,the pulse width of the trigger drive is 10 μs,and the gating time is 400 ns,all of which satisfy the requirements of SAF-LIBS for optical gating switch.The first-order diffraction of plasma fluorescence is modulated by AOM,and then,the emissions with specific delay time are sent into the spectrometer to achieve the purpose of time gating.The gating speed of AOM is fast enough to exclude the continuous background and broadened spectral lines while efficiently preserving the characteristic lines[24].However,the sensitivity of CCD is extremely lower than that of ICCD.For example,for a 10 Hz pulsed laser,it needs continuous exposure for more than 10 min to obtain an optically thin spectrum with the same signal-to-noise ratio(SNR)as ICCD.Therefore,the diode pump solid state(DPSS)laser with repetition rate up to 100 kHz should be selected as the excitation source,which has a higher duty cycle and a significant increase in the number of plasma spectra[25],so as to enhance the spectrum and realize rapid measurement.
In this paper,a new SAF-LIBS technology is proposed,which uses a DPSS laser,an AOM and a compact spectrometer as the excitation,optical gating and spectral acquisition devices respectively.We collect the plasma fluorescence and investigate the spatio-temporal evolution,so as to verify the feasibility of optically thin fluorescence collection,and evaluate its quantitative measurement performance.
2.Experimental and methodology
2.1.Experimental set up and sample preparation
The schematic diagram of the experiment setup is shown in figure 1(a).The excitation source used in the experiment was a Q-switched DPSS Nd:YVO4laser(Bright solutions,Italy,Onda 1064/532 nm)with 2–2.5 mm beam diameter operating at up to 100 kHz at 1064 nm.The laser pulses were first reflected by a mirror with reflectivity of 99%,then passed through a half-wave plate and a PBS,and finally focused on the sample fixed on a rotating stage,and generated plasmas in the ablation zone.The emission spectra were collected and focused onto the plane located behind the active medium of the AOM(Isomet,1206C-2-1002)by an optical fiber with two couplers.The optical medium of the AOM with standard transmission range of 340–420 nm and average shift of 5.8 mrad at the central wavelength of λ=390 nm is TeO2.As shown in figure 1(b),the spatial separation of zero-order and first-order diffractions occurred over the entire spectral region.When the Bragg grating was introduced into the internal crystal of AOM,the fluorescence was dispersed by diffraction.In order to ensure that only the first-order diffracted light was transmitted into the compact CCD spectrometer(Avantes,ULS2048XL-2-USB2,360–450 nm)through a convex lens with focal length of 75 mm,a circular arc slice was used to block the zero-order diffracted light.The delay time ranged from 200 to 800 ns,the integration time was 5 s,and the timing control between the laser,AOM,and spectrometer was performed by a delay generator(SRS,DG535).
The samples were uniform mixtures of dry powder of pure KBr and Al2O3,which were pressed into tablets under a pressure of 30 MPa.The aluminum content range of the samples was 5 wt%–19 wt%with relative standard deviations of 0.03 wt%–0.05 wt% due to the weighing error of the electronic analytical balance(0.001 g),and the mass of each tablet was 10 g.
In order to improve the repeatability of the spectra and compensate for the inhomogeneity of sample points,20 plasma spectra of each sample were collected under the same experimental conditions and averaged as the analytical spectrum after deducting the continuous background.
2.2.Criterion of optically thin state
Assuming that the optically thin plasma satisfies the local thermodynamic equilibrium,the measured integral line intensity can be expressed as:
The intensity ratio of doublet lines in the same ionized state can be expressed as[21]:
whereI1,0andI2,0are the theoretical intensities of the emission lines when the species transition from energy levelsktoiandntom,respectively.If the upper energy levels of the doublet lines are close,the effects of Boltzmann factor and temperature on the intensity ratio can be neglected.So,the exponential can be regarded as 1.The simplified formula is:
So the intensity ratio can be calculated according to the spectroscopic parameters[22]of the emission lines,which can be further used as the criterion of optically thin state.The occurrence time of optically thin state can be determined by comparing the measured values with the theoretical one of two atomic or ionic spectral lines at different delay times.In this work,the theoretical doublet intensity ratio of Al I 396.15 nm and Al I 394.40 nm is 1.97[22].
2.3.Timing scheme
The response of each instrument and the timing control scheme is shown in figure 2(a).Whent=0,the Q-switch of the laser pulse is opened,and the laser induces the sample to produce transient plasmas and triggers the delay generator to start timing.Att=t1,a square pulse signal with a width of 10 μs is input into the AOM,and the AOM is triggered by the falling edge of the square pulse signal,as shown in figure 2(b).Withint=t2−t1,the Bragg grating is formed inside the AOM.t=t3−t2represents the time window during which the plasma fluorescence is first-order diffracted into the spectrometer by AOM.Aftert=t3,the output of the AOM is zero-order diffraction.The time of each laser pulse is regarded as one cycle.With this timing scheme,the delay generator can be used to control the working time of the laser,spectrometer,and AOM.The gating time of AOM corresponds to hundreds of nanoseconds after plasma formation,which can accurately make the fluorescence of optically thin plasma pass through.
3.Results and discussion
3.1.Spectral optimization
The atomic doublet lines of Al I 394.4 nm and Al I 396.15 nm located in the working wavelength range of the AOM(340–420 nm)were used for subsequent studies,typically as shown in figure 3(delay time of 400 ns,collection angle of 45°,tablet with 10 wt% aluminum).The spectral intensity used in the experiment is the integral spectral intensity after a certain pretreatment.The characteristics of plasma are affected by the laser repetition rate,thus affecting the intensity of spectral signal.The SAF-LIBS technique can directly capture the optically thin time window by comparing the measured doublet intensity ratio with the theoretical one,and the proposed timing scheme in this work is used to achieve control of the delay time.The influence of laser repetition rate on spectral intensity under specific gating time and fixed gate width is discussed below.Figure 4(a)compares the Al I doublets ablated from tablet containing 10 wt% aluminum by 1–50 kHz repetition rate laser at 400 ns.It can be seen that the doublet intensity increases gradually in the range of 1–10 kHz,reaches the maximum at 10 kHz and decreases rapidly above 10 kHz.Figure 4(b)shows the relationship between the normalized intensity of Al I 396.14 nm line and Al content at laser repetition rate of 1–50 kHz.Here,the line intensity of Al I 396.15 nm was normalized by the integral of the whole spectrum.The normalized intensity increases gradually with the increase of Al content,and the results show thatR2is as high as 0.97 when the laser repetition rate is 10 kHz.It should be noted that the different fitting ranges of intensity create an optical illusion that the linearity at 10 kHz seems to be even worse than others.The reason can be attributed to the fact that the pulse energy output by the DPSS laser with repetition rate below 5 kHz is relatively constant,but at this time,fewer plasmas reduced the SNR of spectral lines,resulting in poor calibration results.However,at higher repetition rate,the power of pump diode cannot meet the requirement of maintaining stable population inversion,which led to the reduction of pulse energy.Therefore,10 kHz was selected as the optimal operating repetition rate of laser pulses for subsequent measurements.
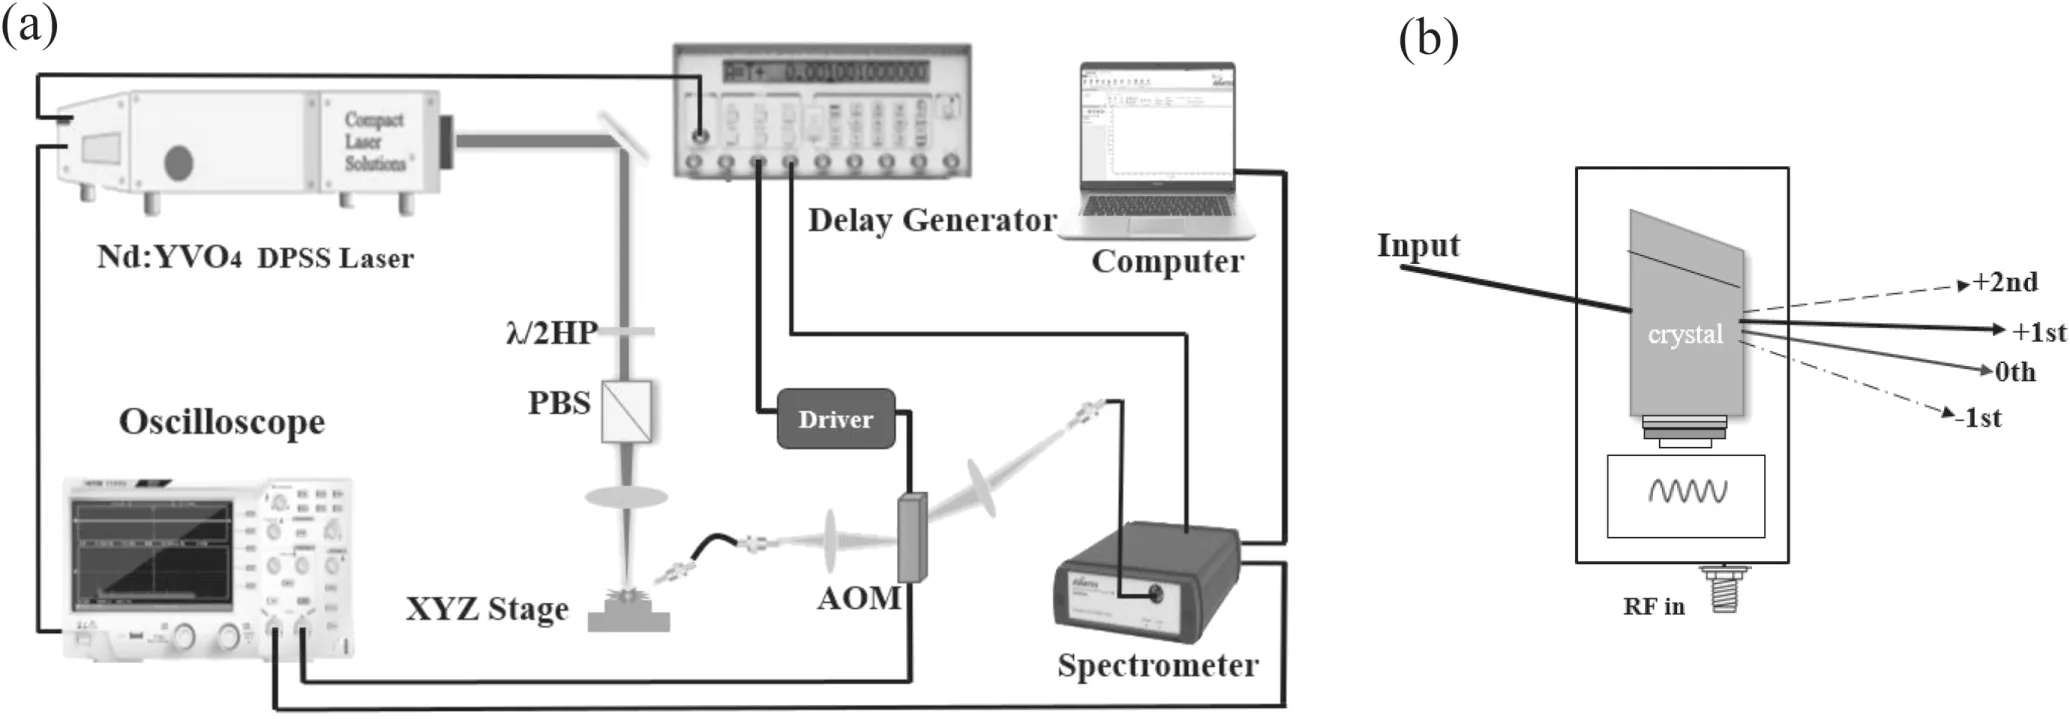
Figure 1.(a)Experimental setup for high repetition rate acousto-optic gating SAF-LIBS,(b)schematic diagram of AOM.
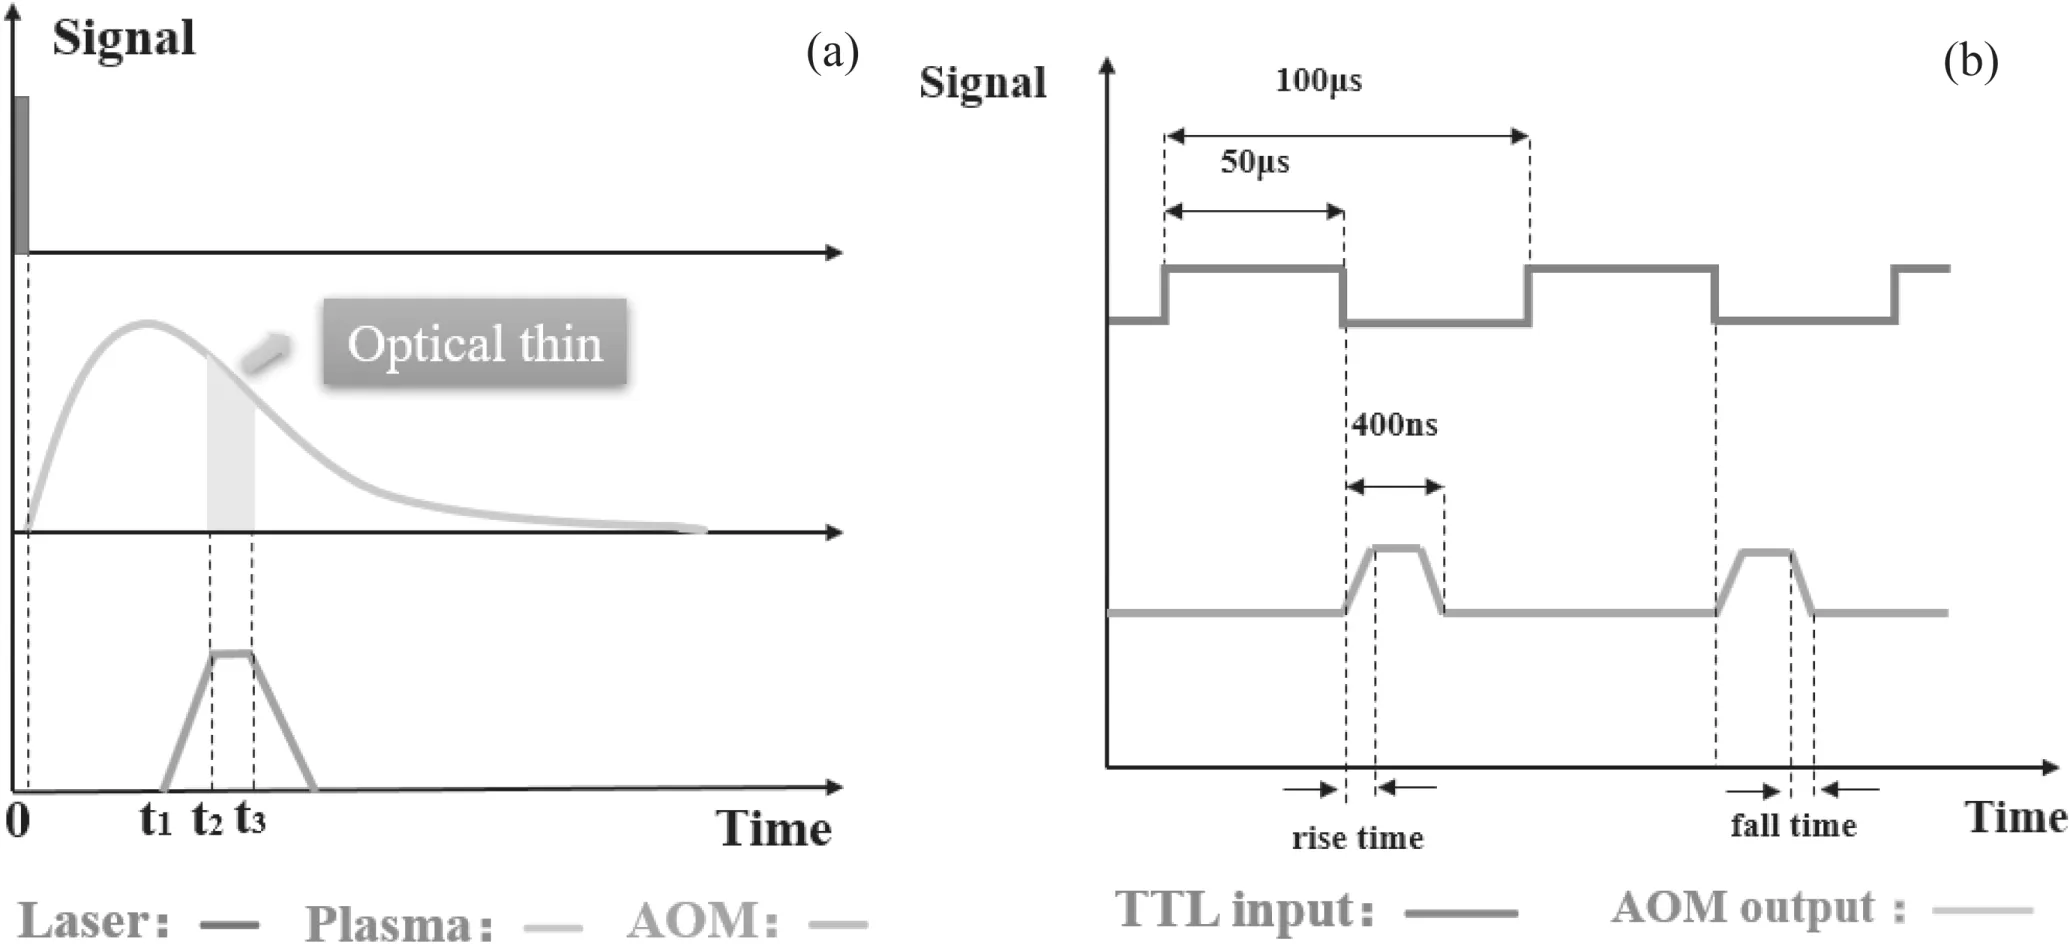
Figure 2.Graphic diagrams of the(a)timing scheme and,(b)working time of AOM.
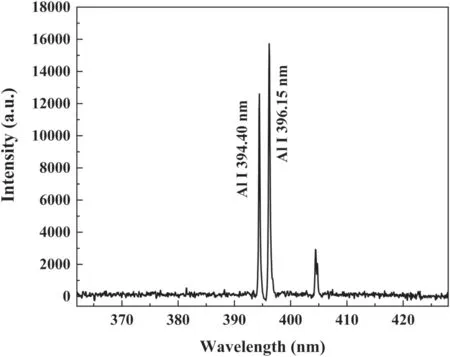
Figure 3.Typical averaged plasma spectra.
3.2.Spatio-temporal evolution
Because the emission spectrum of laser-induced plasma is closely related to its spatio-temporal evolution,it is necessary to optimize the spectral acquisition parameters such as delay time and collection angle of high repetition rate acousto-optic modulated SAF-LIBS setup.By matching the theoretical ratio with the measured values at different delay times,one can find out the time interval(at a delay time oftotwith a certain integration time)where the plasma conditions are as close as possible to optical thinness for the lines investigated.Figure 5(a)shows the doublet intensity ratios of 13 wt% Al pressed tablet at laser repetition rate of 10 kHz with fiber collection angles of 10°,25°,35°,45°,55°,70° and 80°,wherex-axis is the delay time,y-axis is the doublet intensity ratio,and the red horizontal dashed line is the theoretical doublet intensity ratio of 1.97.It can be seen that the intensity of Al I 394.4 nm decreases more slowly than that of Al I 396.15 nm at any collection angle.Compared with the theoretical value of the Al doublet intensity ratio,thetotat different collection angles can be derived.It is worth noting that thetotappeared to be different at various angles because it is closely related to the composition of the elements,electron density,plasma temperature,and other related factors.In addition,thetotand SNR versus the collection angle are shown in figure 5(b),which shows that the SNR reaches the highest at 45°andtot=426 ns.Here,SNR refers to the ratio of integral intensity of spectral line to noise.
By comparing the doublet intensity ratio of tablets with aluminum content of 5 wt%–19 wt% with the theoretical value in the range of 200–800 ns,it can be found in figure 6(a)that the ratio changed with the delay time,and at the same delay time,it decreased with the increase of aluminum content.For tablets with Al content of 5 wt%–16 wt%,thetotis approximately 400±100 ns.Since the interval of delay time used was 200 ns,thetotcan be considered as 400 ns.
Figure 6(b)shows a monotonic decreasing trend between the aluminum content andtot,in which the red curve represents the exponential fitting curve with correlation coefficientR2=0.893.The Al content corresponding totot=0 is 20.4 wt%,which is called the optically thin threshold content,that is,the optically thin spectral line can be obtained by SAFLIBS only when the Al content is less than 20.4 wt%.That is why we choose samples with content below 20 wt%.
As discussed above,the delay time and fiber collection angle of the experimental setup were set to 400 ns and 45°,respectively.
3.3.Quantitative analysis and validation
The accuracy of quantitative analysis results is an important criterion to evaluate the effectiveness and practicability of analysis technology.Here,the line intensity of Al I 396.15 nm was normalized and then evaluated by simple univariate quantitative analysis.Tablets with Al contents of 5 wt%,6 wt%,7 wt%,9 wt%,10 wt%,13 wt% and 16 wt% were used for calibration,and those with Al contents of 8 wt%and 11 wt% were used for prediction(labeled 1 and 2 in figure 7(b)).Figure 7(a)shows the calibration curves using Al I 396.15 nm line at 200 ns,400 ns and 800 ns,where purple squares,purple circles and purple triangles represent the Al content of the prediction samples as determined by the present procedure at 200 ns,400 ns and 800 ns,respectively.It can be seen that the calibration curve at 400 ns has the best linearity(R2=0.982).Figure 7(b)shows a comparison of quantitative analysis results of Al between optically thin time(the delay time was 400 ns)and non-optically thin time(the delay times were 200 and 800 ns),in which each sample was measured six times.For the former,the absolute measurement errors are 0.1% and 0.26%,respectively,and the average value is reduced to 0.18%.For the latter,the absolute measurement errors are estimated to be 0.55% and 1.05%,respectively,with an average of 0.8%.This proves that high repetition rate laser can perform more accurate component analysis in the optically thin time window.Figure 7(b)also shows the quantitative analysis and prediction results without AOM,that is,there is no time gating for plasma spectra measurement.It can be seen that the average error is as high as 0.61%,showing poor quantitative analysis accuracy.In general,the high repetition rate acousto-optic SAF-LIBS can perform the most accurate component analysis.
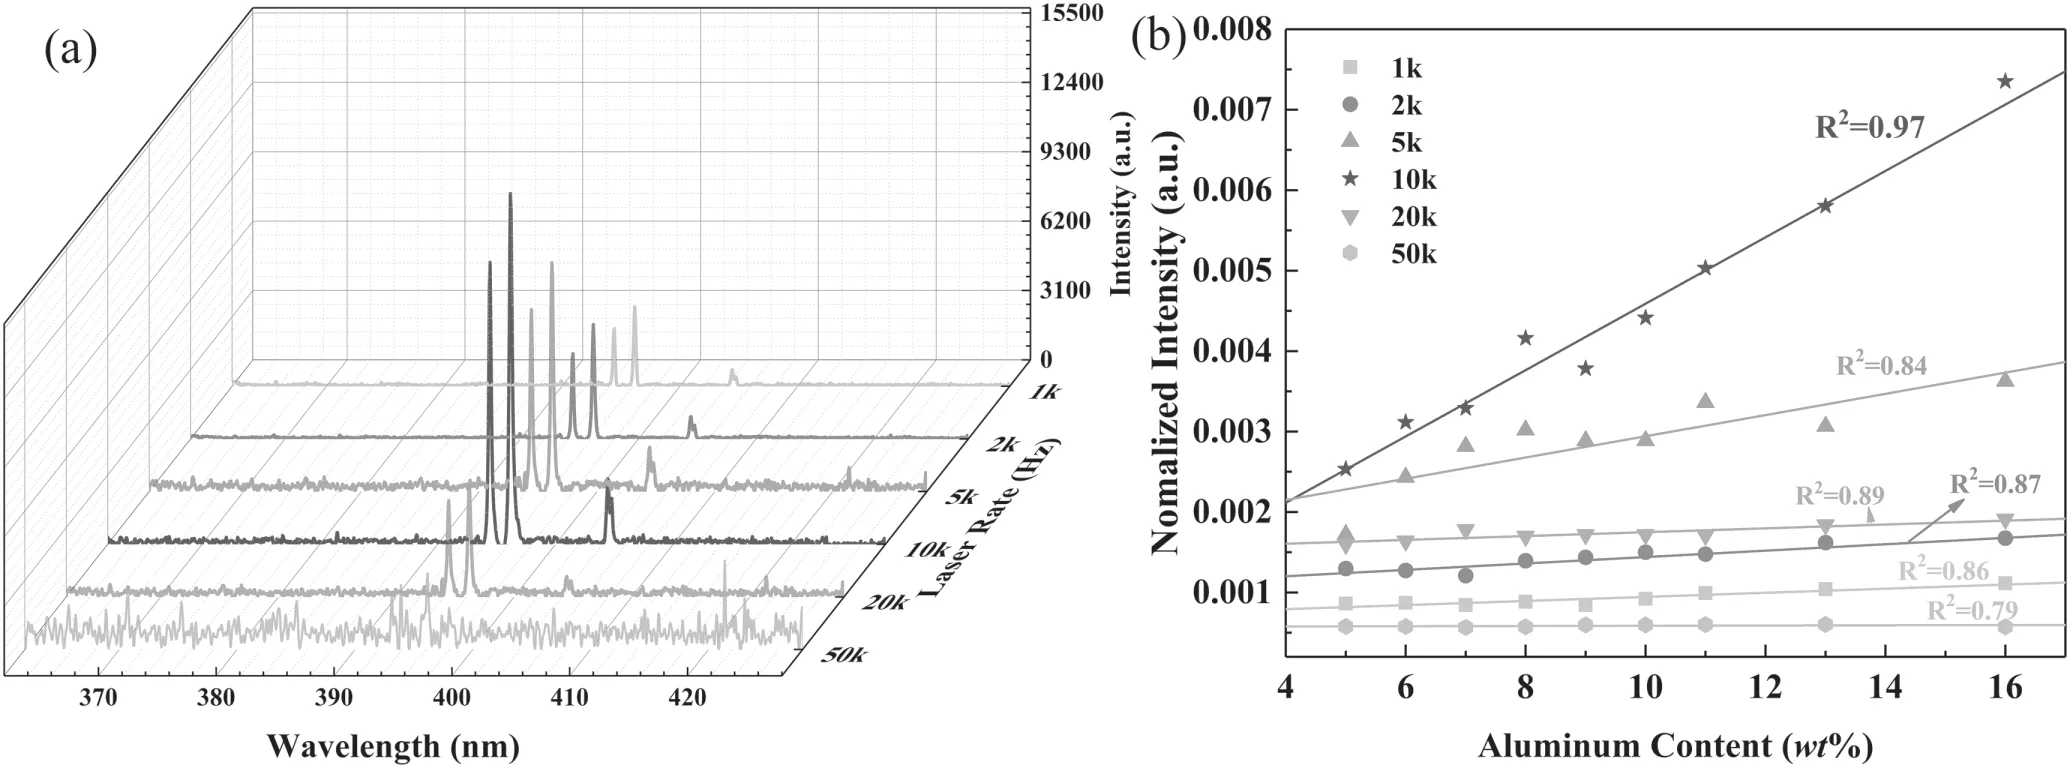
Figure 4.(a)Al I doublet lines and,(b)relationship between normalized intensity of Al I 396.14 nm and Al content at different laser repetition rates.
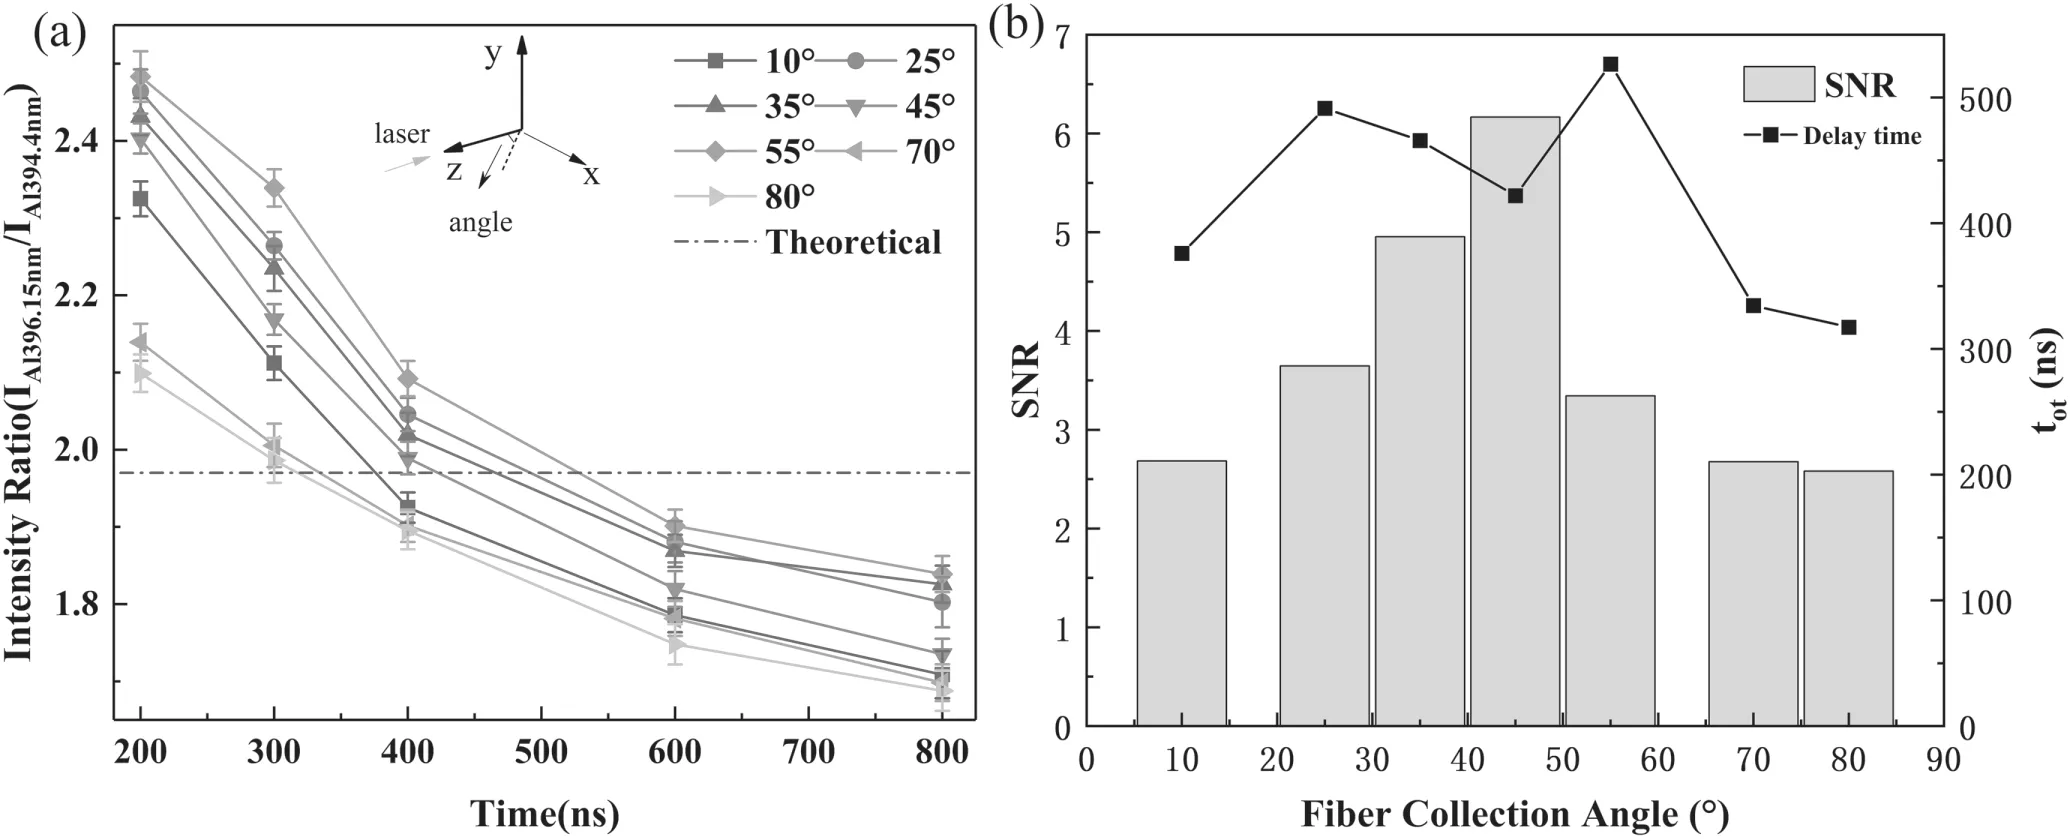
Figure 5.(a)Temporal evolution of the Al doublet intensity ratio,(b)the tot and SNR values for different fiber collection angles.
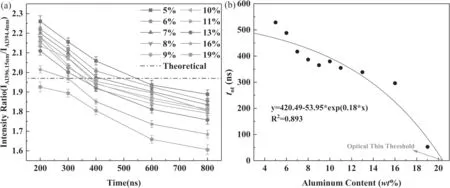
Figure 6.(a)Temporal evolution of Al I doublet intensity ratio,(b) tot values for different aluminum contents.
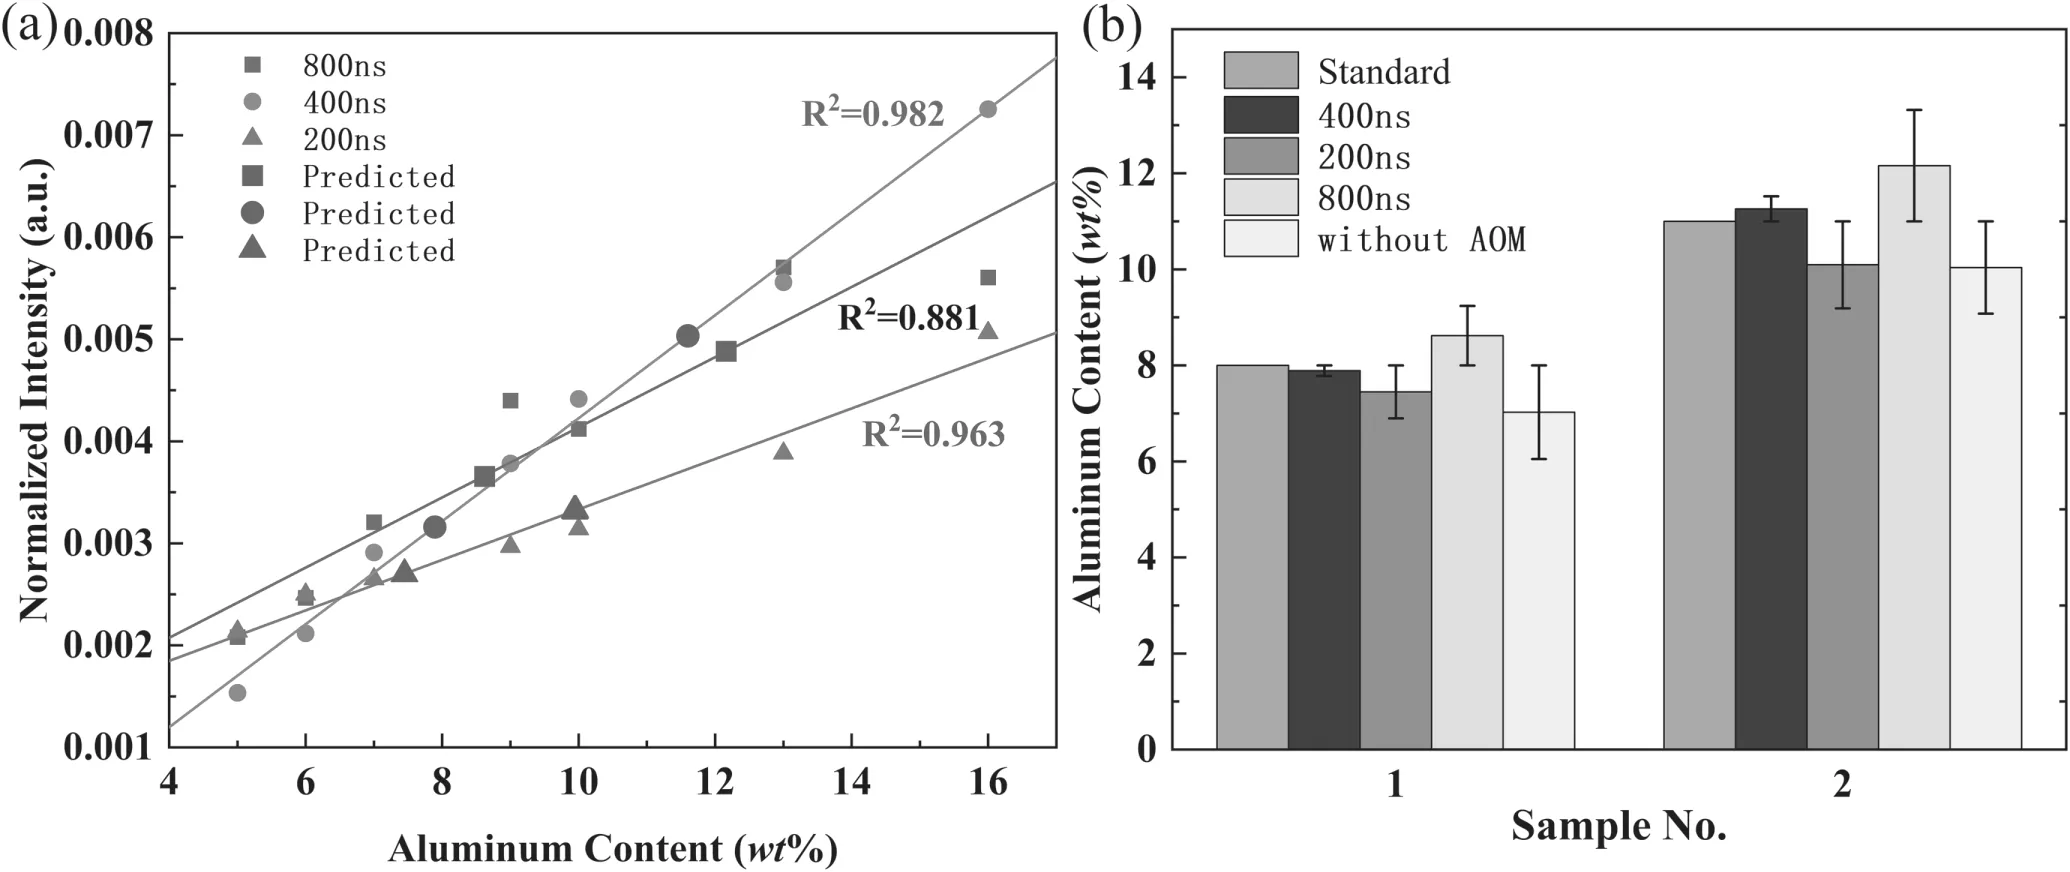
Figure 7.(a)Calibration curves of Al,(b)comparison of calibration results of aluminum under different experimental parameters.
4.Conclusion
In this paper,a miniaturized,cheap and reliable SAF-LIBS system,high repetition rate acousto-optic gated SAF-LIBS,was developed.A high repetition rate laser was used as the excitation source and an AOM was used as the gating switch of the CCD spectrometer,replacing the ICCD and echelle spectrometer in the traditional SAF-LIBS setup.The high repetition rate pulsed laser can overcome the defect that the sensitivity of CCD is far lower than that of ICCD,and AOM can replace the narrow pulse shutter of ICCD and be used as a nanosecond acousto-optic gate.The maximum spectral intensity and the best linearity were obtained at laser repetition rate of 10 kHz.The temporal evolutions of the atomic doublet intensity ratio of Al under different fiber collection angles were investigated,and the optimal delay time of 400 ns and collection angle of 45°were determined.The linearityR2of the calibration curve of Al was as high as 0.98,which demonstrates the feasibility of the new SAF-LIBS for accurate quantitative analysis.The limitation is that it is only suitable for samples with element content within a certain range,for example,the Al content cannot exceed 20.4 wt%.Nevertheless,the analysis error was greatly reduced from 0.8% of the traditional LIBS to 0.18%,which is almost equivalent to that of the previous large SAF-LIBS system(∼0.13%).The high repetition rate acousto-optic gated SAFLIBS not only reduces the system volume and cost,but also does not lose accuracy,which will undoubtedly promote SAF-LIBS from laboratory to industrial application.
Acknowledgments
This work is supported by National Key R&D Program of China(No.2017YFA0304203);National Energy R&D Center of Petroleum Refining Technology(RIPP,SINOPEC);Changjiang Scholars and Innovative Research Team in University of Ministry of Education of China(IRT_17R70);National Natural Science Foundation of China(Nos.61975103,61875108,61775125 and 11434007);Major Special Science and Technology Projects in Shanxi(No.201804D131036);111 Project(No.D18001);Fund for Shanxi ‘1331KSC’.
杂志排行
Plasma Science and Technology的其它文章
- Quasi-coherent mode in core plasma of SUNIST spherical tokamak
- High-resolution x-ray monochromatic imaging for laser plasma diagnostics based on toroidal crystal
- Numerical study of viscosity and heat flux role in heavy species dynamics in Hall thruster discharge
- A study of the influence of different grid structures on plasma characteristics in the discharge chamber of an ion thruster
- Focused electron beam transport through a long narrow metal tube at elevated pressures in the forevacuum range
- A nanoparticle formation model considering layered motion based on an electrical explosion experiment with Al wires
