Pressure drop of structured packing in pilot column and comparison to common correlations
2023-02-28EmilMadsenRandiNeerupArneGladisJensrsboeNicolasvonSolmsPhilipFosb
Emil Madsen, Randi Neerup, Arne Gladis, Jens K.Jørsboe, Nicolas von Solms, Philip L.Fosbøl
Center for Energy Resources Engineering (CERE), Department of Chemical and Biochemical Engineering, Technical University of Denmark (DTU), Søltofts Plads 229, 2800 Kgs.Lyngby, Denmark
Keywords:Pressure drop correlations Packed columns Structured packing Fluid dynamics
ABSTRACT Packed columns are widely used in the chemical industry such as absorption, stripping, distillation, and extraction in the production of e.g.organic chemicals, and pharmaceuticals.Pressure loss and pressure drop correlations are of special interest when it comes to the hydrodynamic properties of a column.The pressure loss across the column is of interest in the design phase when the size of the blower to drive the gas stream through the column has to be decided.The loading point and flooding point are also influenced by the pressure loss and the area of operation is determined from these points.This work examines four different correlations on pressure drop.The correlations are (i) Ergun’s equation (1952), (ii) an improved version of Ergun’s equation by Stichlmair, Bravo, and Fair (1989), (iii) an equation developed by Billet and Schultes (1999), and (iv) an equation by Rocha, Bravo, and Fair (1993).The complexity of the correlations is increasing in the mentioned order,Ergun’s equation being the simplest one.This study investigates if the more complicated correlations give better predictions to pressure drop in packed columns.This is determined by comparing the correlations to experimental data for pressure drop in a packed column with 8.2 m of structured packing using water as the liquid and atmospheric air as the gas.Seven experiments were carried out for determining the pressure drop in the column with liquid flows varying from 0 to 500 kg·h-1.At constant liquid flow,the gas flow was varied from approximately 10 to 70 kg·h-1.The pressure drop across the non-wetted column was best described by the correlation by Rocha et al.while the pressure drop for liquid flows from 100 to 500 kg·h-1 was, in general, best described by Stichlmair’s equation.For an irrigated column, the highest deviation was a predicted pressure drop 69.6%lower than measured.The best prediction was 0.1%higher than the measured.This study shows,surprisingly,that for a system of water and atmospheric air,complicated correlations on pressure drop determination do not provide better estimates than simple equations.
1.Introduction
To reduce the emissions of CO2produced by the combustion of fossil fuels, solid waste, and biological matter the carbon capture and storage (CCS) technology could play an important role in mitigating climate change.It is of great importance to reduce CO2emissions by optimizing and improving existing production processes and reducing the use of fossil fuels.
The post-combustion CO2capture technology is the most viable option as it can be retrofitted to existing plants and can be applied to many industries such as biogas upgrading, fossil fuel power plants, and cement industries.Furthermore, the technology has been proven to capture more than 90%of CO2[1-5].To implement this technology in large-scale plants a deeper understanding of upscaling and optimizing equipment is needed.
The absorber column is a key component of a CCS plant and contributes significantly to the cost [6].The pressure drop is an important variable for the design and operational conditions of the absorber [7].The energy consumption in a post-combustion plant often depends on the pumps, blowers, boilers, and quality of heat exchangers used [6,8,9].The blower up-front of a scrubber is dependent on the pressure loss in the absorber [6,9].Pressure drop in packed columns is crucial to understand in order to optimize blower performance and to reduce energy and cost needed for the design of the equipment,upstream of an absorber.The pressure drop is determining the size of the blower, which must overcome the pressure drop to impel the gas through the column upwards against the downflowing liquid.The importance of pressure drop is acknowledged by many investigators since the pressure drop is directly related to the power consumption by the blower needed to pass the air through the column[10].It is in general found that newer structured packings show lower pressure drops compared to random packings[7,11],due to a higher porosity [12].In a case study by Gandhidasan[10] of four different random packings and three structured packings, it was found that Mellapak 250Y had the lowest pressure drop.
Pressure drop in packed columns are well studied [6,13-18].One of the earlier correlations was introduced in 1938 by Sherwood et al.[13].They investigated the flooding velocities of the CO2-, H2-, and air-water systems in a tower with carbon Raschig rings.Ergun and Orning [16] developed an equation relating pressure drop to gas flow.The equation was found to be a linear function of fluid mass flow rate and pressure gradient.
Zakeri et al.[6] measured experimentally the pressure drop in three different types of packing on a column with a packing height of 5 m.A good agreement was found between the experimental results and estimates based on software from the packing material suppliers.Rocha et al.[17]developed a model for the prediction of pressure drop in columns with structured packings.Parameters such as the texture of the packing surface and wettability are incorporated into the model.The model showed fairly good predictions.
Billet and Schultes [15] calculated gas and liquid side mass transfer coefficients, pressure drop, loading and flooding point,and liquid hold-up using a physical model.The model is based on physically proven conditions considering the conditions of fluid dynamics in mass transfer columns and the kinetics.The model was validated with experimental results from the largest database in the world on pressure drops [15].The calculated results gave small deviations from the experimental data.A general model for the prediction of pressure drop of counter-current gas-liquid packed columns was developed by Stichlmair et al.[18].The model was validated for both random and structured packing and it showed fairly good results, especially for random packing.Stichlmair et al.concluded that the model was unreliable in the region with high gas velocities and low liquid rates.
The data quoted in the original work by e.g.Billet and Schultes[15]laid the basis for many important general correlations,but the data was never published and lacks the possibility of developing new basic theories for pressure loss.This is the reason why we focus on measurements of pressure drop.
In this work, correlations for pressure drop are compared and benchmarked.The results are validated by measured pressure drops from an experimental packed column, operated with structured packing.The used correlations are developed by Ergun[19], Stichlmair et al.[18], Billet and Schultes [15], and Rocha et al.[17].The further aim is to evaluate if more advanced models are most suitable for determining pressure drop.
The prediction of pressure drops in packed columns is useful for the design of the column and the determination of operating conditions to avoid flooding.Flooding is the critical operating condition as the column is totally ineffective and mass transfer is drastically hindered [15].
The loading and flooding points have been discussed for several years, and there exist numerous definitions in the literature.In 1966, Silvey and Kelly [20] presented a selection of 10 different flooding point definitions.They state that the literature data is marked with a high degree of inconsistency and confusion due to the multitude of definitions.This confusion has only increased.A survey presented by Kister and Gill in 1991 [21] listed twice as many flooding point definitions.Factors to identify flooding listed in the definitions include a sharp rise in pressure drop and liquid hold-up, the appearance of liquid on the top of the bed, excessive entrainment, and a sharp drop in efficiency.Many definitions use subjective terms as ‘‘a very high value,”or ‘‘appreciable amounts”,while other definitions use arbitrary criteria as‘‘the gas velocity at which liquid builds to a height of about 0.5 in.above the packing”[20].
Due to this confusion,some designers have argued that the use of flooding points as the upper capacity limit should be abandoned,and instead maximum operational capacity or maximum permissible pressure drop should be used [21,22].Others recognize the limitations of the flooding points but still stick to this definition[23-26].
Various ways of defining the loading point are also found in the literature, for example, the ones given by Billet [27], Kunesh [28],and Strigle [21].
The high uncertainty in defining the loading and flooding points may question the need for elaborate correlations.Silvey and Kelly[20] state, that none of the definitions are necessarily equivalent and that the various methods of defining the flooding point can give results that are either higher or lower than each other.Hence,it is entirely possible that very little of the data reported in the literature actually represents flooding conditions.
In this paper, the definition by Billet and Schultes [15] is adopted.The design of columns with structured and dumped packing types generally takes place at gas flows of 70%-80% of the gas flow which would result in flooding[15].Above the loading point,which is usually about 70% of the flooding load, the mass transfer initially increases when the wetting of the column becomes larger,and thereby the mass transfer interface increases.Close to the flooding point, the efficiency of the column drops drastically and according to Billet and Schultes, it is uneconomical to operate absorption, desorption, and rectifying columns with loads over 80% of the flooding load [15].
Since the flooding point can be experimentally observed, this point is much easier to determine from experiments than the loading point.
The Ergun equation and the Stichlmair equation were chosen in this work to be examined due to their simplicity,and since they are the most well-known equations describing pressure loss found in the literature.The equations by Billet and Schultes and by Rocha et al.were chosen since they are related to mass transfer calculations, which is another highly important aspect when describing absorption columns.
This work can enable a more precise and accurate engineering of packed columns with a potential for cost reduction on sizing any blower or materials used for the implementation of the scrubbing tower.
The findings are beneficial for industries dealing with gas-liquid separation such as biofuel-, food-, pharmaceutical-, and welding applications.
2.Pressure Drop Correlations
In this work four different correlations are compared:
i.the Ergun equation [19],
ii.an improved version of Ergun’s equation developed by Stichlmair et al.[18],
iii.an equation developed by Billet and Schultes [15], and iv.an equation by Rocha et al.[17].
These four equations are introduced and discussed in the following sections.
2.1.The Ergun equation
Ergun presented his original equation in 1952[19]and it is the most simple correlation that will be put to test in this work.In this equation, the pressure drop per meter of packing, ΔPd/Z (Pa·m-1),for a non-wetted column is determined by
where f is the friction factor, ε is the porosity of the packing(m3·m-3),ρgis the density of the gas(kg·m-3),Ugsis the superficial velocity of the gas in an empty tower(m·s-1),and dpis the diameter of the particle (m).The friction factor f is given by
Re is the Reynold’s number given in Eq.(8).
The pressure drop for a wetted column is higher than for a nonwetted column at the same gas flow, due to the liquid in the column, which will start to accumulate at high gas flows.The liquid hold-up hL(m3liquid/m3empty tower) accounts for this and is given by
where the Froude’s number Fr is expressed by
where ULsis the superficial velocity of the liquid in an empty tower(m·s-1),a is the packing surface area(m2·m-3),and g is the gravitational constant (m·s-2).
From the liquid hold-up and the pressure drop for the nonwetted column, ΔPd, the pressure drop over an irrigated column can be calculated from
To calculate the pressure drop for an irrigated column,the pressure drop for the non-wetted column has to be calculated first.The constant c for a structured packing is -0.38 [29].The equation is only valid up to the loading point from which the equation for the liquid hold-up is no longer valid since the liquid will start to accumulate.If the liquid hold-up is experimentally determined in the entire range, the equation for the pressure drop will be valid up until the flooding point [18].
2.2.The Stichlmair equation
Since 1952, the original version of Ergun’s equation has been improved and presented by Stichlmair et al.[18].The improved version of Ergun’s equation by Stichlmair et al.is also found in Ullmann’s Encyclopaedia of Industrial Chemistry [30].
The pressure drop for a dry column per meter of packing,ΔPd/Z,from the Stichlmair equation is calculated from
where dpis the diameter of the particle (m),and ξ0is the new friction factor which is given by:
Here,μgis the dynamic viscosity of the gas (kg·m-1·s-1).
One of the most important changes from the original Ergun’s equation into the new improved version,Stichlmair et al.[18]concluded to be the changed exponent of the porosity.The exponent of the porosity in the original version of the equation is said to be oversimplified and has never been validated experimentally,while the exponent of the porosity in the improved version is based on a large amount of experimental data for particles with very different porosities.Due to this extension, the pressure drop can be determined from the knowledge of the friction factor for one single particle expressed by the term ξ0.In the original version of Ergun’s equation, the friction factor f is for the entire layer of particles though without any packing-specific constants.
Through the friction factor ξ0,Eq.(9),the Stichlmair equation is considering the specific packing material.The factor depends on the constants C1,C2,and C3,which are specific to the given packing.For Mellapak 250Y, the constants take the following values of C1=5, C2=3 and C3=0.45 [18].
After the pressure drop over the non-wetted column has been calculated, the pressure drop ΔP over an irrigated column at the same gas flow can be calculated from Eq.(5) as for the irrigated pressure drop for Ergun’s original equation.Hence, the difference between the pressure drops from Ergun’s equation to the Stichlmair equation only lies in the calculation of the dry pressure drop.
2.3.The correlation of Billet and Schultes
More advanced than Ergun’s and Stichlmair’s equations is the correlation developed by Billet and Schultes [15].In this case, the pressure drop for a non-wetted column ΔPd/Z is calculated by
where Fgis the F-factor,K is the wall-factor,and Ψ0is the resistance coefficient for a non-wetted column.
The wall-factor K considers the increased void fraction at the column wall, as dkis the diameter of the column (m).
The resistance coefficient Ψ0is dependent on the packingspecific constant CP,0which for Mellapak 250Y is 0.292.
The resistance coefficient is also dependent on Reynold’s number Re, which is, in this case, also dependent on the wall-factor K and the kinematic viscosity of the gas νg(m2·s-1).
For calculation of the pressure drop over an irrigated column,ΔP/Z, the following equation is given:
where the resistance coefficient for an irrigated column ΨLis given by:
with C1being a packing constant, Fr Froude’s number,hLthe liquid hold-up,and hL,sthe liquid hold-up at and above the loading point.
The new defined liquid hold-up hLconsiders the viscosity μLand the density ρLof the liquid.The equation is valid up until the loading point, from which point the liquid hold-up is called hL,s.The liquid hold-up from the loading point and up to the flooding point can be calculated why the equation for the pressure drop is valid up until the flooding point.To calculate the liquid hold-up above the loading point, Billet and Schultes require a larger set of equations to be solved.These equations will not be presented in this work since the Ergun equation and Stichlmair’s equation are not valid above the loading point and hence not comparable.For gas flows below the loading point, hL,sis equal to hL.When using this simplification, the validity of the equation for calculating the pressure drop over an irrigated column is limited to only be valid below the loading point since only hLis estimated.
2.4.The correlation by Rocha, Bravo, and Fair
The correlation presented by Rocha et al.[17] is developed specifically for corrugated structured packing.The pressure drop for a non-wetted column is given by
where the constants A and B are calculated from:
S is the hydraulic diameter (m), and θ is the angle with horizontal for the falling film or corrugation channel (degrees).
The constants A and B are said by Rocha et al.to be dimensionless constants that are used in the calculation of the pressure drop for the non-wetted column.An analysis of the dimensions of the ingoing factors will, however, show that A and B are in fact not dimensionless.The constants have units without physical meaning, but the calculation of the pressure drop with these units will still give a pressure drop with the unit of Pa.
The pressure drop for an irrigated column is given by
where the correlation constant K2is given by
hLdescribing the liquid hold-up in this set of equations is more complex and is given by:
Ftis a correction factor for total hold-up due to effective wetted area using the Weber’s number We, Froude’s number Fr, and Reynold’s number Re are given as
where gcis only a gravity conversion factor which is set to 1.0.σ is the surface tension(N·m-1).γ is the contact angle between the solid and liquid film (degrees).The following is applicable for this:
The force that makes the liquid go downwards through the column is gravity.On the liquid some opposing forces are also acting:liquid buoyancy, gas pressure drop, and drag on the liquid film by the gas.Therefore,an effective gravity is defined to take these factors into account:
In this equation for calculating the effective gravity, the pressure drop at flooding is used.This is set to (ΔP/Z)flood=1025 Pa·m-1by Rocha et al.[17]In the equation,the pressure drop over the column (ΔP/Z) is also present.This is the value that is needed to be determined from the pressure drop calculation and iteration is therefore necessary to calculate the pressure drop.The pressure drop over the dry column (ΔPd/Z) will be the initial guess for (ΔP/Z) to be used when calculating the effective gravity at first.The iteration makes the use of this correlation more complicated than both Ergun’s equation, the improved version of Ergun’s equation, and Billet and Schultes’ correlation with simplifications as here presented.
3.Pilot Experiment and Results
To examine the correlations introduced in the previous sections,an experiment to measure pressure drop was performed using a 10 m packed column.The column is constructed of Pyrex glass with an inner diameter of 0.10 m.The column consists of 10 sections with the opportunity to supply water every other meter in the heights of 2, 4, 6, 8, and 10 m.The liquid is redistributed in the column every other meter in the heights of 1, 3, 5, 7, and 9 m where the liquid at the column wall is led to the center of the column.
Every section of the column is packed with the structured packing Sulzer Mellapak 250Y.The elements of packing have a diameter of 0.084 m,a height of 0.205 m,and a surface area of 250 m2·m-3.The void fraction of the packing material is 0.970.In every column section of 1 m, there are four elements of packing which combine to a total height of 0.82 m of packing for every single meter of the column.The effective height of packing for the entire column is therefore 8.2 m.The packed volume is 0.045 m3and the entire column has a volume of 0.081 m3meaning that the packing takes up about 56% of the total volume of the column.
Compressed air is used for the pressure drop experiments.The total gas flow is measured by a Coriolis flow meter.The air can be recirculated in the column or let out through a chimney.A loose metal lid at the top of the column will prevent overpressure in the column.
The construction of the column is outlined in the P&I diagram in Fig.1.The column is run in counter-current flow.The liquid is supplied from the top of the column while the air is supplied from the bottom.
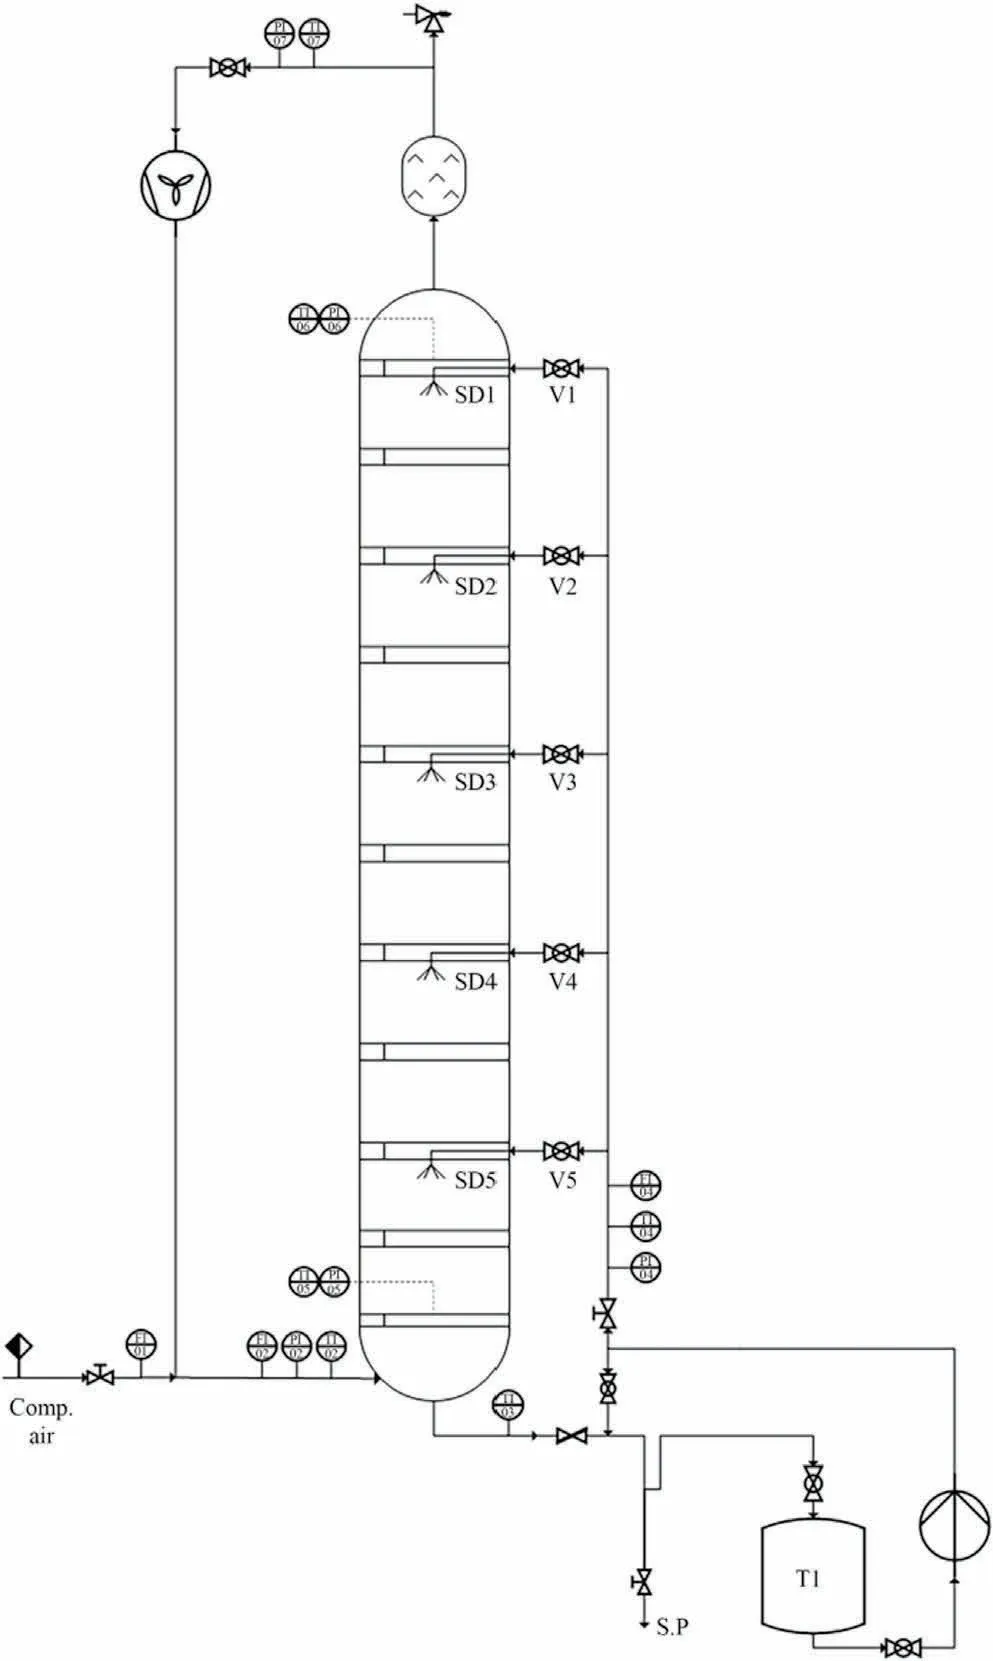
Fig.1.P&I diagram of the packed column.Relevant pressure probes are located at the top (PI6) and at the bottom(PI5) of the column.The liquid flow is measured at FI04 and the gas flow at FI02.
The flow of the gas as well as the liquid stream is measured with flowmeters.The gauge pressure in the column is measured at the top and at the bottom of the column with Testo-probes,from which the pressure drop is calculated.
The pilot column and the packing material is shown in Fig.2.

Fig.2.Section of pilot column with the structured packing Mellapak 250Y: (a) 2 meter section close to the bottom of the column,(b)20 cm section zoomed in on the mid-section of picture (a).
The experiment [31] was conducted with water as the liquid and atmospheric air as the gas for approximate liquid flows of 0,100, 150, 200, 300, 400, and 500 kg·h-1.At every liquid flow, the gas flow was varied from 10 up to 70 kg·h-1with an interval of 10 kg·h-1.The experimental results are presented in Tables 1 and 2.The gas is recycled and saturated with water in the column.The gas temperature was (22 ± 1) °C, and the liquid temperature was (20 ± 1) °C.
The liquid flow,the gas flow,and the pressures were measured every five seconds.The column was run with a constant liquid flow and then the gas flow was varied.When the gas flow was varied,the column was allowed to reach steady state.The measured pressure at the top and bottom as well as the exact liquid and gas flows were noted just before the gas flow was adjusted to a higher flow.The measured pressures and flows could have been taken as an average value over a period of time e.g.30 s but in this case, one time was chosen at which the values were noted.
At the beginning of every experiment without either gas or liquid flow in the column, a small pressure was measured at the top and the bottom of the column as seen in Table 1.This initial pressure was subtracted from the measurements from the running column.Measurements at liquid flow 0, 100, 150, and 200 kg·h-1were made in one campaign.Measurements at 300 kg·h-1were made in another campaign, while the measurements at 400 and 500 kg·h-1were made in the last campaign.The pressures Ptopand Pbottomin Table 1 were measured before liquid and gas flow was applied in each campaign.
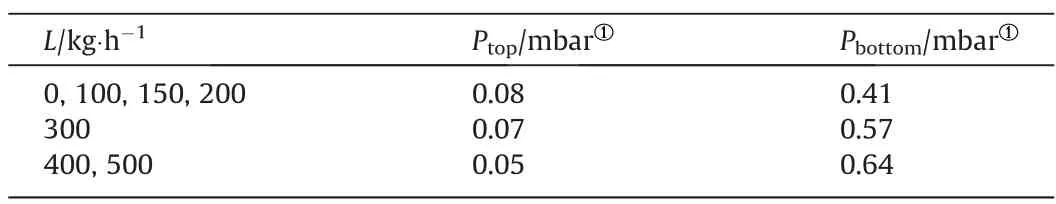
Table 1 Initial pressures measured before start, i.e.without either gas or liquid flowing through the column
The experimental pressure at the top and bottom of the column were measured and the initial pressure drops from Table 1 were subtracted from the measurements.The pressures and pressure drops are shown in Table 2 for varying gas flows at constant liquid flow.
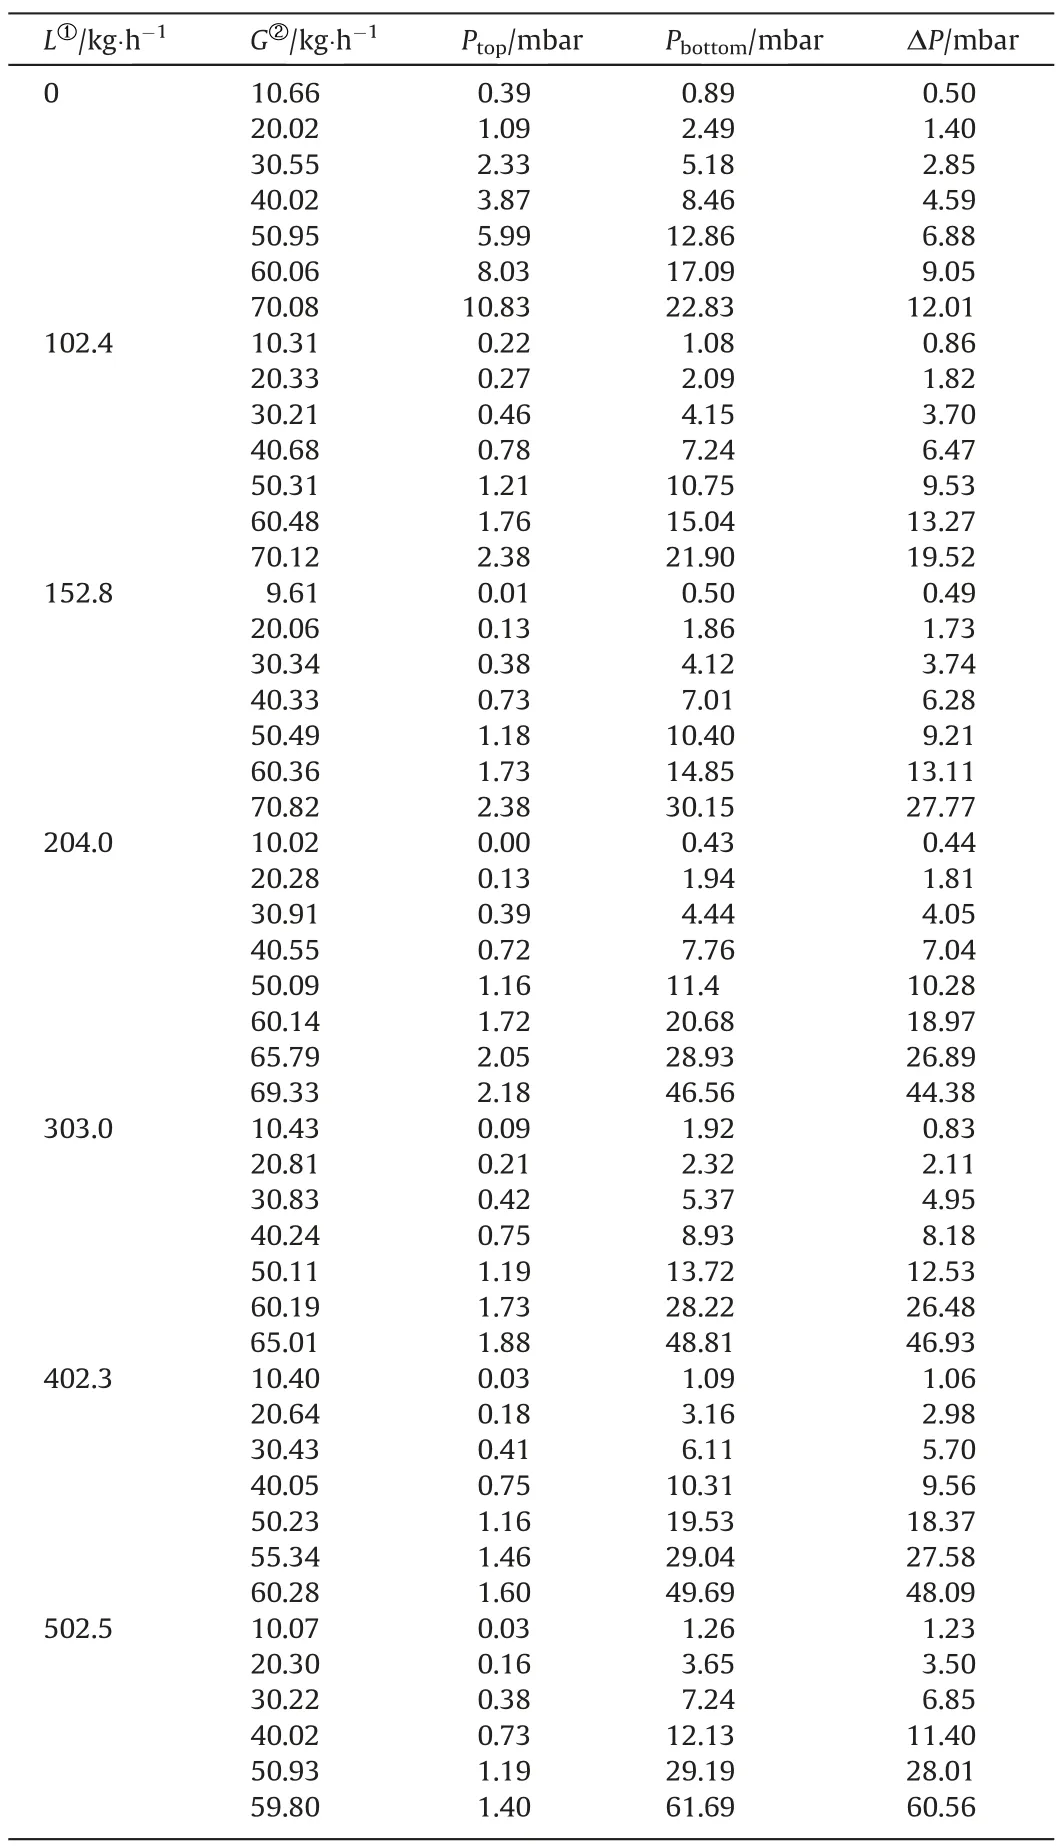
Table 2 Experimental pressure drop ΔP calculated from the measured pressure at top and bottom of the column as a function of constant liquid flow L and varying gas flow G[19]
4.Results and Model Comparison
Based on the experimental data, the theoretical values for the pressure drops at the measured liquid and gas flows are calculated.The impact on pressure-loss from variation in gas and liquid phase properties is minor and results in less than 10% variation in the pressure loss, when comparing ‘‘heavy” gases, 1.2 kg·m-3with‘‘lighter” gases, 0.9 kg·m-3.The pressure drop is calculated with Ergun’s equation, Eqs.(1) and (5), the Stichlmair equation, Eqs.(6) and (5), Billet and Schultes’ equation, Eqs.(10) and (15), and with Rocha, Bravo, and Fair’s equation, Eqs.(20) and (24).The results are shown in Figs.3 and 4.
For the dry column, the measured pressure drops over the entire column (8.2 m of packing) at varying gas flows are seen in Fig.3 where the pressure drops are compared to the four different correlations.The theoretical models are depicted as dashed lines while the experimental data from this study is marked with dots at varying gas flow.Except for the correlation by Rocha et al., all the correlations are showing linear behavior when plotted in the logarithmic graph.
Fig.3.Pressure drop ΔP of packing height as a function of the gas flow G for the non-wetted column (L = 0 kg·h-1).
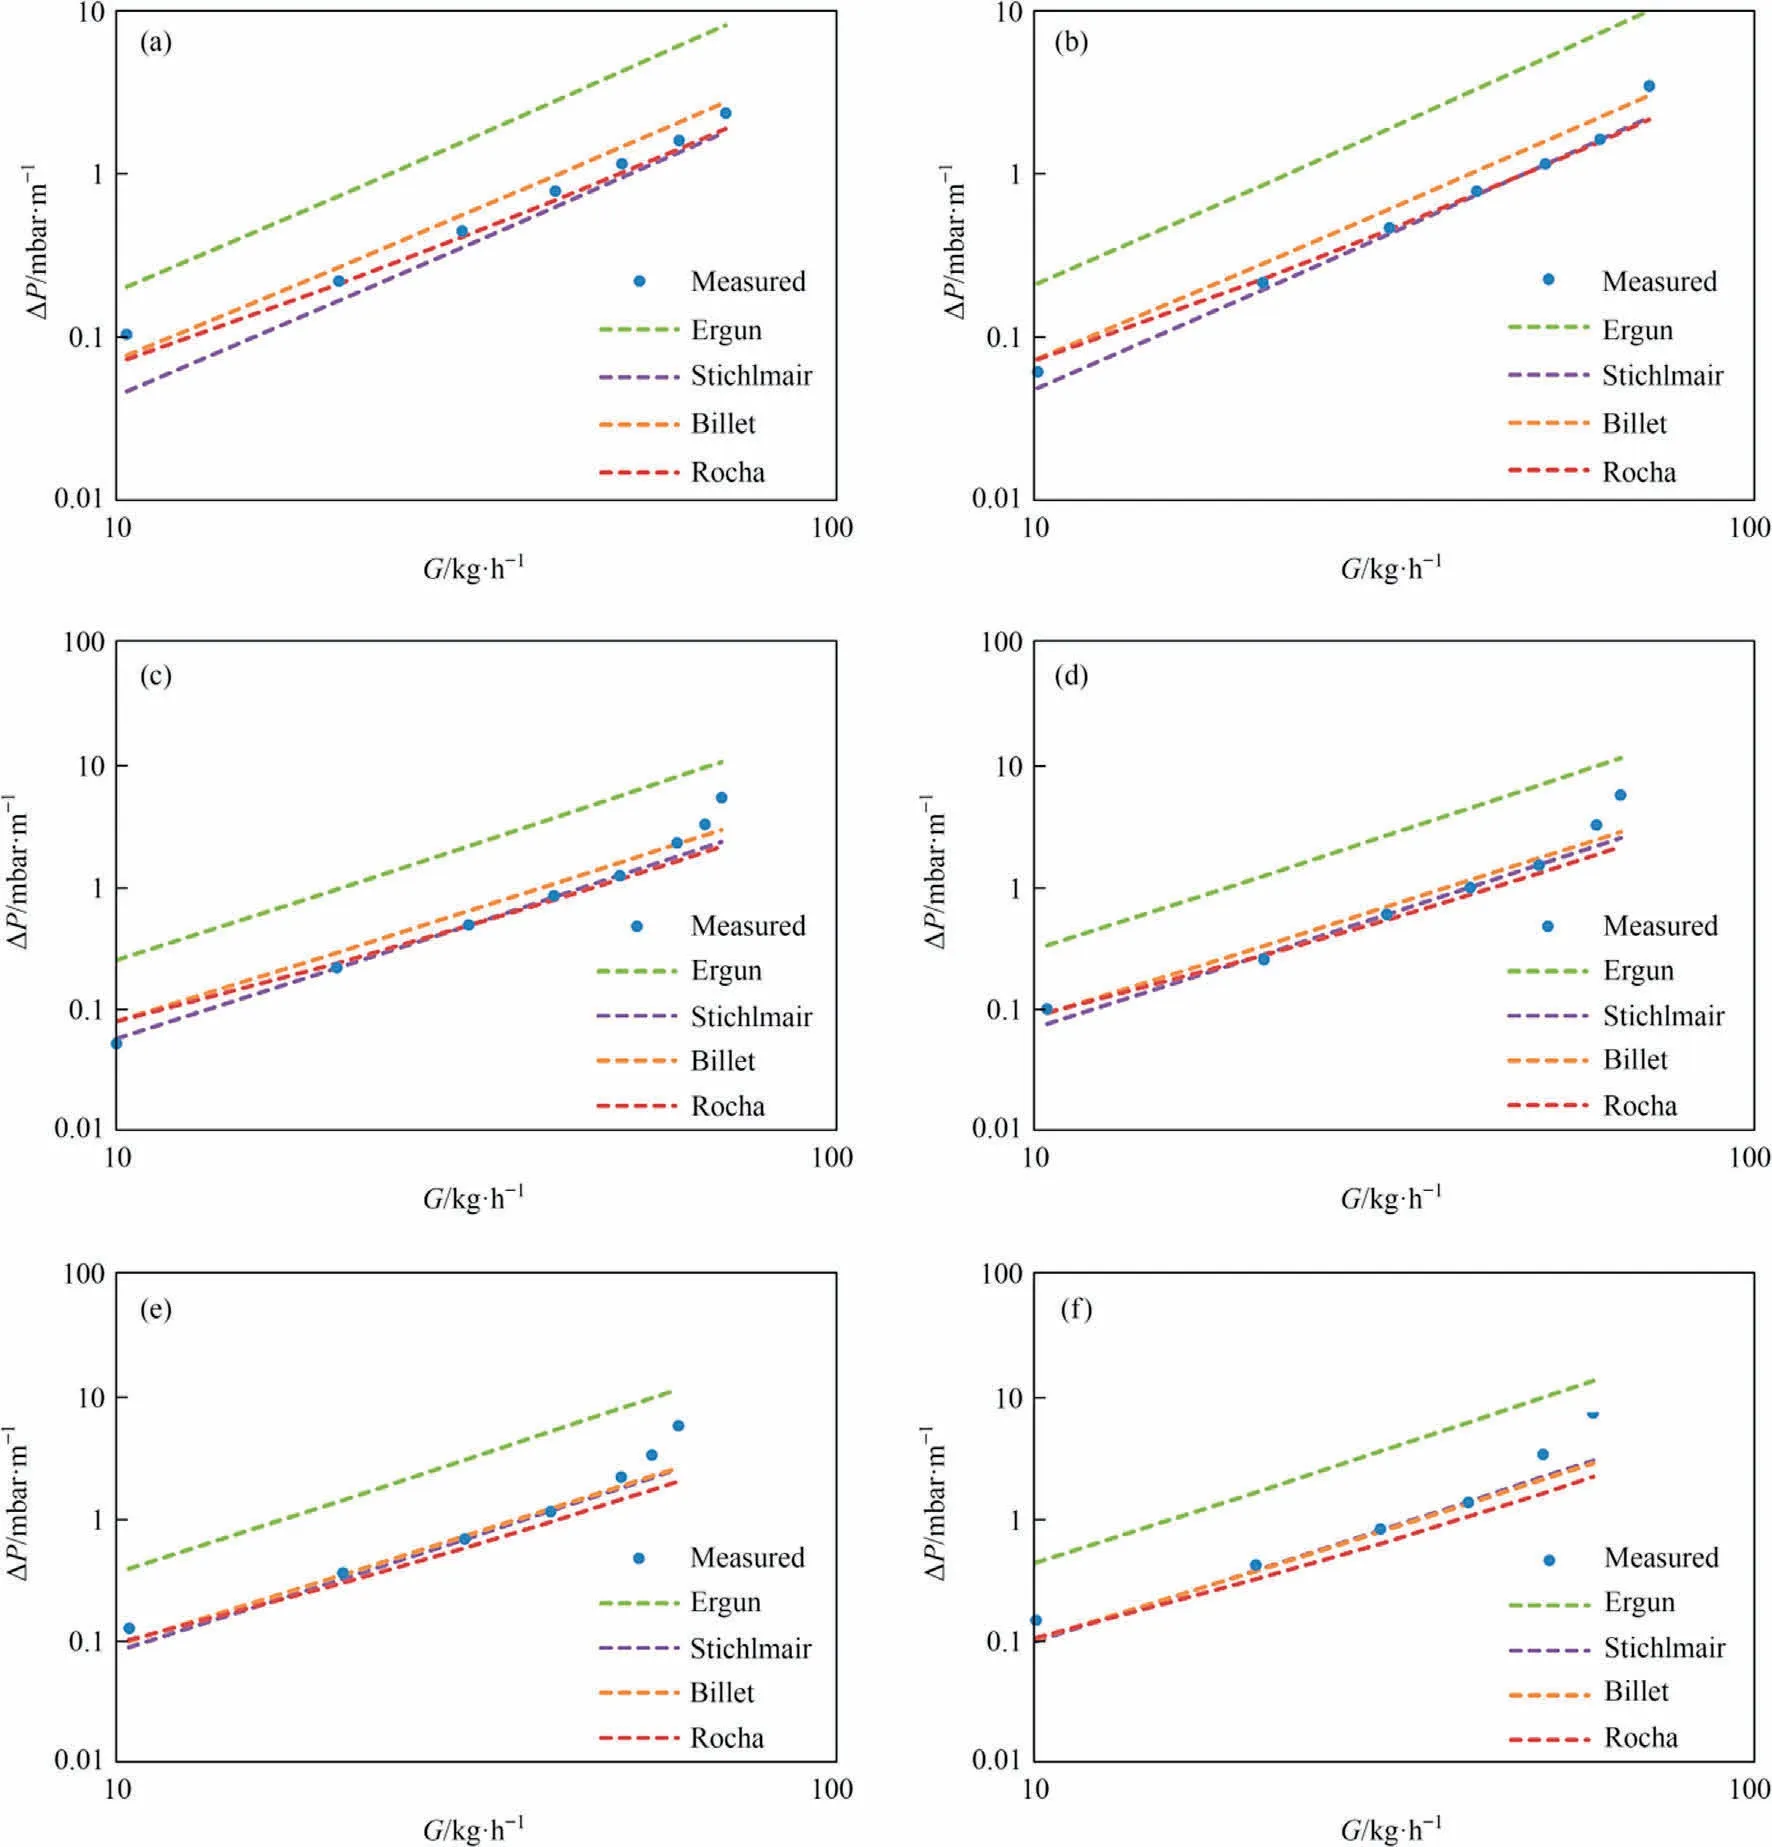
Fig.4.Pressure drop ΔP of packing height as a function of the gas flow G at constant liquid flow:(a)L=100 kg·h-1,(b)L=150 kg·h-1,(c)L=200 kg·h-1,(d)L=300 kg·h-1,(e)L = 400 kg·h-1, (f) L = 500 kg·h-1.
As seen in Fig.3,Rocha,Bravo and Fair’s correlation,Eq.(20),is best describing the pressure drop over a non-wetted column.The equation of Ergun, Eq.(1), gives the highest pressure drops while Stichlmair’s equation, Eq.(6), gives the lowest pressure drops.It is expected that the measured data with no liquid flow show linear behavior as predicted by the correlations except from the correlation by Rocha et al.[17] However, the experimental data closely follow the model of Rocha et al.showing non-linear behavior.Besides the packing material in the column, nozzles for supplying liquid and redistributors are also present for every meter, where the column sections are assembled.Both the nozzles, redistributors,and joints of sections will contribute to a higher pressure drop than what is expected from an ideal column which would be undisturbed besides the packing material.Also, there will be a minor contribution to the pressure drop from the passage of the gas through the empty column section.The pressure drops are measured for the entire column of 10 m but the packing material only takes up 8.2 m of the column and the calculated pressure drops are therefore for 8.2 m only.The contribution to the pressure drop from the passage of the gas through the empty parts of the column must however be negligible since the largest pressure drop is expected to come from the packing material, at least for a dry column.
When looking at the pressure drops for the irrigated column,the equation of Ergun, Eqs.(1) and (5), is generally showing too large pressure drops while the Stichlmair equation, Eqs.(6) and(5), is generally giving the best estimates.The pressure drop for the irrigated column at different liquid flows is shown in Fig.3.At a liquid flow of 100 kg·h-1, Rocha, Bravo, and Fair’s correlation,Eqs.(20) and (24), is still proving best.The small deviation between model and data for low flow rates, is due to statistical error in the measurements and inaccuracy of the model.At a liquid flow of 150 kg·h-1the Stichlmair equation starts to be describing the measured pressure drops very well.At 200 kg·h-1and 300 kg·h-1, this equation is best describing the experimental values.At 400 and 500 kg·h-1also Billet and Schultes’ correlation,Eqs.(10) and (15), starts to describe the experimental results very well, but the Stichlmair equation still does so.Except for the equation by Rocha et al.the equations are not valid above the loading point.As the experimental values start to deviate from linearity at high gas flows, indicating the loading point, the equations cannot reproduce the experimental data.
The lowest deviation between experimental data and predicted values was found for the non-wetted column at the highest possible gas flow rate of 70 kg·h-1.Here, the equation by Rocha et al.showed a pressure drop of 0.01% above the measured pressure drop.In general,the deviation from Rocha’s equation was between-5.5% and +0.01% for the non-wetted column.The equation with the highest deviation in all experiments was the Ergun equation.For the non-wetted column, the pressure drop predicted by this equation was between 83% and 191% higher than the measured pressure drop.The worst prediction was for the irrigated column with a liquid flow of 400 kg·h-1where the Ergun equation predicted pressure drops 99%to 348%higher than measured,the highest deviation being below the loading point.
Comparing the equations by Stichlmair et al.and Rocha et al.for the irrigated columns, the highest deviation was found at a liquid flow of 500 kg·h-1and a gas flow of 60 kg·h-1with the equation by Rocha et al.predicting a pressure drop 69.6% lower than measured.This is surprising since this equation is the only one in the form presented in this work that is valid above the loading point and should be able to predict the flooding point.The lowest deviation was found at a liquid flow of 300 kg·h-1and a gas flow of 50 kg·h-1for the equation by Stichlmair et al.predicting a pressure drop only 0.12% higher than measured.In general, for liquid flows above 150 kg·h-1and for gas flow rates above 20 kg·h-1but below the loading point, the deviation with the Stichlmair equation was found to deviate between ± 10%, most deviations being ± 1%.
As an overall impression, the Stichlmair equation is the best correlation to describe the pressure drop for an irrigated packed column.This is supported by the parity plot in Fig.5 where the modeled pressure drop by Stichlmair’s equation, Billet and Schultes’ equation as well as the equation by Rocha et al.is plotted against the experimentally measured pressure drop.The original equation of Ergun is omitted since this equation not reproduces the experimental values.Values are only plotted for the irrigated column pressure drops and only below the loading point since the equations in general do not describe pressure drops above the loading point.The line of equality is also visualized in the figure which makes it evident that Stichlamair’s equation is best describing the measured pressure drop since the points of Stichlmair’s equation lie most closely to the line.
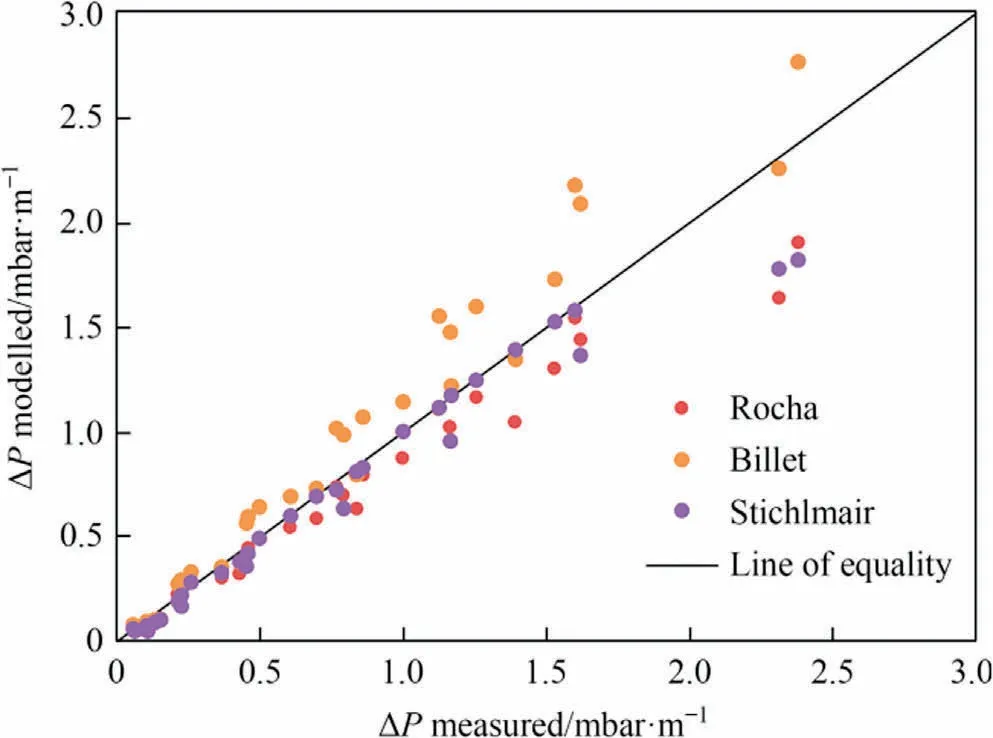
Fig.5.Parity plot comparing the equation of Stichlmair et al.and Rocha et al.Pressure drops are only the irrigated column and for pressure drops below the loading point since the equations in general cannot describe the pressure drop above the loading point.
At all gas flows,the equations are linear except for Rocha,Bravo and Fair’s equation.This is due to the correlation for calculating the dry pressure drop, which is composed of a sum of two terms.In both terms, the gas velocity is present, and this might account for the deviation from linearity.However, since the experimental data in theory should be linear at low gas flows this composition of the equation seems to be without purpose.Nevertheless, the experimental data does not seem linear at the lowest gas velocities,and it does appear that the correlation by Rocha et al.tries to account for this.This is especially clear at L = 100 kg·h-1and L =300 kg·h-1.
The improvement of Ergun’s equation, the Stichlmair equation,turns out to be very valuable.Ergun’s original equation does not take packing-specific constants into account, except from the porosity of the packing material.For the improved version, three packing-specific constants are part of the friction factor and this,together with the advanced exponent term of the friction factor,turns out to be of extreme importance.This simple change is transforming the equation from being the worst to describing the experimental values to being the best correlation.
Billet and Schultes’ correlation together with Rocha,Bravo, and Fair’s correlation are much more complicated to use than the Stichlmair equation.This is both due to more equations, which need to be solved and due to iteration,which is making the calculation more difficult.In the presented version of Billet and Schultes’correlation in this work, iteration is not necessary since it is decided only to look at pressure drops below the loading point.For Rocha, Bravo and Fair’s correlation, iteration is however a requirement for estimating the pressure drops even below the loading point because of the introduction of effective gravity.
One of the major differences between Stichlmair’s equation and Billet and Schultes’ correlation is that Billet and Schultes take the increased void fraction at the column wall into account by introducing the wall-factor K.However, this factor seems not to improve the correlation on most of the liquid flows.For all liquid flows from 100 to 300 kg·h-1,where Billet and Schultes’correlation is showing too high pressure drops, the correlation proves better by setting the wall-factor K to 1 as seen in Fig.6 for pressure drop at a constant liquid flow rate.By omitting the wall-factor, the equation does better describe the measured pressure drops.
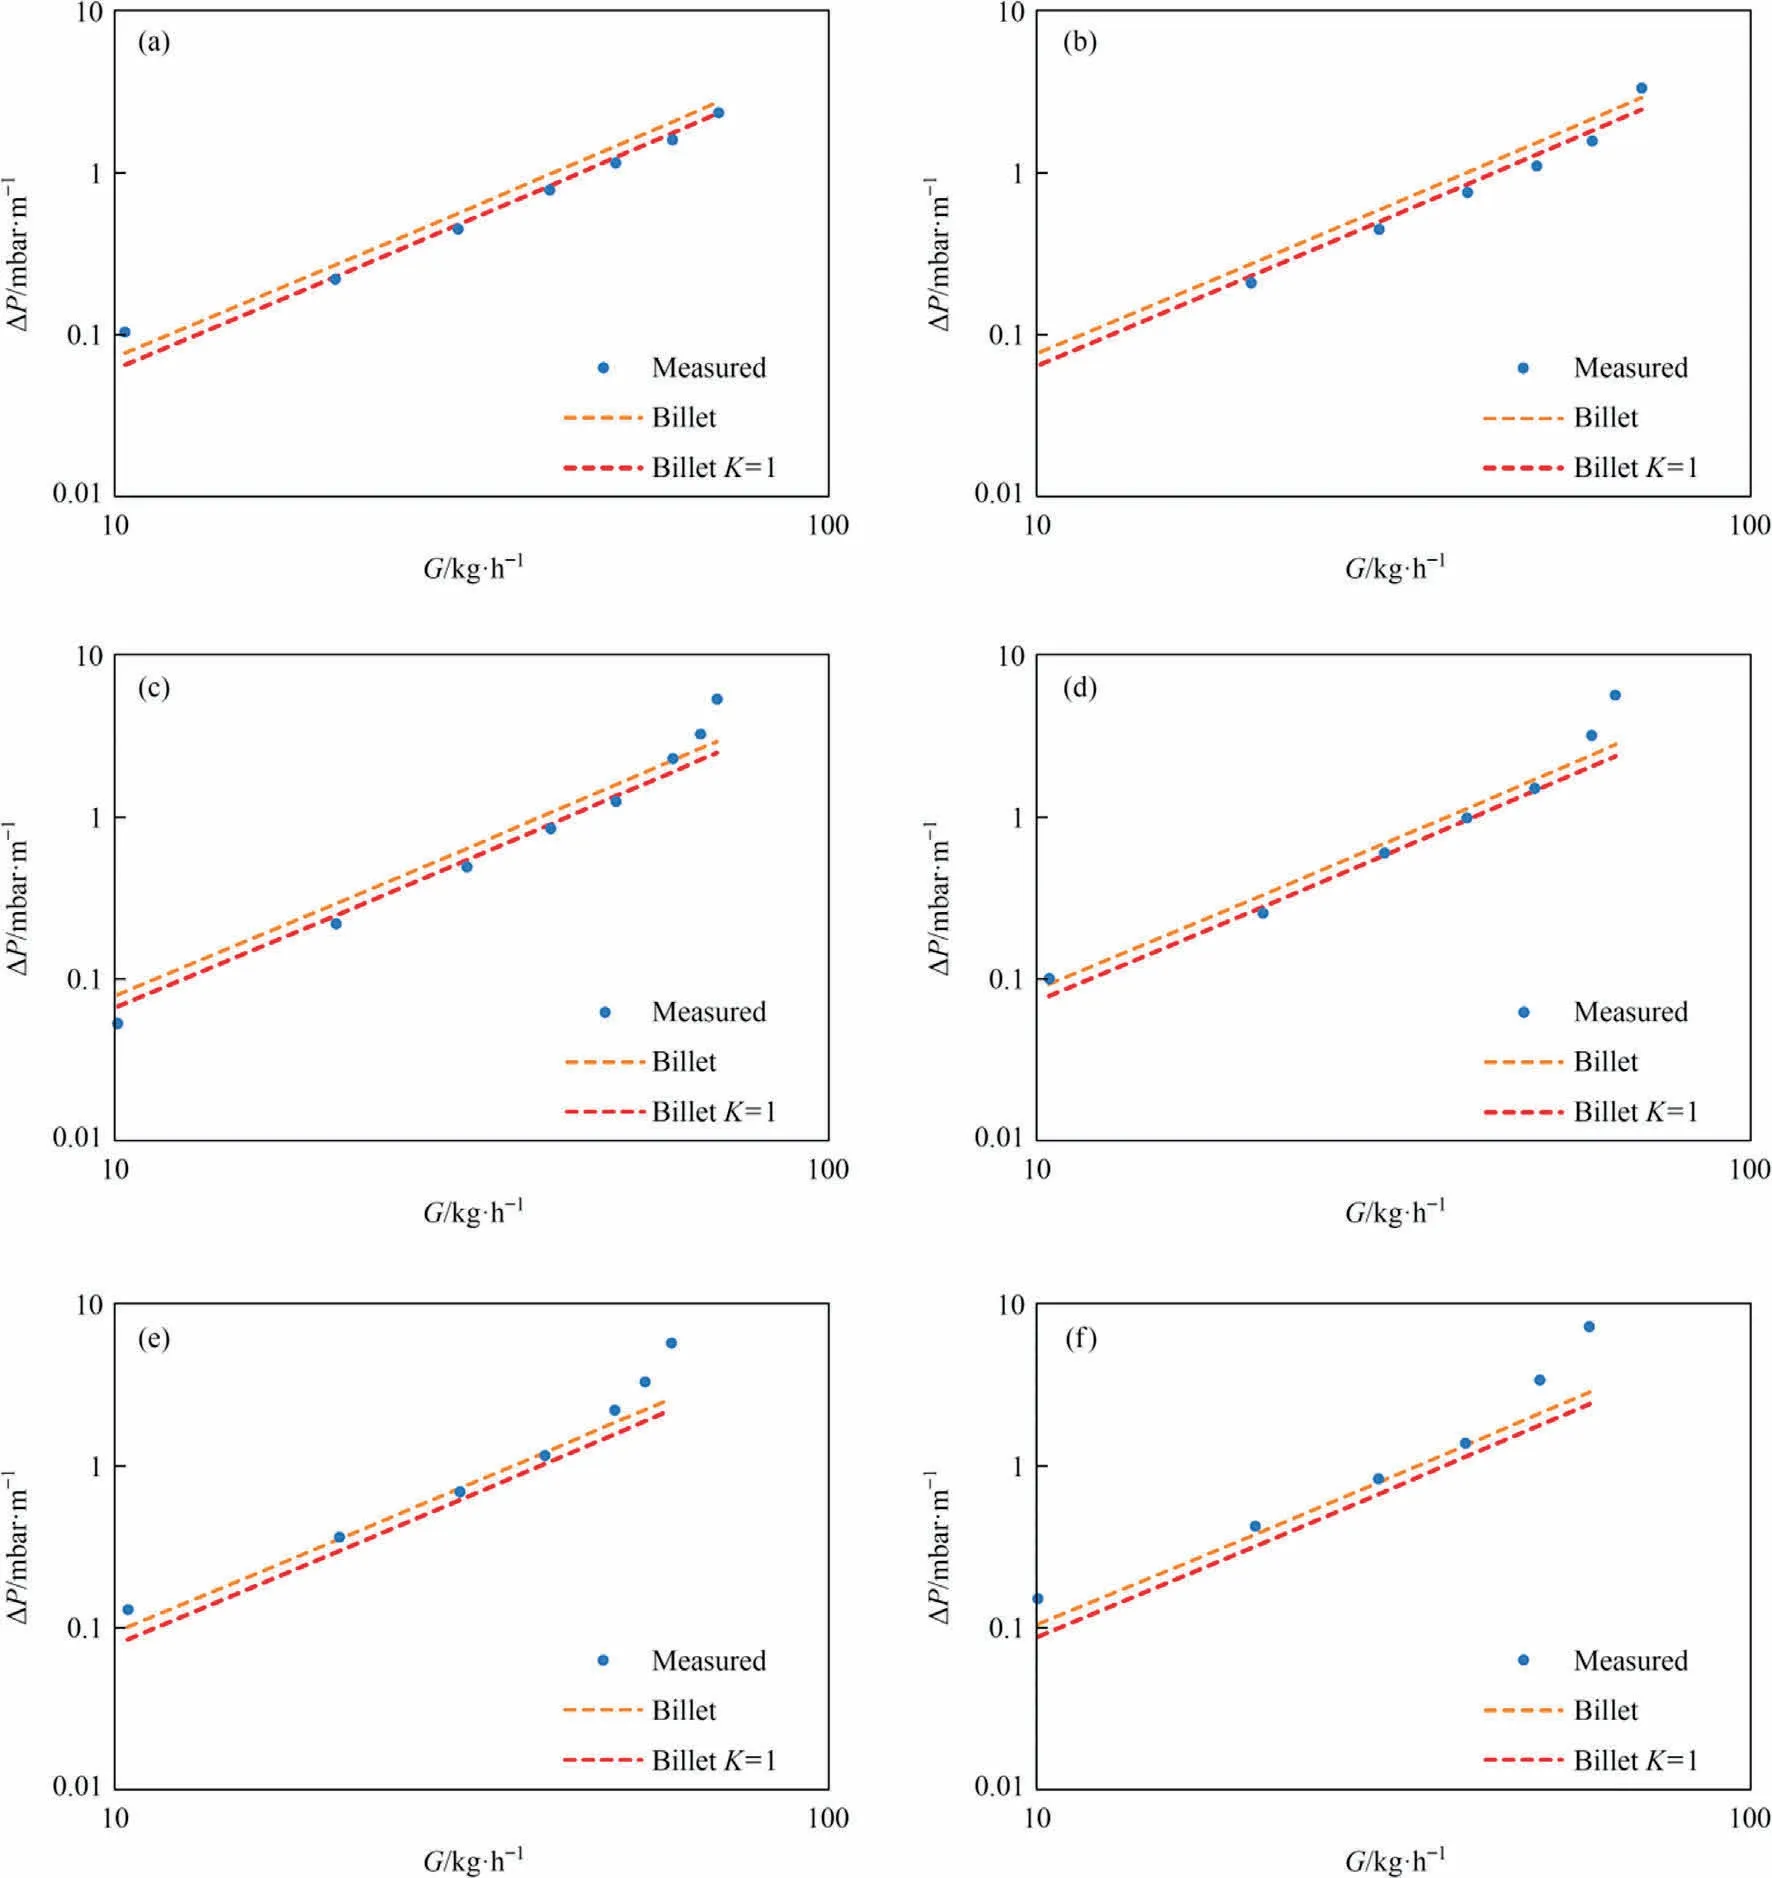
Fig.6.Pressure drop ΔP as a function of the gas flow G at constant liquid flow for Billet and Schultes’correlation(orange)and Billet and Schultes’correlation with the wallfactor at K = 1 (red): (a) L = 100 kg·h-1, (b) L = 150 kg·h-1, (c) L = 200 kg·h-1, (d) L = 300 kg·h-1, (e) L = 400 kg·h-1, (f) L = 500 kg·h-1.
The correlation by Billet and Schultes may give a better physical description of the hydrodynamics in the column by introducing the wall-factor K but it does not prove better in describing the experimental pressure loss observed at low liquid flows.Instead, the introduction of the wall-factor K gives too high pressure drops compared to the experimental data.Only at higher liquid flows,when the pressure loss in general is increasing, the introduced wall-factor is of interest and considers the larger pressure loss.However, it should be validated if the wall-factor at even higher liquid flows reproduce the experimental data accurately or if the experimental pressure loss will start to become even higher than what the correlation predicts.
At high gas flows it is seen that the experimental data starts diverging from the straight line.This is due to the gas preventing the liquid from flowing freely downwards.The point where the straight line is deflected is called the loading point.From this point,the pressure drop is increasing rapidly up to the flooding point where the liquid is held back in the column and the column starts to flood.This cannot be seen from the diagrams since fully flooding of the column did not occur during the experiment,though partial flooding was observed.The correlations of both Billet and Schultes as well as Rocha et al.should be able to describe the pressure drop up to the flooding point.For Billet and Schultes’ correlation, this was not tested but for Rocha, Bravo and Fair’s correlation, the result is seen in Fig.7 at a liquid flow of 400 kg·h-1.
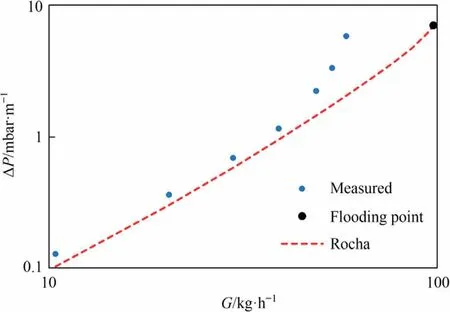
Fig.7.Pressure drop ΔP as a function of the gas flow G at a constant liquid flow,L = 400 kg·h-1.
The correlation by Rocha et al.is deflected at much higher gas flows than what was experimentally observed,and the correlation cannot predict the pressure drop precisely above the loading point.The loading region is not as clear from the equation as from the experimental data since the deflection predicted by the equation is less prominent.Some of the deviations can be due to the column not being ideal(it is disturbed by nozzles,redistributors and joints of sections) which will give higher pressure drops than expected.This can however not be the only reason since it is thought not to be of that high importance that it will shift the loading and flooding point to the very high gas flows which are seen in Fig.7.According to the equation by Rocha et al.the flooding point should be at a gas flow of 102 kg·h-1and a pressure drop of 7.1 mbar·m-1.The highest observed pressure drop was 5.9 mbar·h-1at a gas flow of 60 kg·h-1.While the determined pressure drop might be close to the one at which flooding will occur in practice,it is more doubtful that the gas flow will.
It is crucial to be able to determine the flooding point to determine the operating conditions of a packed column but as seen from Figs.4 and 7 this is not even possible with the advanced model of Rocha,Bravo,and Fair for the simple system of water and air.Since this correlation cannot predict the pressure drop acceptably, the Stichlmair equation is still the preferred equation for determining pressure drops even though it is not valid above the loading point.As seen from Fig.3, at higher liquid flows the loading point and hence flooding point will occur at lower gas flows.Since flooding did not occur during the experiment, the flooding point cannot be seen from the figure,but at the highest liquid and gas flows,partially flooding did occur and hence the last measured data points for L=400 kg·h-1and L=500 kg·h-1must be close to the flooding point which is hence the limiting conditions of the packing material used.However, the loading point can be predicted from the experiment as the point where the linearity stops.The gas flow at this point will be in the vicinity of the operating condition for the given liquid flow for this packing material.Hence,it is the pressure drop at these conditions that the blower needs to overcome when sizing the equipment of the column.Still, there is no reason for choosing more advanced correlations for predicting pressure drops when they cannot satisfyingly determine the flooding point and other means must be used instead, e.g.GDPC diagrams.
Ergun’s equation and the Stichlmair equation do only take the physical parameters for the gas into account.These are the density and the viscosity of the gas.The other parameters are for the packing material and there are no constants for the liquid.On the other hand,Billet and Schultes as well as Rocha et al.do take the density and viscosity of the liquid into account.For this system with air and water, it does not seem problematic to the Ergun and Stichlmair equations that they do not consider the properties of the liquid.However, for other liquids than water, e.g., viscous liquids, it might turn out to be a hindrance for estimating the pressure drop to an acceptable extent.
Table 3 provides the density and viscosity of combusted air for different CO2concentrations, as well as biogas at 25 °C.It is assumed that combusted air consists of 5% H2O and 6% O2.

Table 3 Density and viscosity of different mixtures of combusted air with varying amount of CO2 and biogas at 25 °C [32]
Fig.8 compares the pressure drop of the various gas mixtures listed in Table 3.The pressure drop in these widely recognized gas types appears to be relatively independent of the variations in gas density and viscosity.
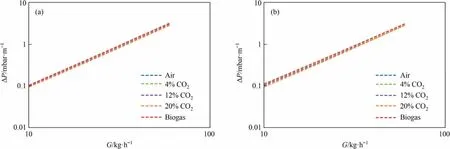
Fig.8.Comparison of the pressure drop in different gas mixtures for (a) the Stichlmair equation and (b) Billet and Schultes’ equation.
The Stichlmair equation does not consider the density and the viscosity of the liquid.Hence, it is difficult to compare its performance on other systems.However, the equation of Billet and Schultes’does not appear to be much affected by the liquid density and viscosity.This is modelled for an amine solution, which is a widely used as solvent in absorption columns for CO2capture.
The viscosity of an amine solution varies noticeably with the mole fraction of the amine and with temperature, whereas the density is somewhat constant and comparable to the one of pure water [33].This is illustrated in Table 4, where the densities and viscosities of an aqueous solution of 15% (mass) monoethanolamine (MEA) and 5% (mass) methyl diethanolamine (MDEA) at different temperatures are given [33].The pressure drop calculated with the Billet and Schultes’ equation at G = 40 kg·h-1and L = 50 0 kg·h-1are also given.The gas flow is the last experimental point before the curve starts to deflect as shown in Fig.4(f).

Table 4 The density and the viscosity at different temperatures of an aqueous amine solution of 15%(mass)MEA and 5%(mass)MDEA.The pressure drop is calculated with the equation of Billet and Schultes at G = 40 kg·h-1 and L = 500 kg·h-1
In the air/water system, the measured pressure drop was 1.39 mbar, while the calculated pressure drop using the Billet and Schultes’ equation at G = 40 kg·h-1and L = 500 kg·h-1was 1.35 mbar.These values closely align with the results obtained in Table 4.
Considering that the modeled pressure drop is not significantly influenced by the density and viscosity of both the gas and liquid,the data acquired from the air/water system in this study maintain their pertinence for amine capture absorption towers.
It can be an advantage when dimensioning a packed column to choose a correlation for predicting pressure drops that show higher rather than lower pressure drops.In this way, it is avoided to undersize the blower to make the gas pass through the column.On the other, it is not profitable to oversize the blower too much since it will increase the equipment cost.Big plants can handle huge amounts of gas and the capacity of the blower is therefore of importance since it determines whether the gas can be pumped through the column or not.If the pressure drop is too high,the normal flow in the column will be disturbed and the cost for pumping the gas through the column will increase since the blower will need a lot of energy for the pump work.
5.Conclusions
Four different correlations for estimating pressure drops in packed columns have been compared against experimental data from a column packed with the structured packing Sulzer Mellapak 250Y.For most of the liquid flows,the Stichlmair equation showed to be the best correlation to predict the experimental values.This shows that the more advanced correlations as Billet and Schultes’correlation as well as Rocha,Bravo and Fair’s correlation are expectantly not more accurate than a rather simple correlation as the Stichlmair equation.A lot of calculation can be spared by choosing a simple correlation and especially when the simple correlation gives the best result.However, the tested system is using water and air as liquid and gas,for which system the Stichlmair equation proves best.The more advanced models may be more physically correct than the simple ones,especially when using viscous liquids,but with the system of water and air, they do not reproduce the experimental data more accurately.This is of great value when modeling and dimensioning e.g.an absorption or stripping column.
Contributions
The manuscript was written through contributions of all authors.All authors have given approval to the final version of the manuscript.
Acknowledgements
The funding from the BioCO2 project (the Danish government through the EUDP agency No.64016-0082), the INTERACT project(European Union Seventh Framework Programme FP7/2007-2013 under grant agreement No.608535)and the financial support from the Center for Energy Resources Engineering(CERE),and the Technical University of Denmark.
Declaration of Competing Interest
The authors declare that they have no known competing financial interests or personal relationships that could have appeared to influence the work reported in this paper.
杂志排行

Chinese Journal of Chemical Engineering的其它文章
- Intrinsic kinetics of catalytic hydrogenation of 2-nitro-4-acetylamino anisole to 2-amino-4-acetylamino anisole over Raney nickel catalyst
- Experiments and model development of p-nitrochlorobenzene and naphthalene purification in a continuous tower melting crystallizer
- α-Synuclein: A fusion chaperone significantly boosting the enzymatic performance of PET hydrolase
- Influence of water vapor on the separation of volatile organic compound/nitrogen mixture by polydimethylsiloxane membrane
- Mass transfer mechanism and relationship of gas-liquid annular flow in a microfluidic cross-junction device
- Enhanced photocatalytic activity of methylene blue using heterojunction Ag@TiO2 nanocomposite: Mechanistic and optimization study