Enhanced photocatalytic activity of methylene blue using heterojunction Ag@TiO2 nanocomposite: Mechanistic and optimization study
2023-02-28SaptarshiGhoshKamaleshSenPriyankaDebnathArghadipMondalNabaKumarMondal
Saptarshi Ghosh, Kamalesh Sen, Priyanka Debnath, Arghadip Mondal, Naba Kumar Mondal,
1 Aerosol and Nanoparticle Technology Laboratory, Environmental Science and Engineering Department.Indian Institute of Technology Bombay, Mumbai 400076, India
2 Environmental Chemistry Laboratory, Department of Environmental Science, The University of Burdwan, W.B 713104, India
Keywords:Heterojunction Ag@TiO2 nanocomposite Methylene blue dye Langmuir-Hinshelwood model Scavenger Density functional theoty
ABSTRACT The objective in this study is to investigate the adsorption-degradation of the methylene blue (MB) dye using a fabricated heterojunction Ag@TiO2 nanocomposite.The batch factors used in photo catalytic reactions were pH, UV-irradiation time, temperature, catalytic dosage, and concentration of MB.The results showed that 0.2 × 10³ g·ml-1) of the catalytic dose caused the Ag@TiO2 adsorption to degrade by 96.67%with darks and UV exposure.Using the Langmuir-Hinshelwood model to determine the kinetic, the Ag@TiO2 displays a greater kinetic rate than TiO2 and silver nanoparticle (AgNPs).The photocatalytic degradation of MB, which is an endothermic reaction involving all catalysts, is shown by the thermodynamic parameter to have the positive value of enthalpy (ΔH°).The enthalpies observed were Ag@TiO2(126.80 kJ·mol-1) < AgNPs (354.47 kJ·mol-1) < TiO2 (430.04 kJ·mol-1).Ascorbic acid (·OH scavenger),2-propanol (·O2 scavenger), and ammonium oxalate (AO) (hole h+ scavenger) were employed to conduct the scavenger effects.The Ag@TiO2 demonstrated a reduction in MB degradation when combined with 2-propanol, and this clearly demonstrated that, in contrast to hydroxyl radicals (·OH) and hole (h+) scavengers, superoxide radical anion (·O2 scavenger) plays a significant role in MB degradation.Utilizing density functional theory (DFT) to elucidate the mechanism and B3LYP/6-311+G(d,p) level optimization, the degradation-adsorption process was explained.When the N-N, C-N or C-C bonds were severed, the Fukui faction was demonstrated for nucleophilic, electrophilic, and radical attack.
1.Introduction
Global energy consumption concerns will increase by up to 50%between 2013 and 2040, due to growth in the industrial sector,commercial areas, and residential purposes [1].Environmental contamination is rising along with industry and population growth,and water pollution in particular has gotten a lot of attention.Between 2013 and 2040, it is anticipated that the rise of the industrial, commercial, and residential sectors would result in an up to 50% increase in global energy consumption [1].According to pollution being increase as diversity of contaminated from industrial sector, and its tackle very difficult.Over the decades,the application of artificial dyes on paper, pulp cloth, textile,leather treatment,print industries,which has reached 700000 tons per year[2].Additionally,dye companies released too much pollution into the environment as a result of manufacturing or production residues that have a harmful impact on the ecosystem.Toxicity interferes with photosynthesis and respiration as it moves through the biological cycle, endangering the health of humans as well as plants and other agricultural products[3-5].Consequently,dye treatment is essential to sequester pollutants in a sustainable manner.
This research study on MB has taken to investigate of adsorption and degradation using semiconducting materials.In this context, newly offered as solar fuel that address to resisting the pollutants [6,7].Several water cleaning technology applied previously, such as adsorption, coagulation, membrane filtration,reverse osmosis, ozonation, sedimentation, advanced oxidation processes, and photocatalytic degradation, as usually eco-friendly approaches to mineralization of pollutants by photocatalytic degradation [8-12].Heterogeneous photocatalyst production is currently in demand for applications in industry, water management and pharmaceutical medicine[13].Currently,titanium dioxide (TiO2) is one of the most studied semiconductors for photocatalytic applications, as it is less harmful to the environment, exhibits thermal and chemical/physical stability and photocatalytic properties (photo-excited electron-hole pairs) under UV radiation [14,15].When applied to the dye under UV-visible radiation, it interacts electron-hole pairs through O2adsorbed on the catalyst surface and the electron dopant energy can excited by heat which lead to photocatalytic effect to O2transfer and generated super oxygen free radical (O2-) [16].This generation radical influenced cleavage organic molecules and formed CO2and H2O.But some researchers disagree with TiO2alone,they focus on the band gap that leads to particle size or composites with other transition metals [17-19].
Recently,it has tremendous effect of nanoparticles due to presence of surface plasmon resonance,which is capable of facilitating visible absorption and occurrence of light and rapid electron-hole reunion using exposing crystal facet [8,20].The photon energy stimulates electrons to move from the valence band to the conduct band, which is the main reason for the degradation effect of the dye molecules in the presence of nanoparticles, the energy transit for the band gap increases due to surface interference [21,22].However, research needs to be application higher band gaps and large surface areas that could be encouraged dye degradation.The photodegradation methods hole,hydroxyl and superoxide radicals can have a key role in catalytic involving methylene blue(MB)degradation [23,24].Previously, many researchers applied scavengers to understand the primary mechanisms that were responsible for degradation [22,25], where the most populous scavengers were employed, such as·OH radical (t-butyl alcohol),-O2(benzoquinone, 1,4-benzoquinone), and h+(ammonium oxalate) [25,26].
An insight into the mechanism of dye degradation, where electronic,surface,and Milliken charge transfer of nanocomposites and photocatalytic mechanisms to be described by density functional theory(DFT)studies[27-29].In generally,DFT study on the photocatalytic effect can be applied to know about binding energy complexity, electronic attraction (HOMO and LUMO properties), bond length,cleavage bonds either electrophilic or neutrophilic interaction [28,30,31].Researcher applied mainly DFT calculation using B3LYP/Lanl2DZ at ground state energy level [32,33].
This research focuses on the photocatalytic degradation of MB utilising titanium nanoparticles that have been doped with silver.Three stage procedures were used to create the nanoparticles,and the catalysts were also characterised using FTIR, XRD, XPS,pHzpc, SEM-EDS, and other techniques.Recycling and scavenger studies were used to assess the efficiency of the catalyst and the mechanism of deterioration.Additionally, the DFT that integrates with the mechanism attribute the MB degradation by catalysts under UV irradiation, has been determined.
2.Experimental
2.1.Reagents and instrument
Ingredients titanium (IV) is supplied by suppliers of a proxide(TIP)(97%,Aldrich;CAS 13463-67-7),ethanol(absolute,CAS Number: 64-17-5; ≥99.9% GC; EMSURE®ACS) and Glacier acetic acid(CAS Number: 64-19-7; glacial, Reagent Plus®, ≥99%).For pH,which was maintained by 0.1 mmol·L-1sodium hydroxide(NaOH)and 0.1 meq·L-1hydrochloric acid (HCl), and was purchased from Aldrich(HCl, ACS reagent, 37%; Ph.Eur., K ≤0.02%, ≥98%, pellets).Methylene blue was purchased from Sigma-Aldrich, Merck (CAS No.: 122965-43-9; formula: C16H18ClN3S; molar mass:319.85 g·mol-1; absorbance at 663 nm).All using chemicals were purchased from Sigma-Aldrich,Merck(laboratory grade reagents),and reagents were prepared using deionized aqueous solution.Instrument for surface morphology was performed by scanning electron microscopy (SEM) associate with energy dispersive Xray analysis (EDS) at 20 kV using catalyst compositions (ZIESS 450, Germeny) for elemental detection.The microstructures has been examined with high-resolution transmission electron microscopy (HRTEM, JEM-2100Plus LaB6 TEM) at 200 kV.The performance of nitrogen adsorption for applying a Quantochrome(Nova 2200e) though an automatic N2gas adsorption process,and specific surface area and pore sizers have been estimated by a multi-point BET analysers [34].For FT-IR was analysed by Agilent(Cary 630), powder sample formed with KBr pallets, analysis ranged into 7000-350 cm-1.Zeta potential for surface charge and particle size was analysed by dynamic light scattering (DLS) at (25 ± 0.1)°C, are examined for a 0.2 mg·ml-1suspension of catalysts, mix-ing through ultrasonically in deionized water by NanoZS90 (Mal-vern Panalytical), with a 4 mW He-Ne laser source (λ = 633 nm).The chemical identification has been studied by Raman Spec-troscopy(RAMAN; InVia, Renishaw, UK).The X-ray diffraction pat-tern was measured using Rigaku-D/MAX-Ultima diffractometer using Cu-Kα radiation (λ = 0.15418 nm) operating at 40 kV and 40 mA and a scanning rate 2(°)·min-1.The crystalline surface was estimated by the Bragg intensities equation, and also diffrac-tion patterns were measured through Gaussians relatively full widths at half maximum (FWHM) by varying diffraction angle (2θ).Surface properties and binding energy were calculated by X-ray photoelectron spectroscopy (XPS) (Thermo Scientific K-Alpha).Photoluminescence (PL) spectra were analyzed using a FLS1000 photoluminescence spectrometer (Edinburgh Instruments Ltd.),equipped with a double-grating photomultiplier (UV-NIR) and emission wavelength 160-5500 nm.Using a 450 Watt xenon arc lamp (ozone-free) as the excitation source.By monitoring the absorbance spectra of the solutions at interval of 30 minutes time was investigated.To estimate of absorbance by varying time, the adsorption spectra was selected at 650 nm using UV-vis spectrophotometer (HITACHI, Model U-2800 spectrophotometer) and related blank was performed using distilled water.In order to use photoelectric evaluation, electrodes were often made by using the doctor’s blade technique to cover a 1 cm2patch of fluorine-doped tin oxide (FTO) with uniformly dispersed photocatalysts in ethanol.For electrolyte of 0.1 mol·L-1Na2S at pH 13 has been uti-lised, and Pt connects and Ag/AgCl were employed as the opposing electrode and allusion electrode, respectively.As applying in 20-second interval was used to record the transient photocurrent response at 0 V (vs.Ag/AgCl) bias in both light on and off.The elec-trochemical impedance spectrophotometer (EIS) (IM3590 Chemi-cal Impedance Analyzer, Hioki, at Normal mode: 100 Ω, Low impedance for high accuracy mode: 10 Ω) was measured in the dark (light off)alongside the light by applying 0 V (vs.Ag/AgCl) with an AC intensity of 10 mV and a frequency bandwidth of 0.5 Hz-0.1 MHz.
2.2.Preparation of the catalysts
Biochemical sol-gel fabrication has been employed to synthesize the TiO2precursor.Initially, 0.2 mol·L-1of ingredients titanium (IV) was added dropwise into 250 ml of ethanol under sonication stirring for 20 min.Then 98% of 6 mmol·L-1hydrochloric acid is added for hydrolysis where the pH is adjusted to 2.0(Solution A).
Silver nanoparticle (AgNPs) was synthesised by standard method[35], where extract of Azadirachta indica leaves (5 g pow-der) has been taken into boiling 100 ml double distilled water (95 °C for 10 min).Following that, the extract was then filtered and chilled for a further 4 °C.Deionized water was used to dilute 50 ml of the extract to 100 ml, which was then maintained at 80 °C for 3 h after being combined with 20 (mmol·L-1) of silver nitrate salt solution.It turns reddish brown with the production of silver nanoparticles(Solution B).Then, as AgNPs nanoparticles devel-oped, solution was taken for characterization.
By fabricated the heterojunction Ag@TiO2nanocomposite using drop by drop, the synthesised AgNPs (10 mmol·L-1) were added to Solution A, where the mixing ratio was 2:5.Until 50 ml of AgNPs had been added, this stirring was continued in the sonicator (LABTRON, LUHS-A20, 2000 W ultrasonic probe, 19.5-20.5 kHz) and obtained precipitated.Precipitated material is then placed in a Teflon-lined high-pressure kettle made of non-corrosive steel,where it reacts at 130 °C for 4 h before being quenched at normal temperature.After thorough cleaning with deionized water and ethyl alcohol, it was placed in a lyophilizer for an overnight period,then samples of heterojunction Ag@TiO2nanocomposites were collected in PVC containers for characterization and application.
2.3.Photocatalytic experiments
The photocatalytic investigation involved adsorption, degradation, and removal while exposed to UV-A light.This experiment was conducted in a thermostatic batch photo reactor using fluorescent lamps with a 5 × 8 W backlight that released 352 nm UV radiation.Here, equilibrium is operated to reach absorptiondesorption and degradation upon exposure to UV radiation.An aliquot of 4 ml reaction solution was collected for measure using absorbance of UV-Vis spectrophotometer.The MB degradation percentage was estimated by the following equation, and C0is the initial MB concentration at initial time (t = 0) and Ctis the MB concentration at equilibrium time (t) [23].
After experiment, the catalysts were vigorously cleaned with distilled water and taken for reuse.It was applied with scavenger for degradation of radical of 20 mg·L-1of Ag@TiO2photocatalytic in 20 mg·L-1MB dye solution through ascorbic acid (·OH scavenger), 2-propanol (·O2scavenger) and ammonium oxalate (AO)(hole h+scavenger) to each experimental solution, respectively[36].All experiments were applied subsequently irradiated by UV light (352 nm), and adsorption were studied during dark experiment.
2.4.Kinetics of photocatalytic degradation of MB
Present work, the kinetics study of MB photodegradation was used, and estimated by the Langmuir-Hinshelwood (L-H) model[37].Herein, the rate of the photodegradation reaction has been calculated using the following equation:
where r is the reaction rate of the photodegradation(mg·L-1·min-1), t expresses the time (min), k as the constant rate(mg·L-1·min-1),σ represents the fractional applying of catalyst surface, and K refers the equilibrium constant (L·mg-1) of adsorption.When relatively weak to low adsorption equilibrium, thus adsorption is relative equilibrium as KCt.This equation could be satisfied by pseudo-first-order kinetic model [38], which are expressed as follows:
where kapprepresent the apparent rate constant(min-1),thus intergrading using the final expression:
Therefore, the rate constant can be calculated by plot between ln(Ct/C0) versus time (t) from slope.
2.5.Reactivity descriptors
All models were calculated using the B3LYP method via the 6-311G(d, p) basis set of density functional theory.Combined DFT results were obtained from GAUSSVIEW’S program for geometry optimization [39].The reaction model applied in computational which could forecast as molecule with photochemical interference such as·OH radicals.Herein binding energy was calculated as follows as [40]
Therefore, following name as EBnd/Energy,Ecomplex-Ag@TiO2-MB,EAg,E(TiO2)n,E(TiO2)nand EMBare total binding energy,energy of complex of silver and titanium oxide and MB,energy of AgNPs,(TiO2)nclusters and MB dye,respectively.For the charge transfer has been optimized, each donor NBO (i) and acceptor NBO (j), the stabilization energy (E2) expressed i →j delocalization, and estimated the charge transfer into donor and acceptor orbitals by Eq.(6) [39].
Herein, qias represented the orbital occupancy, εi, εjare diagonal elements and Fi,jexpressed the elements matrix of NBO Fock the off diagonal.Electrostatic potential is V(r) at a point charge r,which is distance from the Qiand Ridifferent distance between Qito r point.
Therefore, the electrostatic potential at r point has been calculated in Eq.(8).
Herein, ZAε is denoted a charge on nucleus (A) located at RA,|RA- r| is the distance of nucleus from r, and |r′- r| obtains from the distance of each electronic charge which is increment -e ρ(r′)dr′from r.Dipole moment(μ),polarizability(α),and total first static hyperpolarizability (β) in atomic units, can be expressed in terms of x, y, z components and are given by the following equations [39]:
This can be seen that the components βxxz, βxxy, βyyy, βxyy, βzzz,βzxx,βzyyand βxxxwhere contribute the major part of hyperpolarizability from MB molecules.Global reactivity descriptor has been expressed as follow as [28,33]:
2.6.Local reactivity descriptors
As applied of Fukui function f(r) which is most important of local DFT descriptor, large values the function means as higher reactivity [41].It refers to available the molecular sites which change electron density driven by the change in the number of electrons.The Fukui function consists relative to give information about molecular available sites, but it is essential to known about the local softness s(r) due to molecular interference depends up on site of the molecules.As it is related with function of Fukui through s(r) = Sf(r) and S as global softness.The Fukui function conformed on the local site reactivity of molecules with chemical reaction.Herein applied the Mulliken atomic charges of cationic and anionic states, local Fukui functionslocal softness valuesand local electrophilicityindices have been calculated using the following equation [42]:
Local softness values and electrophilicity indices are calculated using following asandWhereas, positive (+) and negative (-) are observed nucleophilic and electrophilic attack,respectively.Fukui functions,local softness values, and local electrophilicity suggested the selected cleaving of MB of atomic interference, where maximum of local nucleophilic reactivity descriptors as[40,43].
3.Results and Discussion
3.1.Catalyst characterization
The physico-chemical characterization of catalysts have been shown in Table S1 (in Supplementary Material) where pHzpc(TiO2>AgNPs >Ag@TiO2), BETsurface(TiO2>AgNPs >Ag@TiO2),pore volume (TiO2>AgNPs >Ag@TiO2), and pH are observed.Therefore, pHzpcis important to surface attraction whether protonation or deprotonation, if pHzpc>pH then shows deprotonation and alternatively observed protonation pHzpc>pH.The catalytic degradation takes in a major role to MB cleavage by catalyst.
The EDS spectra and SEM images of the fabricated the AgNPs,respectively, are shown in Fig.1(a) and (b).However, Fig.1(a)clearly demonstrated that silver nanoclusters with granular or deformed crystal shapes were successfully generated,and EDS also indicated the existence of a significant amount of silver (W:21.37%; A: 25.66%).According to Fig.1(c) and (d), the rod-shaped like of crystalline TiO2anatase,few spherical and sheet like crystals are observed[44].The SEM measurements show that the catalysts’particle size has been consistent.The nanoparticle ranges of TiO2,AgNPs and Ag@TiO2are 45.39 ± 2.35, 76.76 ± 2.45, and 80.76 ± 3.29, respectively.This is confirmed by DLS average particle size,which is shown in Fig.S1(a)-(c).The EDS shows that the Ti (A:55.88%) and O (A: 18.87%) are present in remarkable amounts.However, silver-doped titanium dioxide, as seen in Fig.1(e) and(f), has a hexagonal prism-like spherical shape.T, O, C, and Ag are presented alongside the initial measurements.Notably, there is a significant amount of silver and titanium (A: 14.82% for silver and 26.87%for titanium).Findings of Ti,C and Ag appear to be sufficiently proven to support elemental mapping.TEM,SAED and HRTEM images of catalysts,e.g.,AgNPs,TiO2, and Ag@TiO2are shown in Fig.1(g)-(i).It exhibits that the AgNPs are nanoparticle ranges,with certain regions either aggregation or overlap (Fig.1(g)), are evident with SEM images.The planes (1 1 1) of the lattice fingers have an interplanar spacing of 0.32 nm.Selected area (electron)diffraction (SAED) pattern clearly appreciates with XRD pattern which showed Miller index of (1 1 1) and (2 0 0), suggesting an excellent crystallinity shape, owing to a good fit with the AgNPs[45].In contrast, the TiO2anatase phase clearly obtained spherical oval shape from TEM, and HR-TEM indicated the d spacing as 0.37 nm, and also indicated the crystalline anatase direction in SEAD (Fig.1(h)).The bright diffraction spots obtained as Miller index (0 0 4), (1 0 1) and (2 0 0), indicating the polycrystalline surface of anatase TiO2[46].With the help of a TEM image and a SEAD pattern, the Ag@TiO2is apparent in crystalline form (Fig.1(i)).The HR-TEM shows that the interplanar spacing (d) at (1 0 1) and(1 1 1) are 0.43 nm and 0.36 nm, respectively.This is a result of interference with the effective heterojunction between AgNPs and TiO2.Furthermore, it is clear that the material has sphericalpolygon-like Ag@TiO2structure with polycrystallinity and bright diffraction spots in the SAED pattern.Because of this, organic molecules within crystalline structures can be conveniently separated or adsorbed by surface charge, and heterojunctions are more appropriate as semiconductor materials for optically induced separation of electrons and holes [47].
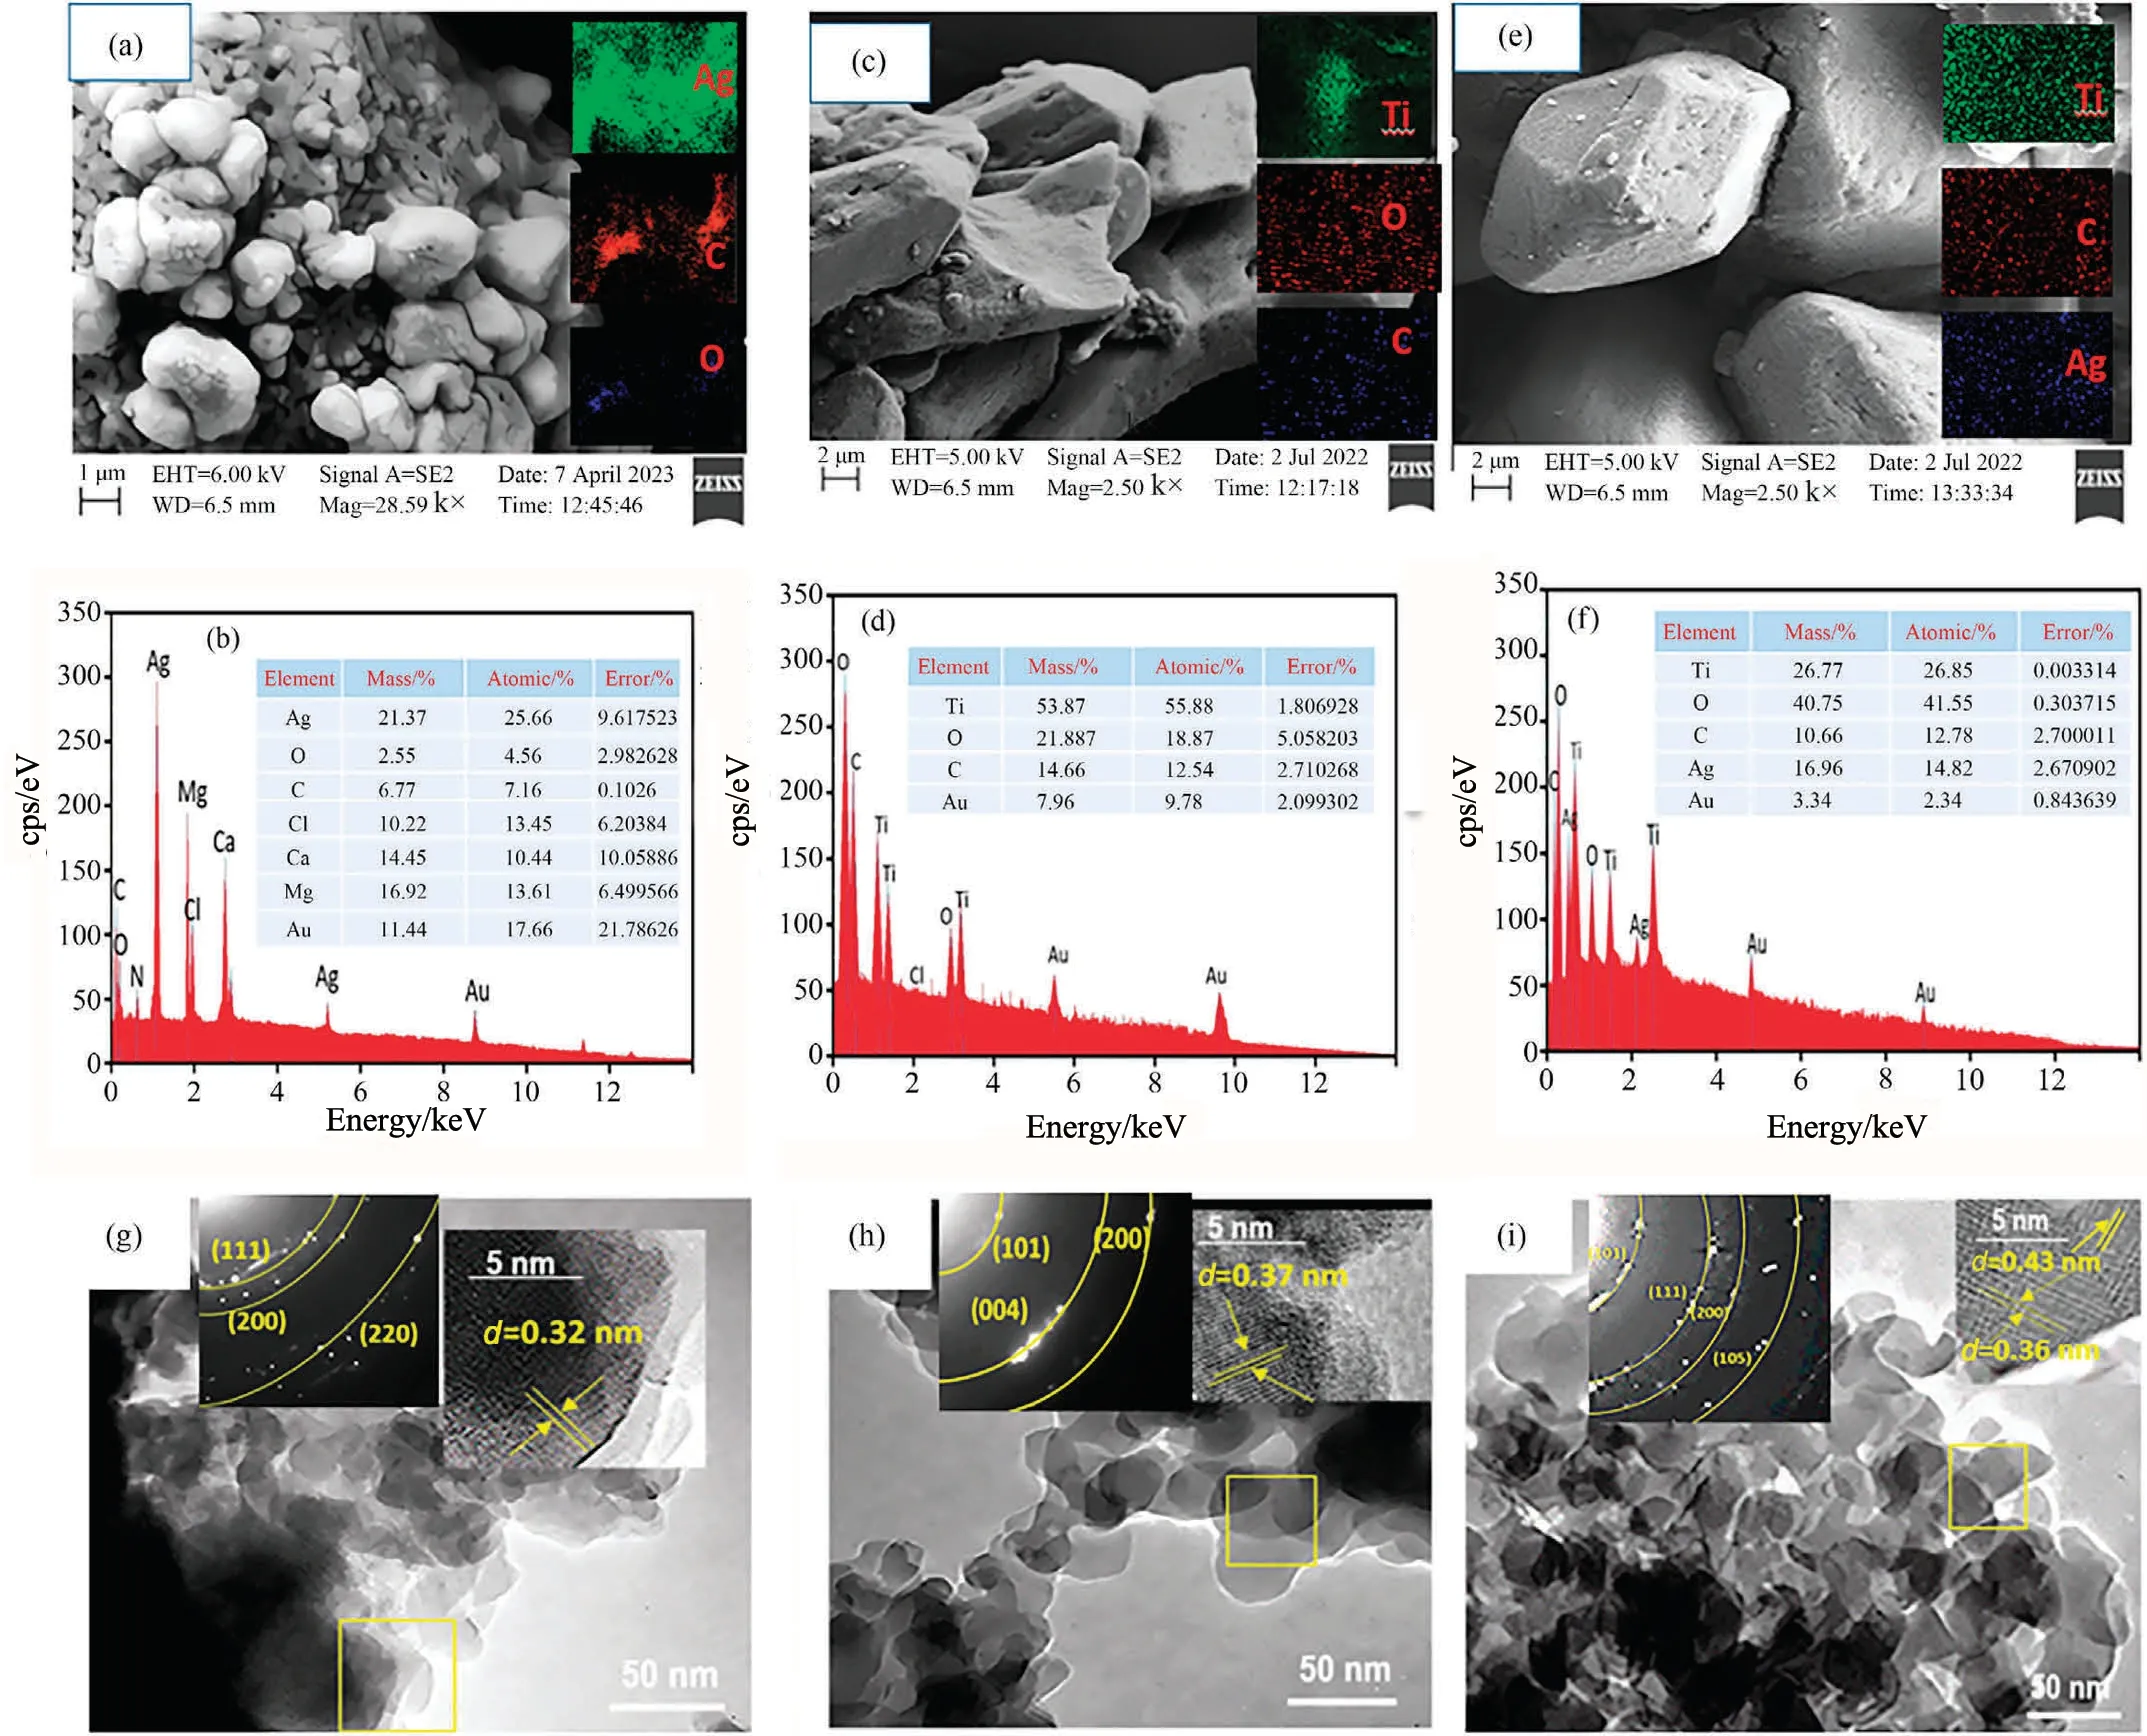
Fig.1.(a),(b) SEM, elemental mapping and EDS analysis of silver nanoparticle (AgNPs), (c),(d) SEM, elemental mapping and EDS analysis of TiO2 anatase, (e),(f) SEM,elemental mapping and EDS analysis of Ag@TiO2 with elemental mapping, (g) TEM, SAED and HR-TEM analysis for AgNPs, (h) TEM, SAED and HR-TEM analysis for TiO2 anatase (i) TEM, SAED and HR-TEM analysis for Ag@TiO2.
The strong diffraction data are observed in Fig.2(a), the TiO2anatase peaks (2θ) at 26.29°, 36.69°, 37.98°, 38.71°, 48.55°,53.29°, 55.77°, and 63.41° assigned to miller index as (1 0 1),(1 0 3), (0 0 4), (1 1 2), (2 0 0), (1 0 5), (2 1 1), and (2 0 4), respectively (JCPDS card# 21-1272) [48].However, Ag@TiO2shows similar as crystalline plane with TiO2anatase, and silver peaks at 38.02°, 44.49°, and 64.36° corresponds to (1 1 1), (2 0 0), and(2 2 0), referring as existing of silver nanoparticle (JCPDS card#17-2773) [49].Silver doped TiO2has coexists with XRD peaks at (1 1 1), (2 0 0), and (2 2 0), deals with nano ranges as 23.45 ± 0.5, 42.33 ± 0.61, and 33.61 ± 0.29.Therefore, crystallography doped elemental ratio is 5:2 of Ti and Ag, respectively [50].
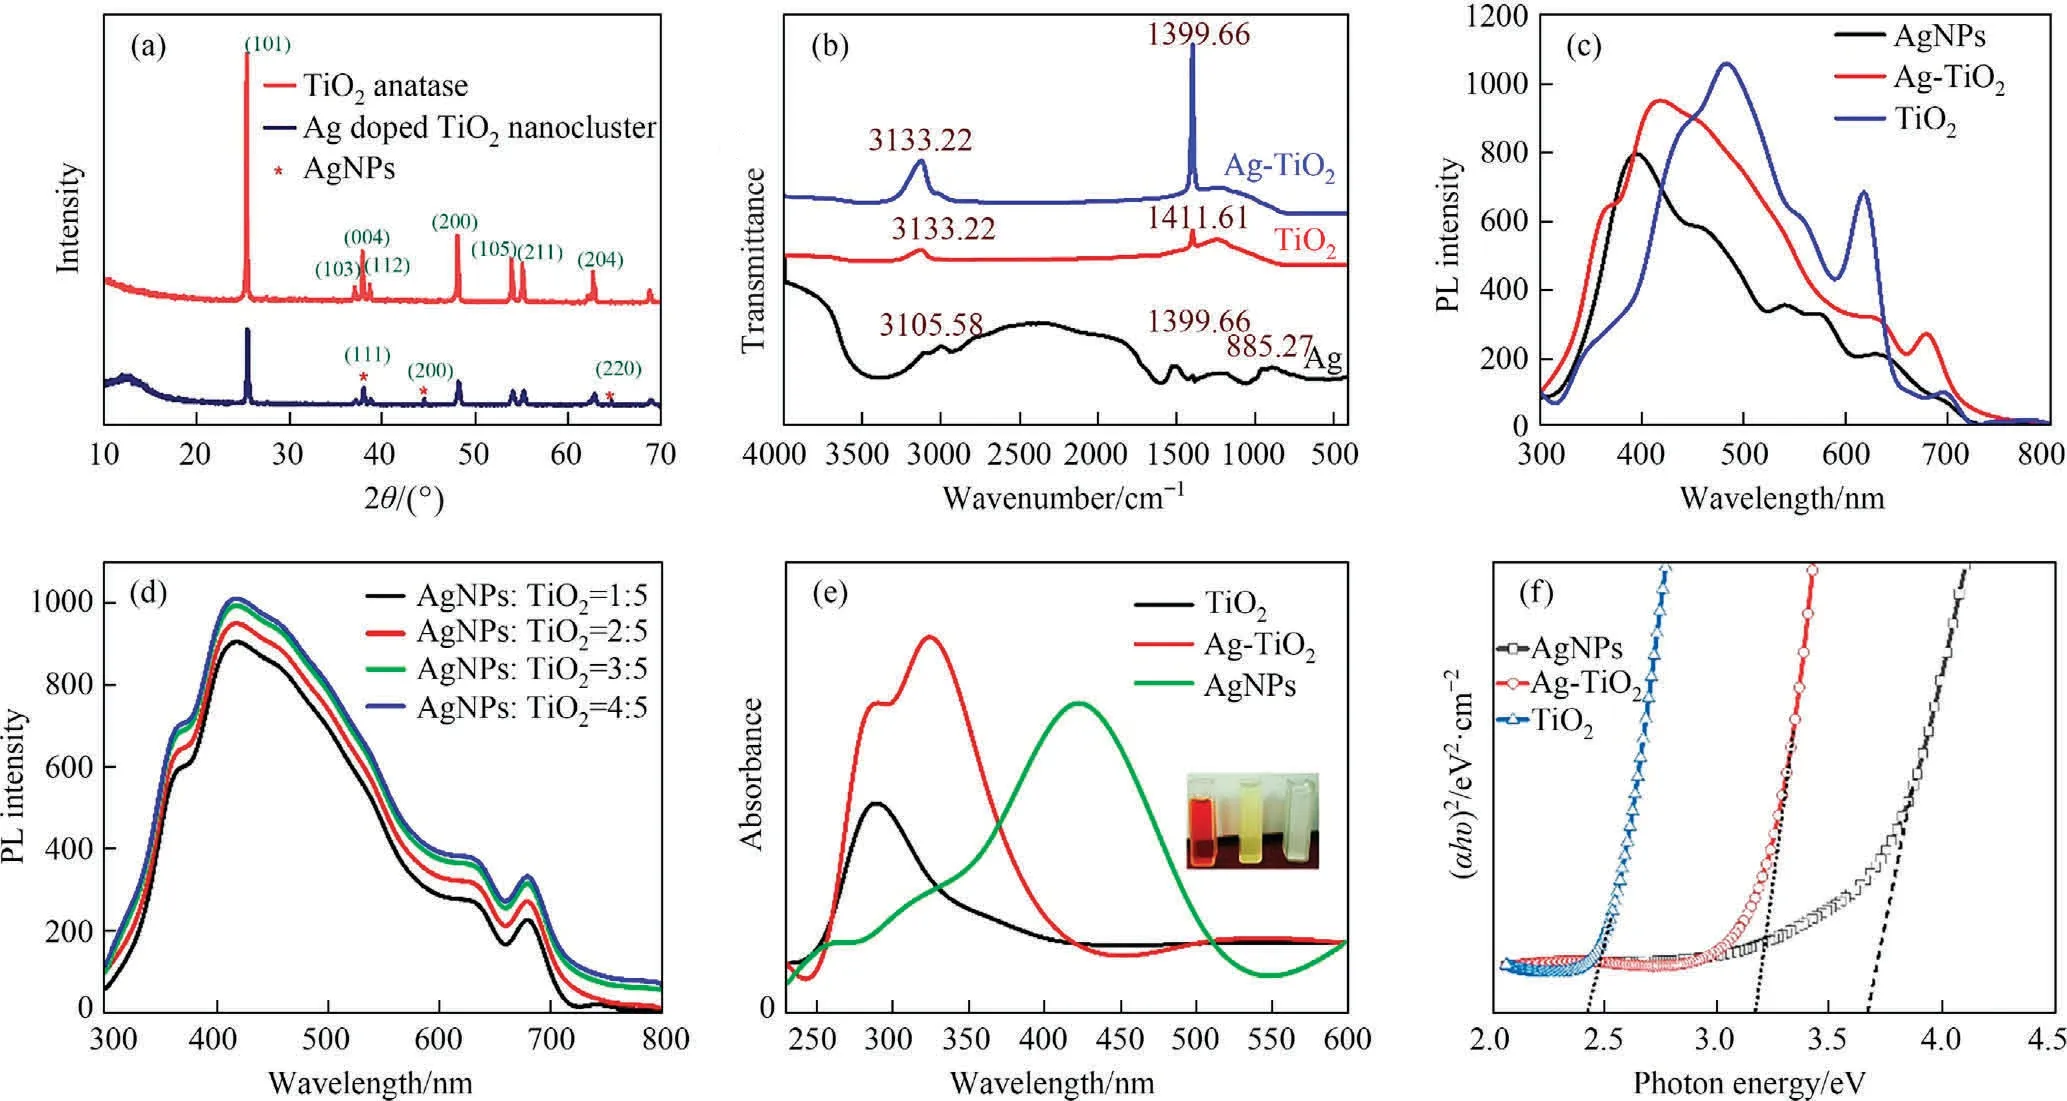
Fig.2.Physiochemical analysis of fabricated photocatalyst (a) XRD pattern analysis; (b) FT-IR analysis; (c) PL analysis for the catalysts; (d) PL analysis on different concentrate ratio for Ag@TiO2; (e) UV-Vis spectroscopy; (f) band gaps by Tauc plot.
The FT-IR analysis was carried out to estimate the chemical composition of surface functional groups.This analysis was displayed in Fig.2(b).The strong peaks of AgNPs assigned at 3105.58 cm-1, 1399.66 cm-1, 885.27 cm-1corresponds to Ag-O-C, Ag-OH, and Ag-O-phenol respectively.This groups are present due to capping agent of biochemical agents of plant extract which become form of Ag+to Ag0.On the other hand, the strong bands of TiO2at 3133.22 cm-1and 1411.61 cm-1refers to Ti-O-Ti, and Ti-O-H, respectively [51,52].The Ag@TiO2shows sharp peaks at 3133.22 cm-1and 1399.66 cm-1are represented the Ti-O-Ti and Ag-O-Ti, respectively [48].It is conformed to available band intensity increased when doped with silver at 1399.66 cm-1due to Ti-O-H co-binding with Ag, and silver substituting by the deprotonation.
The Raman spectroscopy was analysed which is shown in Fig.S1(d).The strong peaks were observed at 497.73 cm-1(Eg) and 651.04 cm-1(A1g) of TiO2, confirming the purity TiO2anatase phase[53].The B1gband does not attributes due to antisymmetric bending vibration, therefore, Egband suggests the O-Ti-O is symmetric stretching, and A1gband also antisymmetric bending vibration of TiO2for O-Ti-O stretching.On the other hand, AgNPs showed the peaks at 409.17 cm-1(Eg), 491.76 cm-1(B1g),and 597.39 cm-1(A1g), assign to Ag-O stretching mode,Ag-O-C stretching, and arise C-C, conforming the biofabricated silver exists [54].The Ag@TiO2observed that the peak at B1gshifted at 551.84 cm-1, means Ag-O-Ti stretching.Also, the peaks shifted at 448.34 cm-1and 620.73 cm-1assigned to Egand A1g, respec-tively.Therefore, it is conformed that silver is successfully doped into TiO2lattice.
One of the most widely used methods for studying the electronic behaviour of catalysts is photoluminescence (PL) spectroscopy,which could be used to transmit the rate at which photoexcited electron-hole pairs recombine in semiconductor materials [55].The effectiveness of charge carrier trapping and transfer in semiconductor materials,which exhibit surface oxygen vacancies and defects, is often impacted by the PL spectrum [56].Therefore, this study focuses on the PL spectra of Ag doped TiO2,AgNPs, and TiO2at room temperature for the photo excited with a wavelength of 352 nm illustrated in Fig.2(c).It can be observed that the spectrum intensity decreases according to AgNPs <Ag@TiO2<TiO2, with the maximum intensity of peaks shifted to 385 nm, 425 nm and 482 nm and the band-edge emission corresponding to nanocrystals.This implies that the electron hole recombination rate is higher in TiO2and the separation efficiency is also higher in Ag@TiO2.A significant number of photoexcited charge carriers took part in the photochemical transformation,which in turn increased the photocatalytic activity,as seen by the decline in the recombination rate.AgNPs often appear to have lower intensity because their excitation states are lower in the UV range, while TiO2anatase was well-conducted in this range, allowing it to effectively assemble photoexcited electron-hole pairs in the present state[57].Where there is an oxygen vacancy and a shallow donor-type electron transition.However, Ag@TiO2demonstrates that the intensity of the PL emission is proportional to the electron transfer of AgNPs to TiO2from the conduct band to the valance band of the TiO2defect state, which enhances the separation of electrons and holes from the titanium vacancy [58,59].Contrarily, in this research, the AgNPs/TiO2ratio was changed to maximise the PL spectra as the Ag concentration ascended (Fig.2(d)).As a result, Ag charge carriers during TiO2hole recombination could be particularly impacted.When AgNPs are doped, the procedure turns trapped electrons and holes into higher emission intensity in a rising ratio [59].This process has to enhance recombination.
The surface plasmon resonance (SPR) is most important as calculation the band gaps and energy state.It can be seen from Fig.2(e), whereas absorbance intensity shows at 340 nm, 285 nm, and 445 nm refers to Ag@TiO2, TiO2, and AgNPs, respectively.The band gaps (Eg) were calculated the catalysts using Tauc’s equation (Eq.(19)) [60].
Herein,k is constant value,and the photon energy is hν where h is the Planck’s constant,and n is related the electron transmissions(valance band to conduct band).The vibration frequency is (αhν)2and plot against to photon energy[50,61].The plot has been shown in Fig.2(f).Therefore, the collected band gaps of catalyst are 2.41 eV, 3.16 eV, and 3.66 eV corresponds to TiO2, Ag@TiO2, and AgNPs, respectively.
The XPS measurement was carried out to observe the composition of chemical constituent and their binding energy.From Fig.3(a), the general survey and high resolution spectra illustrated,binding energy at 620 eV,is ascribed the Ti2p, 510 eV also showed O(1s).Herein,two XPS spectra as TiO2and Ag@TiO2,shows 380 eV binding energy of Ag (3d).This is clearly revealed that the AgNPs are successfully doped with TiO2anatase [62].The binding energy of C(1s)showed from Fig.3(b),and it is seen that O-C=O/O-C=N binding pattern at 306 eV, C-OH binding at 307.56 eV, C-O/C-N at 308.61 eV, C-C/C-H at 309.07 eV and Cβat 310.51 eV.This peaks attributed to formation with silver nanoparticle and ethanol when fabricated the TiO2.From Fig.3(c) attributed the Ti (2p)spin-orbit split components, and observed the three major form of Ti, which are Ti2O3(1/2), Ti4+(2p3/2), and Ti2O3(3/2) [63].Silver nanoparticles doped with TiO2, the binding energy at 380.45 eV and 387.34 eV (Fig.3(d)) are ascribed to Ag 3d(5/2) and Ag 3d(3/2), respectively.Those are spin-orbit split components of the Ag 3d spectrums,again conforming the metallic Ag due to binding energy at <6 eV for separation [50,62].When combination with O(1s) binding observed at 416.78 eV, 445.76 eV, 500.81 eV,500.76 eV(blue spectra), and 531.24 eV attributed the O-C=O,O=O, TiO2, -OH, and Ag2O (Fig.3(d)).This oxygen spectra conformed that the Ti and Ag binds with oxygen and formed to FCC crystal structure of Ti-O-Ag associate with TiO2lattice [65].
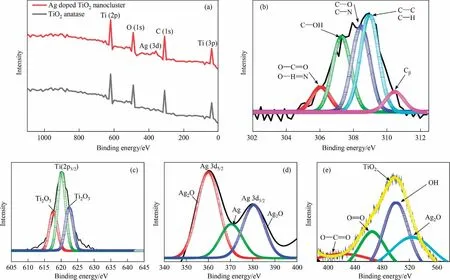
Fig.3.(a) XPS analysis of fabricated Ag@TiO2 and TiO2; (b) binding energy of C; (c) binding energy of titanium; (d) binding energy of silver; (e) binding energy of oxygen.
3.2.Photocatalytic activity
The parametric effects on dye degradation is an essential investigated to find the proper degradation, such as photo catalyst concentration (e.g., Ag@TiO2cluster), initial concentration of dye, pH,temperature and exposing photon energy (irradiation time).It can be seen that the MB removal efficiency faced on dark condition,and UV-exposure.The effect on the catalyst under UV-322 nm irradiation,0.1-2 mg per 100 ml of dye solution was employed to verify the initial dose.Effectiveness of catalyst, surface energy encouraged to formation of electron-hole, here phenomena owing to dye availability and reaction equilibrium.Further increased the dosages,there are no significant increase of the degradation,it can be ascribed to the enhanced the aggregation of particle by photo energy excitation into inter-particle interference to resist the degradation [66].
3.2.1.Effect on temperature and thermodynamic study
In photocatalytic studies, thermal effects can lead to energy conversion when electrons move into the lattice,forming phonons.Phonons take heat into the carrier through phonon-to-phonon-like energy conversion.From Fig.4(a), it can be observed that removal actively increased when decreased the temperature at 353 K, due to photocatalytic activity increased at low temperature where electron mobility and interfacial charge (electron-hole) transfer enhanced.In addition, the photo thermal process shows inversely proportional to temperature and conductive effects, assuming the reaction is electron-phonon coupling [67].From Fig.S2, it can be observed that the degradation percentage comparatively decreases according their increasing temperature at 353 K.As a consequence,degradation becomes more prominent in comparison to Ag@TiO2>-TiO2>AgNPs because it is likely that adsorption played a significant role or had a twofold effect that might increase surface energy and lead to MB cleavage and removal.On the other hand,different catalysts play a role in the exchange rate of electronholes and lead to quantum effects mainly by the thermodynamic parameters of the reaction.Herein, Arrhenius theory, and transition state theory are applied to known about activation energy and entropy,enthalpy and Gibbs free energy.These parameter calculative formulas were given in Supplementary Material.In this context, the results were summarized in Table 1 with the rates and activation energy.The activation energy looks following order as Ag@TiO2(7.628 kJ·mol-1) > TiO2(6.329 kJ·mol-1) > AgNPs(2.309 kJ·mol-1), the hole-electron interferences decreased at higher temperature and assuming little interference of the chemical reaction (Ea<40 kJ· mol-1).The positive value of enthalpy (ΔH°) with the increasing value of kappaccording to increasing temperature suggests that the photocatalytic degradation of MB is an endothermic reaction of all catalysts, and observing enthalpy as Ag@TiO2(126.80 kJ·mol-1) < AgNPs(354.47 kJ·mol-1) < TiO2(430.04 kJ·mol-1).Thus, the Ag@TiO2catalyst comparatively little effect on enthalpy, this probably due to the electrostatic interac-tion could effect on large hydrophobic interference into photocat-alyst and MB.In addition, TiO2and AgNPs shows that the ΔG° values are negative, alternatively,Ag@TiO2catalyst shows highly positive values. This phenomenon is not a spontaneous process on Ag@TiO2catalyst,assuming weak adsorption process, and pos-sibilities the higher photocatalytic potential than other two catalysts.
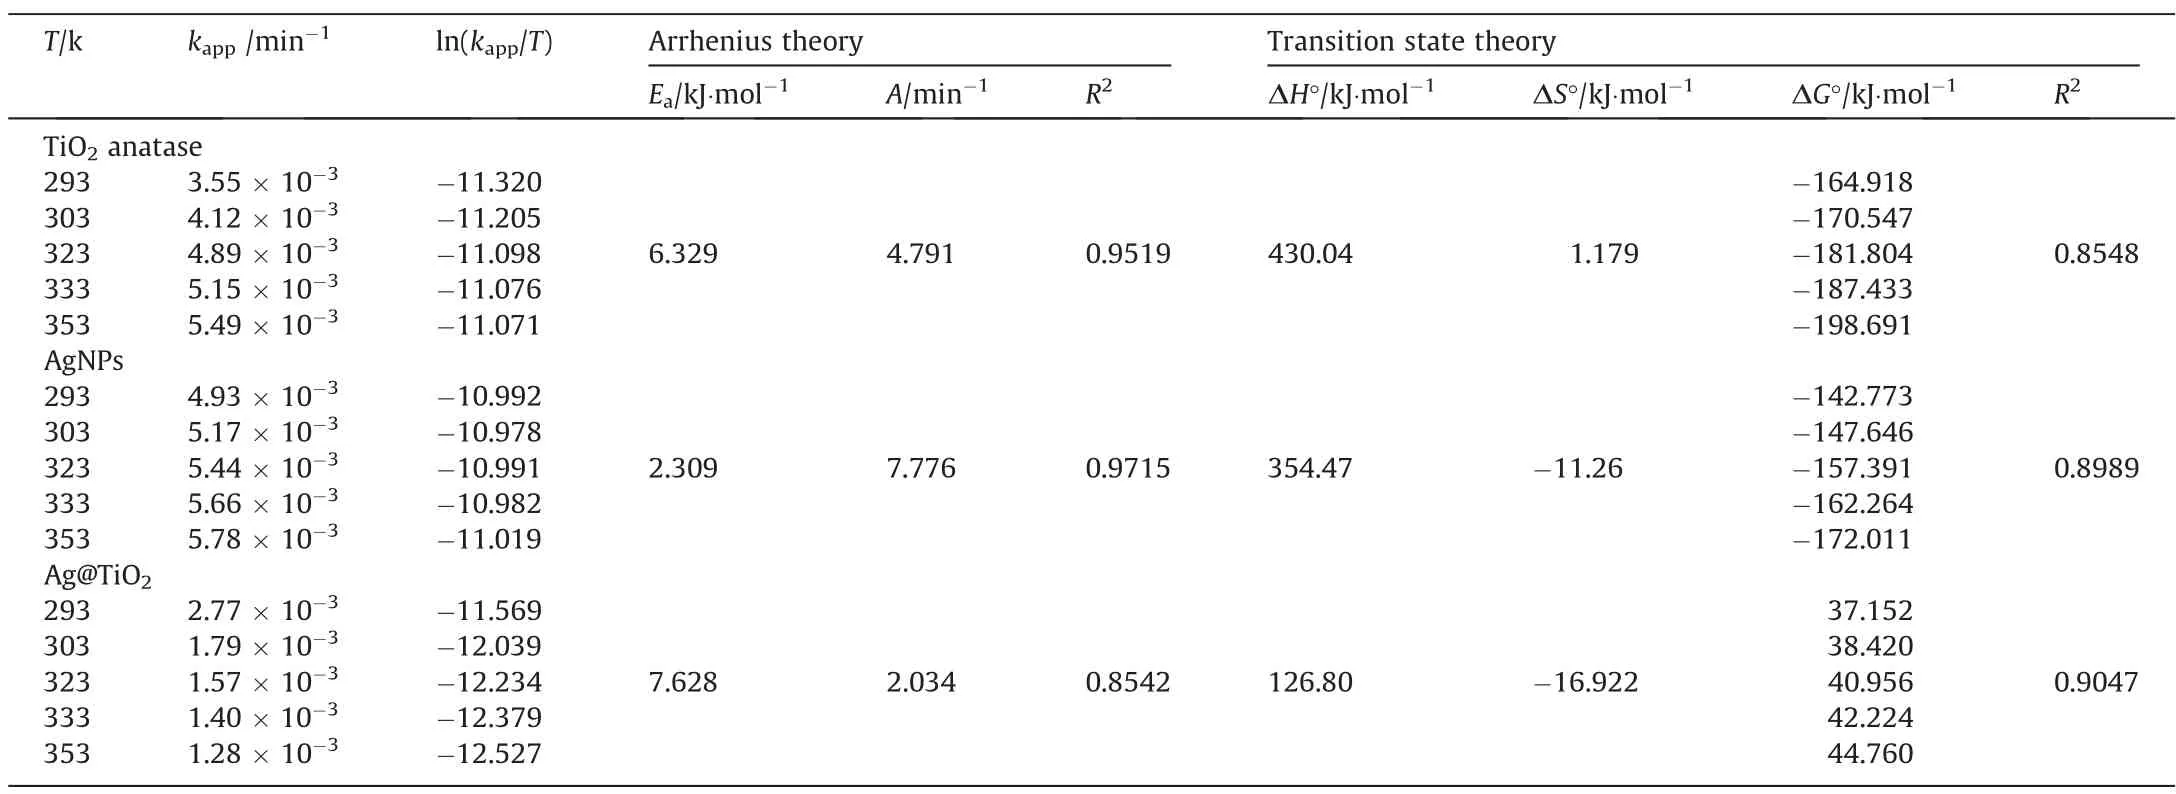
Table 1 Thermodynamics parameters and activation energy of MB degradation
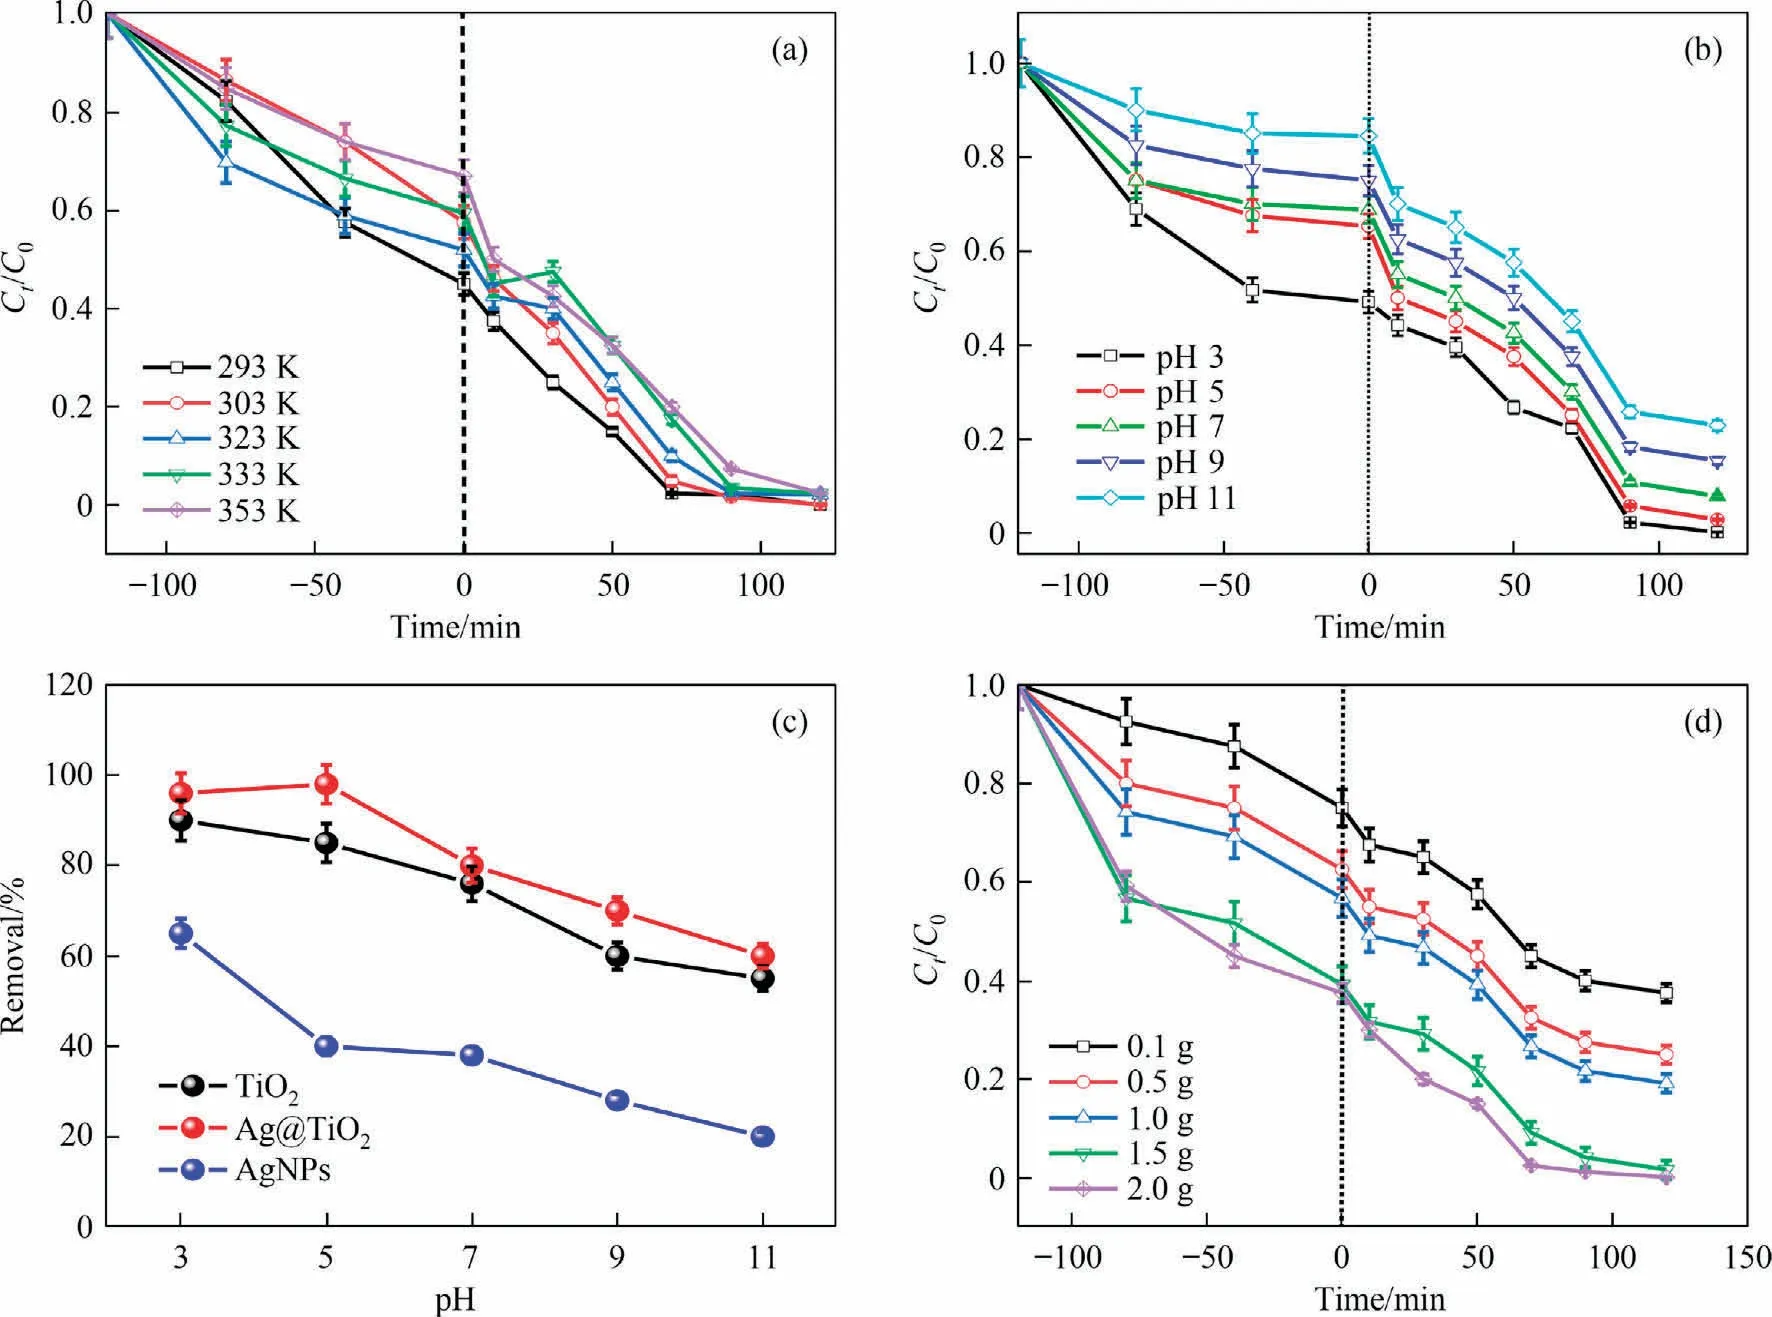
Fig.4.(a) Influencing the temperature of Ag@TiO2, (b) effect of pH against time of Ag@TiO2, (c) comparative of various catalysts against pH, and (d) effect on dose of Ag@TiO2.
3.2.2.Effect of solution pH on MB removal
When MB photocalytic occurs on the surface of the catalysts, the nature of MB easily adsorbed on the surface of catalyst.On the other hand, it is greatly observed that colloidal particles could interference of surface charge to influence of MB removal.The surface charged introduced with pH and pHzpc, which is hinder to cleavage the MB molecules [68].In view of fact that dye could take place a crucial step on adsorption-degradation under UV irradiation.Lower pH expedited elimination in this case because it affected the catalytic degradation and surface adsorption of the MB,as illustrated in Fig.4(b).The molecular interference with deprotonation of the catalytic surface due to positive surface charge(pH < pHzpc) correlates to pH values of 3 > 5 > 7 > 11 when MB is removed.Since hydroxyl ions are mainly responsible for the cleavage of MB molecules at pH values of 3 to 5, this is the range at which photocatalytic degradation is most efficient (Fig.4(c)).The pH interference with degradation mechanism in the acidic or alkali condition, when degradation increased at lower pH whereas.
3.2.3.Effect on catalytic doses
The photon absorption capacity has a major impact on photocatalytic degradation, and degradation is influenced by the active site availability.0.1-2.0 g of catalyst dosage were involved for the photocatalytic elimination of MB.As observed in Fig.4(d),the maximum quantity of MB degradation occurs when 2.0 g of doses are used, and it is boosted as the catalyst amount increases.At lower dosages,the few active radicals needed to break down the MB dye, are produced by a small proportion of activated sites at lower dosages.However, photocatalytic degradation boosts their rising dosages because free electrons from CB might be enhanced to UV absorption by superoxide and hydroxyl radicals.According to Figs.S3 and S4, the irradiation time had the greatest impact.At 240 min, the 2 g catalyst dose led to increased degradation(70%-80%).The Ct/C0curve exhibits a decreasing sequence under dark settings as the adsorption process plays a significant role.This is followed by comparable transactions under UV conditions,where the highest degradation occurs between 0 and 75 min.This is explained by the fact that UV absorption increases the rate of free electron production, and thereby linearity suggests either lower dye molecules (lower VB intensity) or shorter or agglomerated catalyst interfaces [69].There are not enough MBs accessible for degradation owing to the high kinetic rate.
3.2.4.Effect of initial MB concentration
The effect of initial concentration for MB removal through adsorption and degradation using photocatalytic compound, i.e.,Ag@TiO2.As shown in Fig.5(a), dark conditions have an impact on the adsorption phenomena.At 75 min,20 mg·L-1seems to have the maximum adsorption.Other concentrations were seen at 20 mg·L-1>10 mg·L-1>40 mg·L-1>5 mg·L-1>30 mg·L-1.This phenomenon causes an increase in removal in dark conditions as a result of adsorption interacting with the catalyst’s accessible surface.The varying MB concentrations slowly remove under UV irradiation for up to 120 minutes.Apparently,MB·was subjected to an electron transfer(e-)to Ag@TiO2after being stimulated by UV light(photon energy) in the first place.Alternately, a hole is generated by AgNPs and TiO2that cleaves the MB molecule by the generation of·OH and·O2-.The percentage of degradation increased as concentration ascended from 5 to 20 mg·L-1, then proceeded to decline at 30 mg·L-1of MB concentration before increasing again at 40 mg·L-1.At a specific time, this phenomenon is seen in concentrations that rise as a result of the catalyst’s excitation of electrons.The photocatalytic degradation of TiO2is depicted in Fig.5(b), where greater degradation occurs at concentrations of 20-40 mg·L-1.Similar to this, AgNPs demonstrated higher removal at 20-40 mg·L-1concentrations.This is because of the availability of either hydroxyl radicals or holes species, as well as the larger concentrations’ potential for being highly reactive to the MB’s dominant cleavage mechanism.
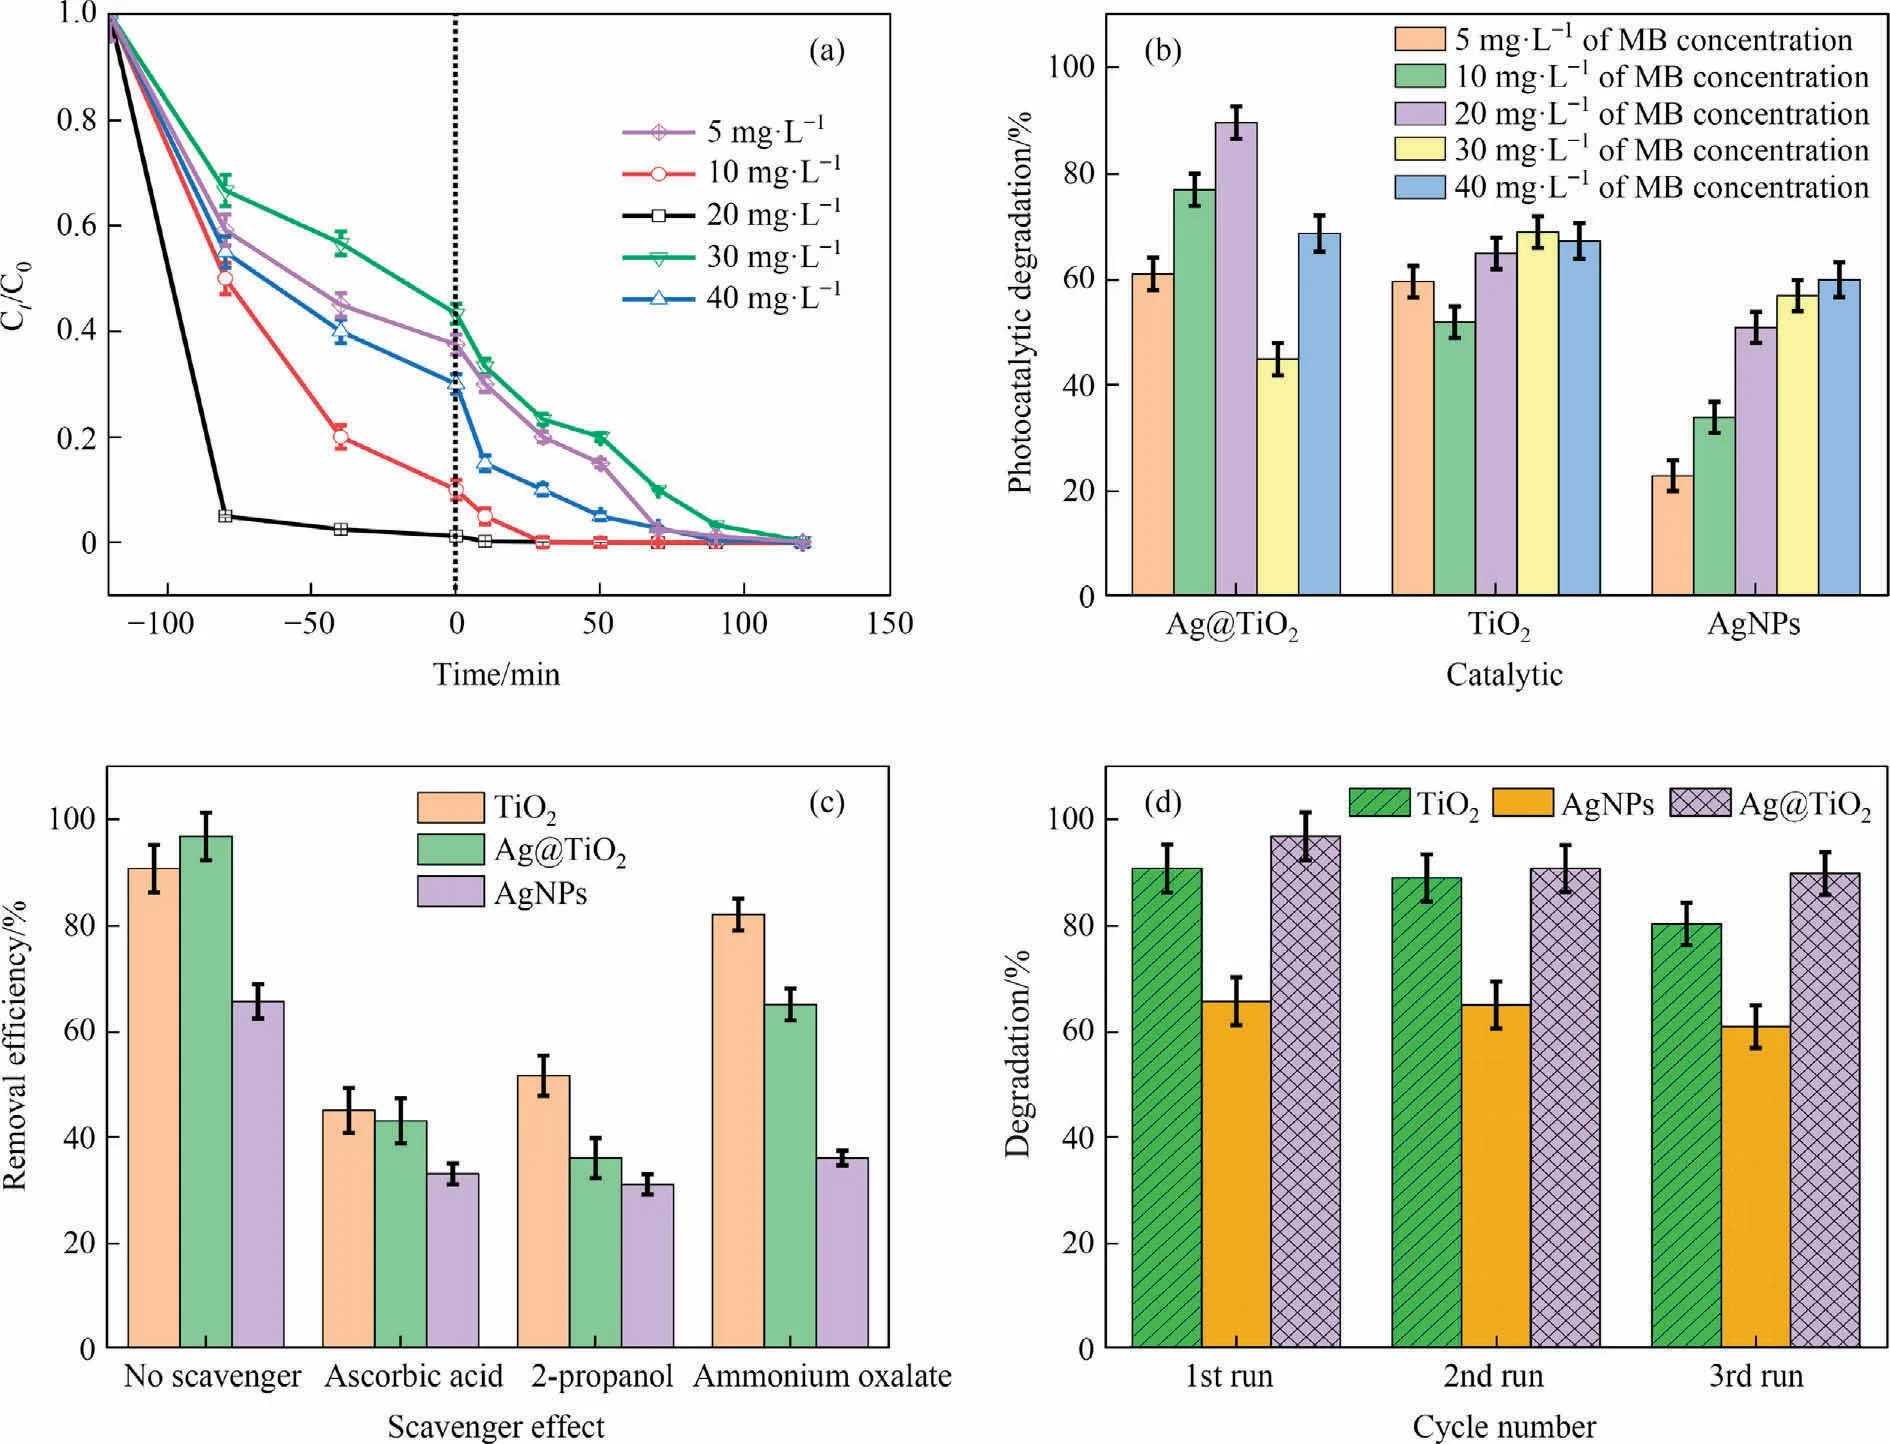
Fig.5.(a) Effect on initial concentration of Ag@TiO2, (b) comparative study of initial concentration of MB and catalysts, (c) role of radical scavengers in the photocatalytic degradation of catalysts, (d) efficacy measurement of the catalysts using cyclic process.
3.3.Kinetics of the photocatalytic degradation
The photocatalytic degradation has to be performed by the apparent rate constant (kapp), which is evaluated through the Langmuir-Hinshelwood (L-H) model.Herein, the photocatalytic kinetics were studied from 5 mg·L-1to 40 mg·L-1of MB concentration with 2 g of catalyst doses.From Table 2 suggests that TiO2anatase shows decreasing trends up to 30 mg·L-1then increased at 40 mg·L-1, where the degradation rate was 3.44 × 10⁻³(R2= 0.9344).The apparent rate constant (kapp), which is determined using the Langmuir-Hinshelwood (L-H) model, is required to carry out the photocatalytic degradation.Here, 2 g of catalyst doses were used to study the photocatalytic kinetics from 5 mg·L-1to 40 mg·L-1of MB concentration.Table 2 shows that the TiO2anatase-induced degradation of MB exhibits decreasing trends up to 30 mg·L-1before resuming to climb at 40 mg·L-1, where the degradation rate was 3.44 × 10⁻³(R2= 0.9344).The rate possible decreases due to electron transport decreasing either agglomeration or reducing of the active site of TiO2.The AgNPs and Ag@TiO2obtained in decreasing trends untilled 40 mg·L-1of MB concentration,and results achieved the rates as 5.40×10⁻³and 5.73×10⁻³,respectively.These findings suggest that the catalytic ratio of the saturation value and the MB concentration gradient cause slower degradation and inhibition of electron hole pairing at higher concentrations.The recombination of charge carriers (electrons) isaccelerated by the plasmon resonance effect as this goes on,and as fewer electrons are able to enter sufficiently pair holes,the rate of this process is slowing down, leading to a higher concentration of MB slow deterioration [70].
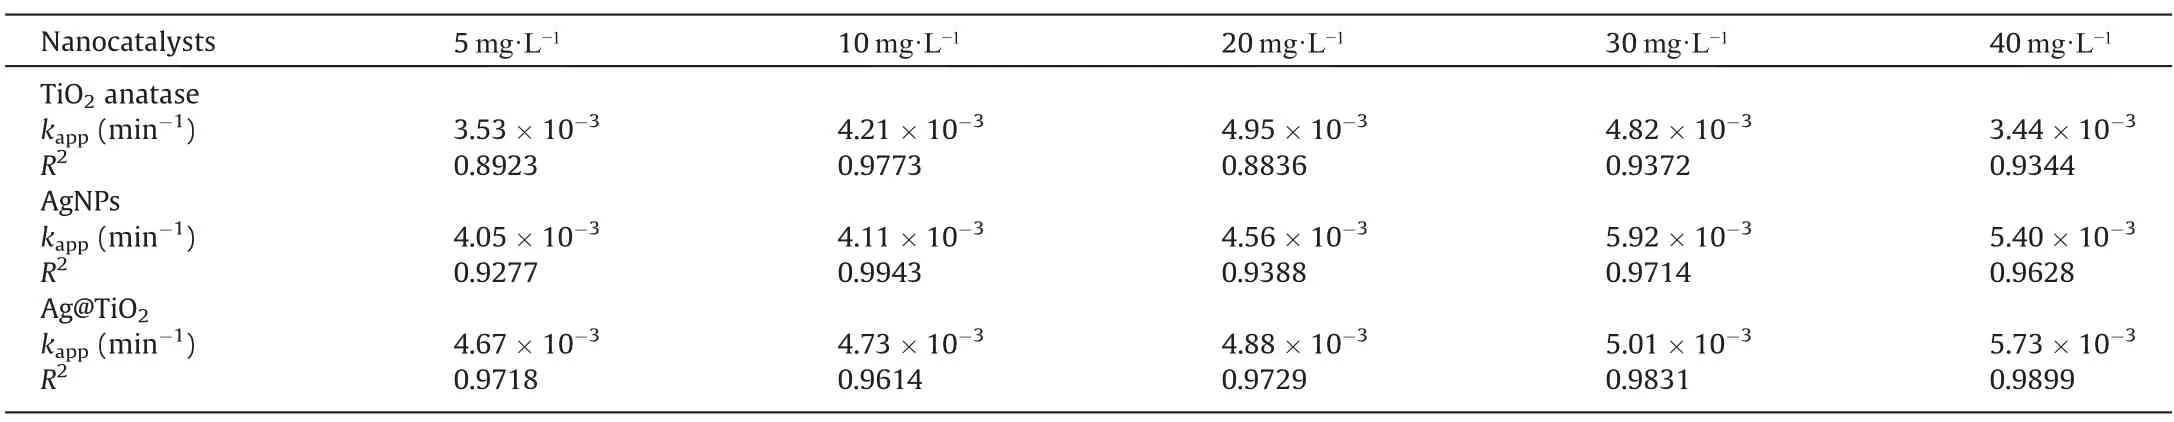
Table 2 Langmuir-Hinshelwood (L-H) kinetic model for degradation of MB
3.4.Crucial effect on scavenger, mechanism, and recycle stability
By using three different catalysts,quenching experiments were used to identify the reactive species that play a role in the degradation of scavengers when exposed to UV light.Based on earlier research,the principal reactive species were applied to each experimental solution in the following ways: ascorbic acid (·OH scavenger), 2-propanol (·O2scavenger) and ammonium oxalate (AO)(hole h+scavenger).The photocatalysts were introduced after the MB solution had been performed with the scavenger.Here,all catalysts are conducted in conjunction with different scavengers, as illustrated in Fig.5(c).The scavengers effect shows on TiO2under MB solution, in order to obtained the removal efficiency reduced as AO(88.33%±3.487%)>2-propanol(53.59%±3.122%)>ascorbic acid (46.76% ± 2.477%).Without scavenging agents, the MB removal efficiency following as Ag@TiO2>TiO2>AgNPs.Therefore,the TiO2photocatalytic influenced of the MB degradation by·OH and·O2-scavenger rather than the hole (h+) scavenger under UV irradiation.Similarly, AgNPs showed that ascorbic acid and 2-propanol reduced removal efficiency, potentially affecting both·OH scavengers and·O2-scavengers for MB degradation.On the other hand, the Ag@TiO2catalysts associated with 2-propanol is greater efficacy to reduction of MB degradation,due to highly reactive superoxide radical anion (·O2scavenger) to MB degradation than the hydroxyl radicals (·OH) and hole h+scavenger.The study clearly suggests that superoxide radical anion major interacted with the MB molecule for oxidative damage.The TiO2and Ag@TiO2catalysts influenced the higher catalytic degradation by superoxide radical anion, and the AgNPs takes an equal role to hydroxyl radicals,superoxide radical,and hole h+scavenger.As mechanism support to discuss the MB degradation for applying the various catalysts,firstly computed the Eqs.(21)&(22)of conduction band(CB) and valence band (VB):
where ECBand EVBare the CB and VB edge potentials respectively,and Egthe bandgap energy of catalysts, such as TiO2, AgNPs, and Ag@TiO2represent as 2.41 eV, 3.66 eV, and 3.16 eV.χ is denoted the absolute electronegativity of AgNPs,TiO2, and Ag@TiO2as 4.77 eV, 5.53 eV, 5.80 eV, respectively.Ecis the normal hydrogen electrode transport scale while values of the free energy is 4.5 eV[71].From value of ECBand EVBshowed in Table S2 of relevant of catalysts, and observed the EVBphoto generated holes potential is higher of the oxidation generation as Ag@TiO2(2.885 eV) >TiO2(2.235 eV)>AgNPs(2.101 eV),respectively.Herein,TiO2and AgNPs are lower the redox potentials of OH-/·OH (2.8 eV vs.NHE), and Ag@TiO2shows >2.8 eV.Thus, photogenerated hole oxidation is higher the Ag@TiO2catalyst and conforming the hydroxyl radical form to degrade the MB dye.Hitherwards, the oxidation potential of ECBis higher corresponding as TiO2(-0.175 eV) <Ag@TiO2(-0.275 eV) <AgNPs(-1.56 eV) and obtaining the higher redox potentials of O2/O2-pair is AgNPs (>-0.33 eV vs.Normal Hydrogen Electrode (NHE)).According to this results to photo-generated electron-holes transfer does not pursue the traditional doublecharge rule.The oxygen and water in MB aqueous media can be changed transfer while applying the catalysts, and ‘electron-hole’(e-moves to h+), primary mechanism leading to photogenerated holes by oxidation degradation of MB.Eventually, the AgNPs and TiO2can produce the heterojunction which leads to photoelectron excitation from VB to CB, hole generally produced from strong oxidizability which become conducted from the dissolved oxygen of solution water.
It is an important parameter to known about the stability and reusability potential of catalysts, which were verified using continu-ous cyclic process to degradation of MB dye.This experimental gen-erally runs using 0.2 g·L-1catalyst dosage, 200 mg·L-1initial dye concentration, 303 K temperature and solution pH 6.The residual catalyst has been separated from MB using centrifugation (1000 r·min-1).The solid part was collected to keeping dry condition in N2blowing hot air oven (100 °C for 1 h),further it is taken to reuse of MB cyclic process.The efficiency percentage was calculated by standard method [72].The observation results can be seen that the Ag@TiO2for MB degradation decrease 4.33% after third cycle process (Fig.5(d)).On the other hand, TiO2and AgNPs illustrates 6.35% and 2.38% of MB removal decreases.The capacity of the material to stay active even after use is demonstrated by the three cycles of catalysts for Ct/C0vs.time (0-120 min) that were evaluated (Fig.6(a)-(c)).The degrading ability of the catalysts has undergone a slight decrease or loss, following a similar trend in Fig.5(d).This loss of catalytic per-formed owing to catalysts material state either agglomerate or chan-ged of band gaps, due to chemical or recombined with MB molecules may lead to change the surface properties [68,73].Since any struc-tural change can result in a degraded crystal structure of the material that can be examined by XRD patterns, it is crucial to understand the stability of the catalyst after degradation or adsorption.However, all catalysts for before and after degradation has been shown in Fig.6(d), the intensity of materials have the excellent crystal structure.Due to the possibility of adsorption of solid or molecular degradation prod-ucts caused by the amorphous material combined with the catalysts, few regions (2θ in between 10° and 20°) are altered or enlarged in the XRD pattern[74].Therefore, it is evident that there was no notable change in peak morphology, and new peaks did not appear.
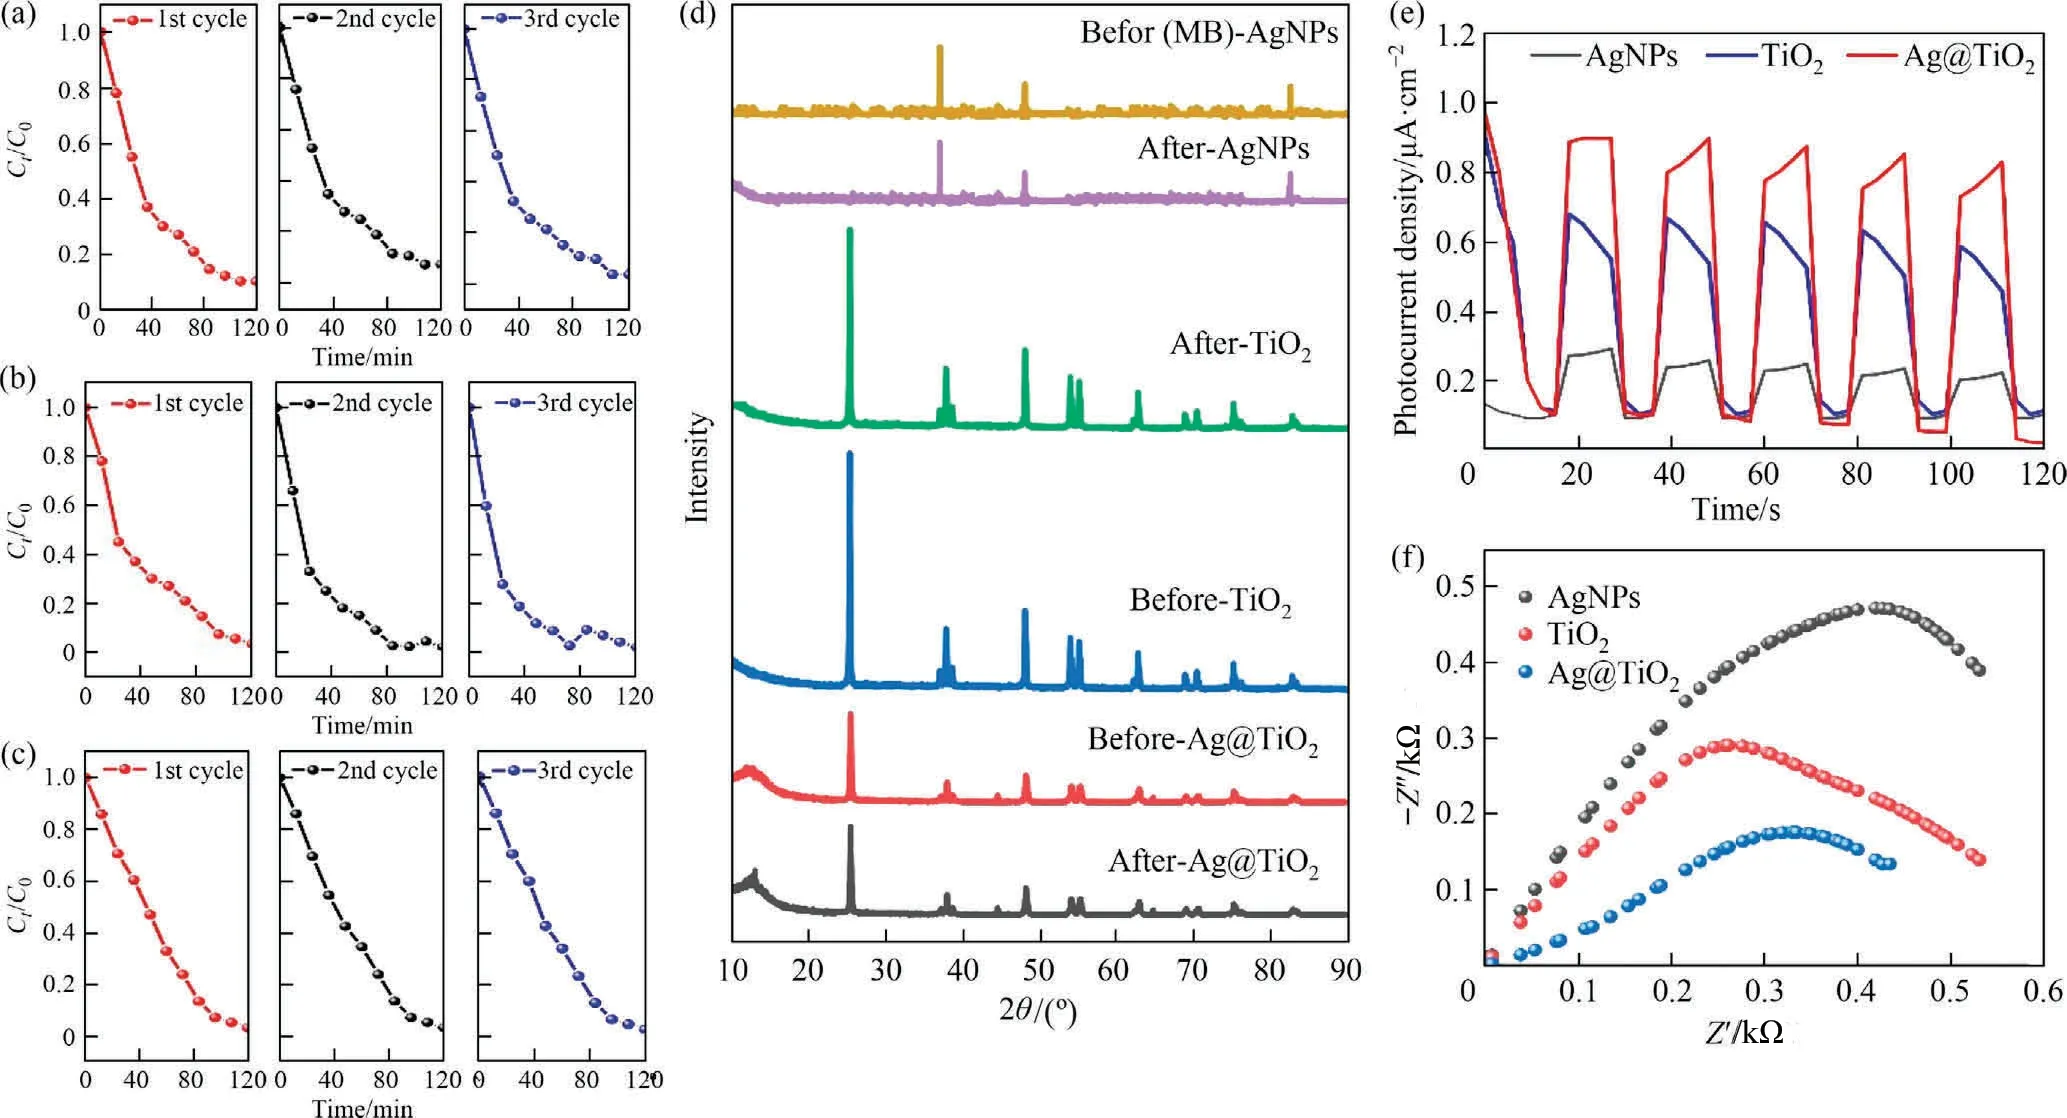
Fig.6.(a) Study of reusability of photo catalyst in recycling reactions for AgNPs, (b) for TiO2, (c) Ag@TiO2, (d) structural or physical stability using XRD patterns for before and after degradation of all catalysts, (e) transient photocurrent response of catalysts, and (f) electrochemical impedance Nyquist plots.
The intermittent illumination was simulated using through light interference, to confirm photocurrent response as AgNPs, TiO2, and Ag@TiO2.Therefore, it can be exhibited that all catalysts have distinct photocurrent response.In this sense, the catalysts induced rapid current responses at regular intervals of five cycles separated by ten seconds, and they caused those responses to drop rapidly when the light was turned off within those five cycles [75].The density of photocurrent is higher order as Ag@TiO2> TiO2>-AgNPs, respectively(Fig.6(e)).It can cause photo e-and hole gen-eration can helps to increased photocurrent.From the electrochemical impedance spectroscopy (EIS) measurements per-formed on diameter of the semicircular Nyquist plot [75], and the results are provided in Fig.6(f).The arc radius of Ag@TiO2showed smaller than that TiO2and AgNPs, because charge transfer resis-tance of the photoelectrode material.It is confirms that the higher charge transfer exists on Ag@TiO2and better interference on elec-trical conductivity, which is another important evidence of the increased photocatalytic activities in this study [76].Hence, the combination of AgNPs and TiO2reduces the charge transfer resis-tance and increases the photo charge separation efficiency, enhancing the photocatalytic activity.
From Fig.7 derived the mechanism of·OH, h+,·O2-, and e-could be lead to an important active species of the MB photocatalytic degradation.The MB degradation mechanism approximately below:
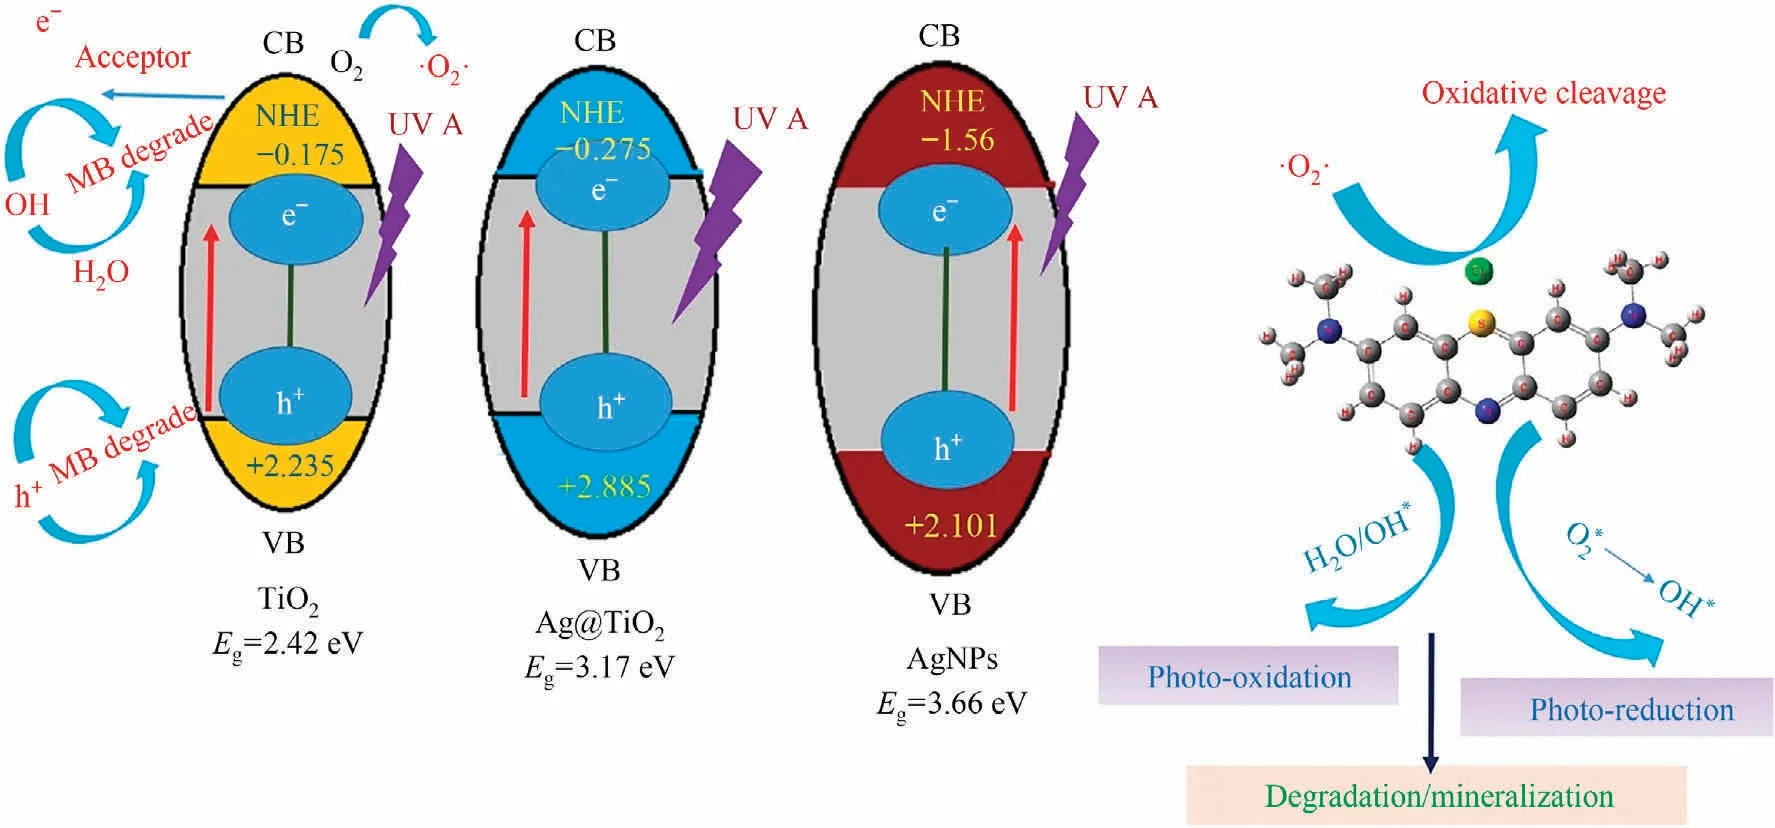
Fig.7.Mechanism of photocatalytic degradation.
3.5.Interaction of catalyst of MB removal and DFT evaluation
From this study, we evaluated the several DFT parameters, like as NBO analysis, HOMO, LUMO, electronegativity, energy band gap,chemical potential, global hardness, global softness (S), dipole moment, polarizability, electrostatic potential, V(r) global electrophilicity index (ω), and total energy (Hartree).The results are given in Table 3.Electrostatic potential, global electrophilicity index, global softness, and total energy are higher in Ag@TiO2, this parameters influences the molecular cleavage or adsorption.In generally, the NBO has been carried out to calculate the intermolecular inaction of donor-acceptor.Basically, charge transfer potential when MB and catalysts able to degradation or adsorption condition.The NBO analysis depicted the delocalization of the electron density,n →σ*and σ →σ*transitions which has been given in Table S3, for MB molecules.It is referred to hyperconjugation effect for intermolecular or intramolecular interaction.Therefore,hyperconjugation electrons are obtained in MB at C-C, which effects to electron transfer antibonding bond pair.On the other hand, energy band gap, (εband) showed higher as Ag@TiO2>TiO2>AgNPs, and the hyperconjugation from C-C-, or C-N- sites showing higher in Ag@TiO2, owing to band gaps and its electrostatic potential.This band gaps are slightly change on theoretical aspect due to the inherent defect on B3LYP as in the calculations.
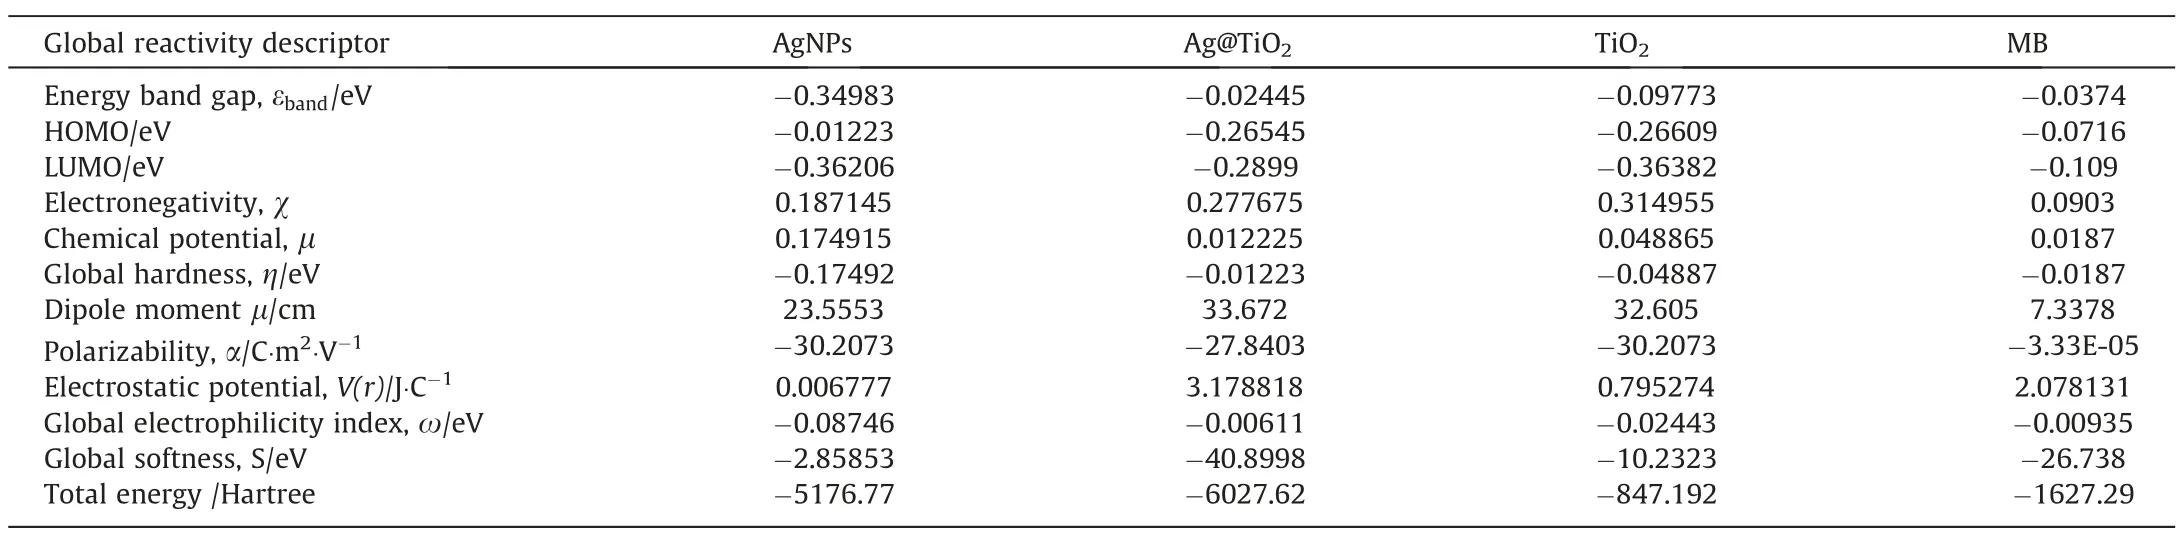
Table 3 DFT parameter of catalysts with MB
When MB adsorption, complexity of catalysts are observed in Figs.S6-S8, and calculative HOMO-LUMO, with other parameters.Where the electrostatic potential, V(r) global electrophilicity index(ω), and total energy (Hartree) showed higher in Ag@TiO2, due to complexity of the MB molecules are maximum interference than AgNPs and TiO2, comparatively electron transfer (σ → σ*) as AgNPs < TiO2< Ag@TiO2.The molecules stability of depends on their dipole moment values, due to polarizability can ensure the electron transfer to hole.Fig.S5 depicts the catalyst’s structure and makes the crystalline surface plainly visible.During the adsorption process, it was found the intramolecular complexation,which is shown in Figs.S6-S8.Where the complexity is expressed as complexity-I, complexity-II, and complexity-III in accordance with the theoretical underpinnings.Thus, complex-III may play a major role in surface adsorption through higher-energy ‘‘hardsoft” interactions due to electrostatics properties.The DFT data has been given in Table S4.Total energy, polarizability, chemical potential, and electronegativity are comparatively higher in complexity-III, due to molecular density higher than Ag@TiO2which more effective on adsorption with MB.
3.6.Density of states and Fukui function
The DOS is revealed in Fig.8(a) for TiO2, which shows in Fermi level energy.The valance band is dominated with 2p for O atom and attach by 3d orbital of Ti atom.The conduct bands also 3d orbital of Ti atom and slightly of 2p of O atom.In this context,the DOS conforming that the semiconducting agent is TiO2and calculative band gaps is 3.09 eV.Similarly, Fig.8(b), expended the band gaps for silver nanoparticle is 5.37 eV.The Ag@TiO2observed form Fig.8(c), obtaining bands as virtual, and occupied of DOS.The bands are overlapped with alpha and beta, due to energy level of 3d Ti and 3d of Ag, and also attributes the fermi level of band energy, which is exhibited in 4.27 eV.Therefore, the calculative results support their band gaps energy corresponding as AgNPs >Ag@TiO2>TiO2.On the other hand, DOS for MB has been shown in Fig.8(d),and band energy is 0.561 eV.The structural and HOMO-LUMO has been given in Fig.8(e)-(f).The DFT calculation showed complexity during adsorption process, Fig.S9 showed the DOS values and occurring band gaps gradually decreasing due to binding energy gets saturation, which has overcome energy gaps.The DOS showed the complexity and cleavage site, the band gap energy decreased when MB cleavage, that conforming to MB electron transfer getting higher.The complexity when adsorption for all catalysts obtaining tendency refers to negatively charged of MB by deprotonation phenomena, O (-0.2934 eV) and C(-0.1336 eV)atom interference with Ag and Ti,and C.The positive interface of MB with C attributes to negative of catalysts for O atom.Hence, this is conformed to catalyst has affinity to removal with adsorption process.The elimination process can be prolonged when light/UV affects because of the photocatalytic effect.The Fukui function may indeed recognise the orientation cleavage of MB.Forecasts for the degradation pathways are shown in Fig.9,and Table S5 includes the Fukui index.In the molecules of MB,the Fukui function (f0) values are N1, S4, C6, N8, O12, C20, S22,and O24 have been observed to be larger than other existing unstable atom.At first, C2 and C3 shows large f0(0.0411, 0.0784), suggests that very unstable and easily formation of MB3 (m/z of 319), conforming the e-donor of C2, and C3 is acceptor (Sk-=-5.0401, and 2.2246 eV).On the other hand, MB4 (m/z of 135)observe in N8 and C9(f0=0.0471 and 0.0596)reaction occur in oxidation using ROS.On MB5 (m/z of 230) gets C-C cleavage of C13(f0= 0.0795) and C14 (f0= 0.0417) where directly attract by-O2and·OH as hydroxylation.The translocate atoms are found in MB6 influencing by oxidation interfaces.According to cleavage of intermediating molecules shows higher f0(0.0398, and 0.0294),C16 and N15 directly nucleophilic attacked with O2-and OH, producing hydroxylation (-NH2) as MB6 (m/z of 175).The cleavage of MB into C19 and C20, where f0(0.0289 and 0.0293) directly attracted,producing MB7(m/z of 165).Finally,all the intermediate products above has to break down into smaller molecules or mineralized to CO2and H2O with ROS attacked [39].
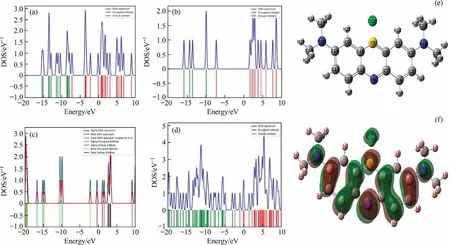
Fig.8.(a) DOS of TiO2, (b) DOS of AgNPs (c) DOS of Ag@TiO2, (d) DOS of MB, (e) MB structure, and (f) HOMO-LUMO of MB.

Fig.9.Probable reaction steps of MB photocatalytic degradation.
4.Conclusions
Current research silver promoted titania was synthesized using a stepwise sol-gel method.The materials were characterized through SEM, XRD, EDS, FTIR, etc.The material has been applied to photocatalytic and adsorption process.The results showed, the positive value of enthalpy (ΔH°) according to increasing temperature, and reactions are endothermic where observation enthalpy as Ag@TiO2(126.80 kJ·mol-1) < AgNPs (354.47 kJ·mol-1) < TiO2(430.04 kJ·mol-1).The TiO2and Ag@TiO2catalysts influenced the higher catalytic degradation by superoxide radical anion, and the AgNPs takes an equal role to hydroxyl radicals, superoxide radical,and hole h+scavenger.On the other hand, the oxidation potential of ECBshowed corresponding as TiO2(-0.175 eV) < Ag@TiO2(-0.275 eV) <AgNPs (-1.56 eV) and obtaining the higher redox potentials of O2/O2-pair is AgNPs (>-0.33 eV vs.NHE).The higher rate achieved for TiO2anatase, AgNPs and Ag@TiO2as 3.44 × 10⁻³, 5.40 × 10⁻³and 5.73 × 10⁻³, respectively.This research has been investigated with DFT study, where fukui functions are denoted the nucleophilic attack, electrophilic attack, and radical attack.The molecules cleavage of intermediating molecules shows C16 and N15 which directly nucleophilic attacked with O2-and OH, producing hydroxylation (-NH2).After adsorption, it was theoretically divided into three complexity levels:complexity-I, complexity-II, and complexity-III.Complexity-III has a higher molecular density than Ag@TiO2,which makes it more effective at adsorbing MB, and as a result, has higher total energy,polarizability, chemical potential, and electronegativity.The MB degradation-adsorption by photocatalysts is the excellent step,and Ag@TiO2removes more MB than the previous two.The use of this catalyst for industrial purposes may be advantageous.
Data Availability
Data will be made available on request.
Declaration of Competing Interest
The authors declare that they have no known competing financial interests or personal relationships that could have appeared to influence the work reported in this paper.
Acknowledgements
The authors would like to thank University of Burdwan was for instrumental and financial support from DST-FIST (SR/FST/ESI-141/2015, dt: 30.09.2019), Govt.of India and WBDST-BOOST (39/WBBDC/1p-2/2013, dt: 25.03.2015), Govt.of West Bengal.
Supplementary Material
Supplementary material to this article can be found online at https://doi.org/10.1016/j.cjche.2023.06.014.
杂志排行

Chinese Journal of Chemical Engineering的其它文章
- Intrinsic kinetics of catalytic hydrogenation of 2-nitro-4-acetylamino anisole to 2-amino-4-acetylamino anisole over Raney nickel catalyst
- Experiments and model development of p-nitrochlorobenzene and naphthalene purification in a continuous tower melting crystallizer
- α-Synuclein: A fusion chaperone significantly boosting the enzymatic performance of PET hydrolase
- Influence of water vapor on the separation of volatile organic compound/nitrogen mixture by polydimethylsiloxane membrane
- Mass transfer mechanism and relationship of gas-liquid annular flow in a microfluidic cross-junction device
- Comparative analysis on gas-solid drag models in MFIX-DEM simulations of bubbling fluidized bed