Simulation of the secondary air system of turbofan engines: Insights from 1D-3D modeling
2023-02-09XuesenYANGMenghuJIANWeiDONGQinnnXU
Xuesen YANG, Menghu JIAN, Wei DONG,*, Qinnn XU
a School of Mechanical Engineering, Shanghai Jiao Tong University, Shanghai 200240, China
b Sichuan Gas Turbine Establishment, Aero Engine Corporation of China, Chengdu 610500, China
KEYWORDS Blade cooling;Multi-fidelity;Preswirl system;Secondary air system;Turbofan engine
Abstract Focusing on the internal flow and heat transfer analysis,a platform for the performance evaluation of the Secondary Air System(SAS)is developed.A multi-fidelity modeling technique has been developed in a turbofan engine model under different flight conditions. A turbine blade cooling model which integrates external heat transfer calculations and coolant side modeling with common components is proposed. In addition, the Computational Fluid Dynamics (CFD) method is selected to capture the complex flow field structure in the preswirl system. The validity of the SAS models is compared with publicly available data. An elaborately designed cooling system for the AGTF30 engine is analyzed through three main branches.It is found that the 1D-3D modeling technique can provide more accurate predictions of the SAS for the AGTF30 engine. The results demonstrate the versatility and flexibility of the SAS models,thereby indicating the capacity of meeting most of the demands of flow and thermal analysis of the SAS.
1. Introduction
The Secondary Air System (SAS) is of considerable importance in complying with life requirements by supplying cooling air to the high-temperature sections in the operation of a turbofan engine run.However,the coolant flows have an adverse impact on the overall performance of the whole engine1-2.It is highly important to minimize the coolant flow rate with the help of a generic, fast and credible simulation platform. The CFD analysis of the SAS is not viable for reducing design procedure time. Nevertheless, the CFD reveals detailed flow features that are the key to the traditional modeling of the internal flow systems.

In the past decades,the SAS has been widely investigated in the field of gas turbines. The approach adopted to represent the SAS by the mainstream is establishing a schematic network with various flow components3, in each of which the temperature, velocity, pressure loss, and rotating effects have to be considered. The flow components are linked together with nodes,characterized by pressure,temperature,and swirl ratio.The cooling air is normally extracted from the compressor bleed ports and returned to the labyrinth seals,to the film cooling holes, or to the rim cavities. Kutz and Speer4described a flow network algorithm for the simulation of SASs and demonstrated the validity by comparison with test results. At the initial developing stage, the flow network algorithm has a deficiency in implementing efficient iterative procedures. In 1996,Ebenhoch and Speer5presented a special path following method, making the design of the cooling system more efficient. Alexiou and Mathioudakis3developed an objectoriented simulation environment that allows the establishment of the SAS by modeling the bleed flow path from the compressor bleed ports to the high-temperature sections. Brack and Muller6performed a probabilistic analysis on the SAS of a three-stage low-pressure turbine to account for the uncertainty in engine performance resulting from tolerance and operational conditions. Nikolaidis et al.7presented a modeling approach for typical flow components including rotating cavities,pipes,labyrinth seals, orifices,and turbine blade cooling;however,their models are based on lumped parameter method.Luo et al.8proposed a new flow pattern parameter for the rotor-stator systems, which indicates a prospective solution in determining the heat transfer performance in the cavity.Quan et al.9adopted a novel heat transfer coefficient measurement technique to obtain the flow parameters of enginerepresentative multi-stage compressor cavities, which is useful for verifying the existing correlations.
In recent years, there have been significant efforts to apply the CFD technique for enhancing the 1D flow network model. Carcasci et al.10integrated a blade/vane cooling system calculation featured by 3D thermal finite element analysis in a compressor performance calculation and presented a strong interaction between the main flow path and the cooling air network system. Benra et al.11used a 3D CFD technique to calibrate the 1D preswirl system model and the enhanced 1D network model reveals that the prediction accuracy of the pressure,temperature,and swirl ratio distributions is much improved. Wang et al.12coupled the 1D network method and the CFD method to balance time cost and accuracy in the simulation of SASs. Wu et al.13applied a 1D-3D coupling method to simulate a SAS whereby a 3D code was used to model the nonstandard components, and a 1D code was used to model standard components. Muller14coupled a 1D network representation of a general low-pressure turbine with the free finite element software CalculiX aiming at implementing SAS, thermal and mechanical analysis. Wu and San Andre´s15modified the Blasius friction factor model for rotor and stator by investigating the impacts of geometry and operating conditions on labyrinth seals based on CFD predictions.
Since most studies performed 3D numerical investigations in a rotor-stator cavity without key features such as guide vanes and rotating blade for simplification16, a novelty of the present paper is the integration of 1D turbine blade cooling,which incorporates external heat transfer calculations and coolant side modeling with common components. The 1D-3D coupling modeling technique is proposed, followed by a validation of the crucial components, and an extensive study on the designed SAS of an advanced geared turbofan engine was conducted. The simulation cases consist of steady-state off-design calculations of a typical flight mission which is divided into different flight segments based on the altitude and Mach number configuration17.The multi-fidelity coupling simulation method is used to evaluate the cooling effect and find the performance characteristics of the SAS over the entire operating envelope.
2. Model setup and boundary conditions
The described platform is implemented with MATLAB and applied in a modular fashion to analyze the engine performance. As a case study, the present study was carried out on the advanced geared turbofan engine 30000 (AGTF30)18developed by the NASA Glenn Research Center. The AGTF30 engine is a conceptual 30000 lbf (1 lbf = 4.448 N)thrust class engine containing high-pressure, low-pressure,and fan shafts. A gearbox connects the fan shaft and lowpressure shaft with a 3.1 to 1 gear ratio.
2.1. Model setup
Inspired by the CFM56 engine, the SAS is used for turbine blade cooling, high-pressure compressor cavity ventilation,and turbine rim seal. As shown in Fig. 119, these functions are modeled through three branches: Branch 1 (high-pressure turbine blade cooling), Branch 2 (high-pressure compressor cavity ventilation), and Branch 3 (turbine rim seal). The turbine blade cooling is modeled to study the evolution of the preswirl efficiency of the cover-plate preswirl system under various flight conditions. Ventilation air is modeled to test the characteristics of compressor cavities in series.
Since the heat transfer in the SAS depends on the corresponding geometry, their dimensions should be determined from the best judgment of the AGTF30 engine.The geometric shapes of the SAS are developed from the cross-sectional view of the CFM56 engine.Since engines are normally derived from scaled common designs, the geometric dimensioning is scaled based on the level of bleed air mass flow.A diagram representing the AGTF30 model with the SAS is shown in Fig. 2.Because of the difficulty in accurately computing the temperature reduction and pressure loss in the preswirl system, we choose commercial Fluent code as the solver while the turbine blade cooling adopts the analytical mode.17The compressor cavities are often rotationally symmetric, which reduces the difficulty in predicting the flow and heat transfer characteristics based on empirical formulas. An obvious advantage of combining 1D-3D method in SAS calculation is that computation load reduction and accuracy improvement can be well balanced. The HPC rotor shaft has a total of 10 rotating orifices with a diameter of 25 mm equally machined at the rear to allow booster air to pass for internal ventilation.The HPT rear shaft also has 8 holes providing passages for booster discharge bleed air to cool the LPT.The leakage flow rate is simulated by a rim seal model.
2.2. Test definition
An assumed flight mission for the AGTF30 engine includes taxi-out, take-off, climb-out, climb, cruise, descent, approach,and landing, as shown in Table 1. Besides altitude and Mach number, Power Lever Angle (PLA) is another parameter to fully determine the state of engine. The thrust of the AGTF30 engine is designed to be correlated linearly with PLA. In the present study, the fan corrected speed is selected as the engine control parameter.

Fig. 1 Schematic of CFM56 engine and its SAS.19

Fig. 2 Coupling model for AGTF30 engine and designed SAS.

Table 1 Selected operating conditions and demanded fan corrected speed.
The framework of T-MATS20was used to model the thermodynamics of the AGTF30 engine at the required offdesign point subsequently. According to the original framework, the influence of the SAS is considered in specific stations of bleeding and blending processes, which is a ‘‘black box” to the engine performance model21. In a traditional engine performance model, the SAS is simulated by extracting a constant mass fraction of air from the compressor and returning it to the turbine. An improvement of the present study is the replacement of the ‘‘black box” with a physicsbased simulation model of the SAS. Based on cycle calculation, the primary air parameters at the bleed and exit ports are known, namely, the boundary conditions of the SAS.The coupling simulation is based on the following assumption:(1) The distribution of the compressor temperature field is retrieved by interpolation based on the variation regularity of that for the CFM56 engine, and the wall temperature of each stage disk is held constant during the computation of the coolant flow.
(2) The uniform turbine blade surface temperature is determined using the turbine blade cooling model with selected values of the external blade surface heat transfer coefficients and film cooling effectiveness in engine-like conditions.
(3) The total pressure recovery coefficient and combustion efficiency of the combustor remain unchanged.
3. Methodology
The 1D-3D models are used for the simulation of the SAS.The 3D model is only applied to the preswirl system while 1D components in the flow network are categorized into compressor cavities, rim seals, rotating orifices, and turbine blade cooling.Validation of the involved components and coupling strategies for 1D-3D interaction problems are also addressed.
3.1. Modeling of SAS models
This section presents the modeling techniques of the SAS components, and their integration into a complete flow network has been shown in Fig. 2.
3.1.1. Modeling of preswirl system
In the high-efficiency AGTF30 engine, the cooling air extracted from the High Pressure (HP) compressor is introduced through the stationary preswirl nozzles and reaches toward the blade feed holes of the HP turbine disk. The total temperature of the cooling air relative to the rotor disk decreases after being accelerated in the direction of the rotation.22Fig. 3(a)23illustrates a general schematic of a coverplate preswirl system, among which the preswirl cavity is connected with the cover-plate cavity through receiver holes.Fig. 3(b)24shows the 2D schematic diagram and geometric parameters. In this figure, the purple lines represent the stationary surfaces, the green lines mean the rotating surfaces,and the shaded region denotes the turbine disk.
A total of 36 nozzles are equally spaced on the circumference of the stator and inclined with the stator surface at an angle of 30°. An initial swirl is introduced into the preswirl cavity when the cooling air expands in the nozzles. Then, the coolant flow enters the preswirl cavity, which connects the rotor and stator. The cover-plate cavity bounded by the high-pressure turbine disk and its adjacent structure is equipped with 36 circular receiving holes with a diameter of 7.5 mm. The preswirled air is finally introduced into the blade feed holes at a radius of 180 mm.
The preswirl ratio βpsnis given as

where ˙mcis the coolant mass flow;rbmeans the radial location of the blade feed holes; Vφ,bis the flow tangential velocity at the blade feed holes; q represents the total heat flux.

Fig. 3 Equivalent modeling process of a cover-plate preswirl system.
A 10° sector CFD model is selected to research the performance of the preswirl system. Air ideal gas model is adopted.The total pressure and total temperature are specified at the inlet. At the outlet, only static pressure is given. A hexahedral structured grid is generated using ANSYS ICEM. Typical y+distributions,15 <y+<300,are within the required range for the standard k-ε model with wall function adopted below.Grid independence was carried out to determine the best mesh numbers for the preswirl system simulations. The solution with acceptable accuracy for the total temperature reduction was achieved as the total mesh number becomes about 1.1 million.As indicated in Fig. 4, the disk radial temperature (Td) distribution is determined from the blade metal temperature Tb,assuming the rate of radial conduction Qcondthrough the blade root to obtain the temperature at the disk tip. Since a contact resistance between the blade and disk is not ignorable,a gap in temperature could appear.A correction coefficient f is selected to describe this kind of discontinuity such as Td(rb) = f·Tb,and a sensitivity analysis is performed to calculate the effects of contact resistance on the heat transfer rate.
3.1.2. Modeling of compressor cavity
The axial compressors of the AGTF30 engine have multiple stages to achieve high compression ratios. The compressed air temperature in the aft stages of the HP compressor tends to be very high. The thermal growth of HP compressor disks relative to their corresponding outer casing significantly influences the blade tip clearances.28This calls for ventilation cooling of the aft rotor disks.The compressor cavities are bounded by the air duct on the inside and the inner drum on the outside.LPC discharge air has a lower temperature and is suitable for ventilation cooling.
Here we developed a method to account for the modeling of a general compressor cavity (Fig. 5), which is treated as an axisymmetric geometry and is divided into multiple control volumes to capture accurate variations in the flow properties along the radius. Previous research has revealed that the flow and heat transfer in a rotating cavity depend on two nondimensional parameters: dimensionless secondary air mass flow and rotational Reynolds number, respectively expressed as


Fig. 4 Adopted mesh details.

where μ denotes the dynamic viscosity; ρ represents the density; b is the outer radius of the compressor cavity.
Knowledge of the heat transfer in compressor cavities is crucial for the analysis of disk stress and life estimates.The change in air temperature occurs as a result of heat and work transferred from the disks. Certain correlations that allow for heat transfer are included in the model. The amount of convection heat between disk surfaces and coolant air can be expressed as

where Adis the effective disk surface area, and hdis the heat transfer coefficient on the disk.
For calculating Qconvfrom each wall of the compressor cavity, we also need to know wall temperature Tw, and adiabatic wall temperature Tawwhich is known as the air reference temperature. Owen and Tang29suggested the following equation to calculate the reference temperature:

where Rexis the axial Reynolds number, and Grφis the modified Grashof number.The application range of the above correlation is: 0.1 <s/b <0.4, 0.2 <a/b <0.5, 2 × 10⁵<Reφ<5 × 10⁶, 0.01 <b2Rex/(2a2Reφ) <1.
The relevant nondimensional geometrical parameters for the designed compressor cavities are s/b = 0.23 and a/b = 0.45, which are within the scope of application of Eq. (9). The rotating Reynolds number Reφencountered in the simulation ranges from 2.66 × 10⁶to 2.93 × 10⁶, and the Rossby number b2Rex/(2a2Reφ)is also in the scope of application range. Therefore, Eq. (9) is adopted to compute the heat transfer coefficients on the vertical surfaces.The Nusselt number correlations for horizontal cylinders rotating in the air are often obtained with correlations such as Nu=c1Rec2(c1and c2being constants whose values vary from different authors).It is believed that the following correlation has a maximum uncertainty lower than ± 5% on the considered domain.31

The change in the swirl is calculated based on momentum balance. Rotor torques participate in the torque-angular momentum balance. We use the following equation to compute the angular velocity of the coolant flow at the outlet of the ith control volume:


Fig. 5 Schematic of a general compressor cavity.
where subscripts ‘‘i” represents the ith control volume; ω means the angular speed of fluid, and subscripts ‘‘in” and‘‘out” denote the inlet or outlet of the ith control volume,respectively. The outlet rotational speed is determined by the bulk density ρ(i), the bulk radius r(i), the disk area Ad(i), the inlet radius rin, and the outlet radius rout. The moment coefficient CM(i)is defined as

in which μ(i)represents the bulk dynamic viscosity.
The correlation of friction coefficient has been demonstrated to be less than ± 15% variation with respect to CFD predictions.32
3.1.3. Modeling of rim seal
Fig. 6(a) shows a radial-overlapping rim seal exposed to the mainstream flow34A stator rim forms a radial clearance with the facing rotor axial protrusion.35A large number of hot gases could ingest into the wheel-space that separates the HP turbine vanes and blades, leading to higher temperatures near the hub and blade disk. To avoid this case, the wheel-space between the rotating disk and the adjacent stationary casing is conducted into a sufficient amount of cooling air to maintain a positive leakage flow back into the mainstream flow path.Eventually,the air is discharged at the turbine rim seals.Given the complexity of the geometries, a double seal configuration exemplifies typical turbine rim seals, as shown in Fig. 6(b).In this figure, Cris the clearance, Lris the radial distance, Ltis the tooth thickness, and bris the outer radius of the rim cavity.
To assess the performance of a double staggered seal,Martin’s formula is used for the computation of the flow rate.Although this model is not very accurate, it forms the basis for the following improved models.36

where γ is the specific heat ratio.

Fig. 6 Equivalent modeling process of a rim seal.
3.1.4. Modeling of rotating orifice
This component is used to simulate the secondary flow through orifices and various holes located on disks, drums,and shaft surfaces.39The cooling air passing through stationary or rotating orifices can be regulated to the right amount at the appropriate level of pressure and temperature. These configurations cause most of the total pressure losses and dominate the flow distribution.Knowledge of the discharge behavior of orifices is indispensable for determining the minimum amount of cooling air.Furthermore, the discharge coefficients have to be known for the entire range of operating conditions,especially for the rotating orifices, as their discharge behavior could vary strongly.
The mass flow of a rotating orifice depends upon the flow coefficient or loss coefficient for given geometric parameters(e.g.,diameter,length,inclination angle)and boundary conditions.Note that either the flow coefficient or the loss coefficient is computed using empirical correlations. The mass flow rate across an orifice can be described as40

where Aeis the effective flow area of the orifice;the estimation of Cd(orifice)considers the rotational effects, incidence effects,Reynolds number effects, long orifice effects, etc.
There is a good agreement between the predictions given by the correlations adopted in the present study with a maximum percentage difference of ± 8%. The modeling of the rotating orifice allows the addition of new corrections when these corrections are available since the validity of Eq. (21) heavily depends on the accuracy of the orifice discharge coefficient.Although the correlations are derived from rotating orifices,they are also valid for the nonrotating receiver holes since the flows are similar in principle.
3.1.5. Modeling of turbine blade cooling
In the turbine blade cooling model,we propose a model which allows for heat-flow coupling calculation.The complex hollow geometry of turbine blades is handled with cooling passages and holes. Initially, the process in the cooling passage is regarded as adiabatic, and pipe components are utilized to compute the coolant mass flow.The coolant air not only flows along the cooling passages but also enters the mainstream flow path through the film holes machined on the blades. The restricting effect through the passage and hole is the same as the pipe and rotating orifice analyzed in the previous section.The next step is to take the heat transfer model of turbine blade cooling into consideration, thereby obtaining the evaluated turbine blade temperature. Accordingly, the above process is repeated, but with the replacement of adiabatic boundary conditions by the newly calculated turbine blade temperature. An iteration process is employed until the residual converges to a specific threshold value.
For the thermal effects, a classic blade cooling model is adopted for the preliminary analysis.41The relationship between coolant mass flow ˙mcand convection cooling effectiveness εccan be given as

where Tgrepresents the turbine inlet temperature, which can be extracted from cycle calculation; Tc,inis the known coolant temperature obtained from the preswirl system simulation;Tc,outis the coolant outlet temperature; the film temperature Tfis defined as the temperature after the coolant flow mixes with fluids in the boundary layer.
The cooling flow factor Kcis calculated as44

where Agis the external blade surface area; Athis the crosssectional area at the blade throat; cp,gis the constant pressure specific heat of the hot gas;cp,cis the constant pressure specific heat of the cooling flow;the external flow Stanton number Stgis defined as45
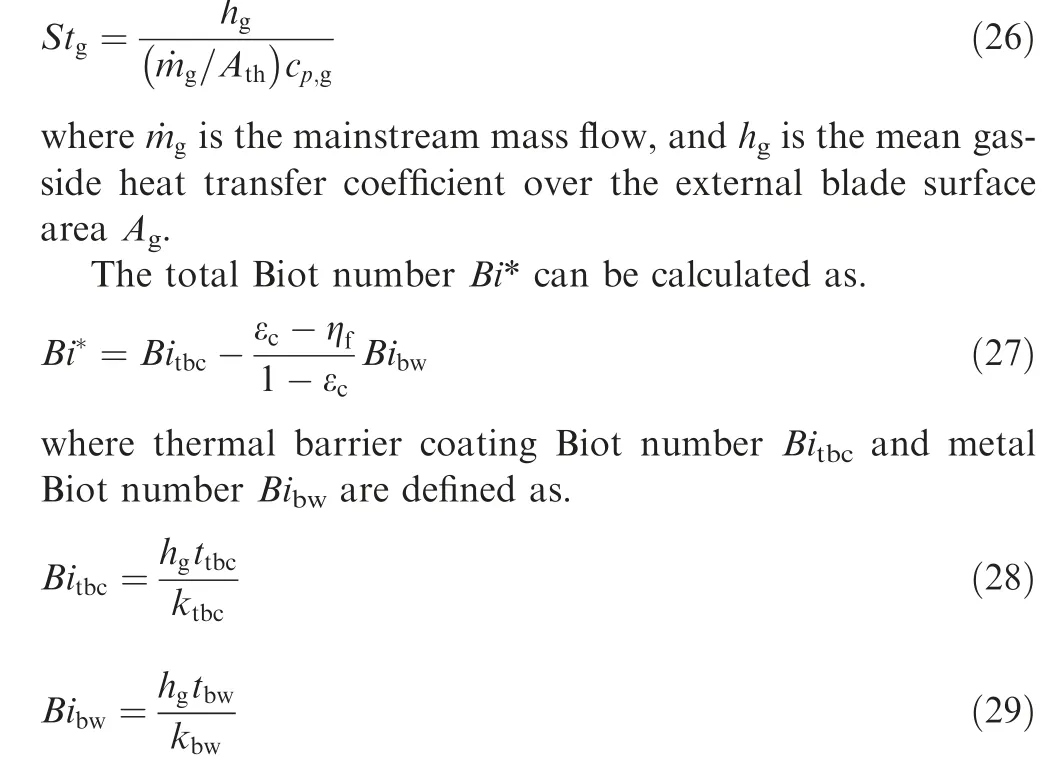
in which t is the thickness and k is the thermal conductivity of the thermal barrier coating or the metal.
Given the temperature of the blade wall, the convection cooling effectiveness can be written as.

3.2. Validation of SAS models
In this section, crucial components are tested against publicly available data to demonstrate the validity of the modeling approach.
3.2.1. Validation of preswirl system model
Experimental data from other test rigs47were used to validate the cover-plate preswirl system model by comparison with 3D steady-state results and experiments. The rotor has an outer radius of 216 mm, an inner radius of 145 mm, and 60 circular receiver holes drilled at an angle of 90°to the tangential direction and at a disk radius of 200 mm.These holes have a length of 10 mm and a diameter of 8 mm, with a length to diameter ratio of 1.25. The gap between the rotor and the stator is 11 mm.A clearance of 1 mm is identified between the rotating and stationary shrouds. The preswirl nozzles comprise 24 circular holes of 7.1 mm diameter drilled at a disk radius of 160 mm and at an angle of 20° to the tangential direction.The standard k-ε model, Renormalization Group (RNG) k-ε model, realizable k-ε model, and Shear Stress Transport(SST) k-ω model are selected for simulation. Fig. 7 shows the comparison between the present work and the experimental results (λTrepresents the turbulent flow parameter and is defined as CwRe-0.8φ ).The predictions are in line with the experimental data in the core-swirl region but some deviations are observed for r/rb>0.926.This suggests that the losses related to the jet mixing at a higher radius are not predicted well.The inlet and outlet swirl ratios show fairly good agreement with the experimental results.
3.2.2. Validation of rotating cavity model
The computational configuration is adopted from Ref.16,which investigates the heat transfer and the swirl distribution in a rotating cavity. An isothermal boundary condition is assigned to the rotor disk surfaces,while adiabatic conditions are applied to the stator disk. The comparison of fully coupled 3D results and the 1D predicted values for the swirl ratio at radial locations r=50,90, 130, 180 mm is plotted in Fig. 8(x is axial coordinate and L denotes axial gap between rotor and stator disks). It indicates that the predicted swirl ratio in the core region presents the best agreement with the correlation.
3.3. Coupling strategies
Different from traditional engine performance codes, the level of bleed air mass flow is determined by the enhanced flow network method, as shown in Fig. 9. The overall engine performance and the SAS accept the component method and network method, respectively. Both models employ initial given values to proceed with the iterative process, but the initial given values and selection mechanisms differ from each other. The component method uses the performance parameters of each component as the initial values, calculating the residuals of cooperative working equations48satisfied by the whole engine with the selected engine control law. The SAS network method checks the residuals of the mass flow rate through the nodes by trying to correct the initial node pressure. The first evaluation of mass fractions of cooling air should be given after the operating conditions are set. To do so, a cycle calculation is started.

Fig.7 Comparison of data between Ref.47 and present work for swirl ratio when Reφ is 7.8 × 10⁵.

Fig. 8 Axial distributions of swirl ratio at different radial positions.

Fig. 9 Flowchart of 1D-3D coupling strategies applied to present study.
The simulation of the SAS requires the inlet, outlet and thermal boundary conditions provided by performance models. Meanwhile, the engine performance code also needs the returning flow parameters.The cooling air inlet boundary conditions can be extracted after the HPC calculation is completed. The MATLAB S-Function feature is used to build 1D-CFD coupling methodology. The boundary conditions are transferred between 1D models and 3D models.It is noted that total temperature and total pressure are mass averaged on the boundaries to be transferred to the fluid interface.For data transferred from 1D models to the fluid interface, the mass flow rate is uniform on each cell, while the temperature and pressure remain the same for every cell face.
4. Results and discussion
The scenarios defined in Fig. 2 have been simulated. Because temperature rise and pressure drop in the SAS are inevitable,the mixing of cooling air streams and main flow at hot engine components has influence on the turbine power output. In order to accurately evaluate the engine performance loss and whether the preliminary design of the SAS is reasonable, the detailed computational results of the SAS characteristics,such as preswirl efficiency,discharge coefficient,and swirl ratio distributions, are presented in this section. Finally, the effect of the uncertainty of contact resistance on the preswirl system performance is evaluated and presented.

Fig. 10 Fractional cooling air flow rate.
4.1. Engine performance results
Fig. 10 shows the effect of various flight conditions on the mass fractions of cooling air.The numbers in Fig.10 represent the values of total mass fractions of cooling air. Under the cruise condition, the effective fractional cooling air flow rates for the three branches are 8.75%, 3.34% and 5.19%, respectively. Results have shown that the preswirl system consumes the most bleed air. For a typical SAS design, it is reasonable to find that more than half of the total bleed air is used for blade and vane cooling. Although different flight conditions of the AGTF30 engine cause significant variation in the mass flow rates of cooling air (e.g., a minimum of 1.31 kg/s under the cruise condition and a maximum of 2.98 kg/s under the take-off condition), the fractional cooling air flow rates undergo a little change. The total mass fraction of cooling air continuously increases, starting from the aircraft taxiing out, and reaches its maximum value of 17.29% under the take-off condition. Under the climb-out condition, both the fuel consumption and the total bleed air flow rate drop as the aircraft needs a lower load.In further,the total mass fraction of cooling air continuously decreases to 16.96% from the cruise condition to the landing condition.
4.2. Turbine blade cooling branch results


Fig. 11 Relationship between preswirl ratio and Vφ,psn/Ω.

Fig. 12 Distribution of swirl ratio under cruise condition.

Fig. 13 Preswirl efficiency of preswirl system.
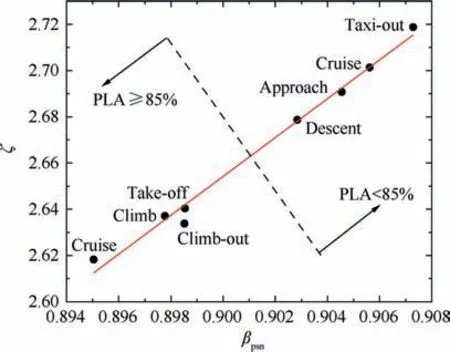
Fig. 14 Loss coefficient of preswirl system.
Fig.13 shows the variation of the preswirl efficiency for different flight conditions depending on the preswirl ratio. Since the preswirl efficiency has a linear relation with the preswirl ratio,49the preswirl efficiency increases with an increased preswirl ratio.As shown in Fig.14,the trend of loss coefficient is in good agreement with a line starting under the cruise condition and ending under the taxi-out condition. The progress of the curve shows a predominant effect of βpsnon the calculated pressure losses.Nondimensional loss coefficient increases with a rising preswirl ratio, and the main reason lies in the higher friction caused by the relative velocity between the fluid and the wall in the preswirl nozzle and in the preswirl cavity. As expected,the preswirl efficiency and loss coefficient are in contradictory relations with each other, and a larger pressure loss seems to be inevitable to gain a high efficiency of the preswirl cooling system. The airflow extracted from the compressor loses its total pressure across the preswirl system but also gains it through rotor work from the rotating disks in contact.Appropriate pressure should be ensured to avoid the hot gas ingression into the cavity through film holes.
As the cooling air will be heated by the heat transfer from the rotor disk surfaces before reaching the blade root,its total temperature relative to the rotor increases, as presented in Fig. 15(T*relis the relative total temperature of the cooling air in the rotating reference frame). The effective range in the figure represents the variation region of the relative total temperature ratio and the corresponding reference line is drawn according to the mean values of relative total temperature ratio at every position. It is seen in Fig. 15 that the flight conditions do not affect much the relative total temperature ratio before the blade cooling rim slot. Note that the relative total temperature ratio is obtained based on mass-averaged total temperature. The coolant air enters the receiver holes in the cover-plate cavity with little change in absolute total temperature after being preswirled to the rotor angular velocity. As a result, there is little engine performance loss but a simultaneous reduction in the relative total temperature of the cooling air.It is common for the turbine disks to be purged with coolant flow, which finally reaches the blade root. A remarkable relative total temperature rise is found in the cover-plate cavity,owing to the heat and rotor work transferred from the disk surfaces.

Fig. 15 Distribution of relative total temperature ratio.
The total power consumption against the preswirl ratio is plotted in Fig. 16. As expected, the preswirl system consumes the least amount of turbine power under the taxi-out condition. The maximum turbine inlet temperature usually occurs under the take-off condition, hence the preswirl system would consume the largest level of turbine power to protect the turbine blades from overheat. The consumed turbine power decreases under the climb and cruise conditions because the aircraft needs a lower load. The distribution of the values of total power consumption in Fig.16 seems to be without rhyme or reason,but actually,they could be fitted with two lines.Line 1 connects take-off condition to cruise condition while the other line represents the flight conditions with PLA <85%.Eq. (4) indicates that increasing the preswirl nozzle radial radius rpsnwould be a feasible way to reduce the total power consumption.

Fig. 16 Total power consumption of preswirl system.

Fig. 17 Blade metal temperature.
As shown in Fig. 17, Tbincreases sharply from 755.6 K to 1213.1 K when the aircraft requires the maximum thrust under the take-off condition. The maximum blade temperature also occurs under the take-off condition; the blade temperature drops under the cruise condition.The corresponding variation of the HP disk radial temperature Tdis addressed in Fig.18.It is found that Tddrops gradually downstream the receiver holes due to a large recirculation zone (see Fig. 12) where the flow tends to be uniform along the direction of radius. In general,there is a remarkable variation in the disk radial temperature distribution in the range of r >rrh. Cubic equations can describe perfectly well the disk radial temperature distribution.
4.3. Ventilation branch results
Variation of the swirl ratio against the rotating Reynolds number is plotted in Fig.19.The rotational Reynolds number varies from 2.66 × 10⁶to 2.93 × 10⁶. The swirl ratio increases constantly under the friction torque during the flow process.According to Eq. (13), the moment coefficient decreases when swirl ratio increases, thereby leading to a slowing increase in the swirl ratio. Under the cruise condition, the swirl ratio achieves its maximum value at every position,due to the smallest mass flow rate and the largest rotational speed.

Fig. 18 HP turbine disk temperature.

Fig. 19 Effect of rotating Reynolds number variations on swirl ratio for different cavities.
The Nusselt number presented in Fig. 20 is obtained from the disk surfaces vertical to the axis of rotation in compressor Cavities 1-6.The difference between the wall temperature and the fluid reference temperature becomes greater, and thus the values of the Grashof number continuously increase from Cavity 1 to Cavity 6. Accordingly, the Nusselt number increases with the increase of Grashof number, especially for the conditions with higher mass flow rates. This indicates that the heat transfer coefficient increases with increasing Grashof number.The axial Reynolds numbers at the inlet,corresponding to the HP compressor cavities for various rotational speeds, range between 6.37 × 10⁵and 1.51 × 10⁶. The temperature rise caused by the heat transfer from the rotating surfaces has significant consequences for its cooling ability further downstream in the engine. The addition of the HP compressor internal air system results in a temperature rise of 48 K in the air delivered to the Low Pressure(LP)turbine cavity under the cruise condition.
The combined effects of pressure ratio and rotational speed on the discharge coefficient are shown in Fig. 21. The highpressure ratio improves the discharge coefficient; however,the effect of low rotational speed has the opposite effect, and the discharge coefficient settles between the two effects. Even though the higher rotational speed allows the discharge coefficient to increase (at Ω = 21633 r/min and Ω = 21828 r/min,Cd= 0.661 compared with 0.666), the reduced pressure ratio will cause the discharge coefficient to decrease. The discharge coefficient at pressure ratio of 2.865(Cd=0.642)is lower than that at pressure ratio of 3.494(Cd=0.683).The fitted line can predict the discharge coefficient fairly well without concerning the influence of rotational speed; however, a better agreement would be achieved if the combination effects of the two factors are considered simultaneously. The difference between the computed discharge coefficient and the correlation at Ω = 17340 r/min is 1.35% whereas at Ω = 21828 r/min the discharge coefficient is almost equal.

Fig.20 Effect of Grashof number variations on Nusselt number for different axial Reynolds numbers.

Fig. 21 Effect of pressure ratio variations on discharge coefficient.
4.4. Rim seal branch results

4.5. Sensitivity analysis
In this section,a study on how the correction coefficient for the contact heat conduction affects the preswirl system performance is performed. It should be noted that the sensitivity analysis is conducted by varying the correction coefficient in the scope of 0.6 to 1.0. Effects on the preswirl system performance are demonstrated using two parameters, namely, the preswirl efficiency and the loss coefficient, as shown in Fig.23.This figure reveals a weak influence of the disk tip temperature on the preswirl efficiency and confirms that the preswirl ratio predominates the preswirl efficiency. By using higher correction coefficients, the amount of transferred heat load increases, resulting in the decrease of preswirl efficiency due to the increment in the relative total temperature at the entrance of the receiver holes according to Eq. (2). The improvement in the contact resistance brings about higher heat concentration at the disk surfaces.Due to thermal equilibrium,a lower metal temperature for the blades would be expected,which prolongs the life expectancy of turbine components.

Fig. 22 Relationship between leakage flow and p*in/

Fig.23 Sensitivity of preswirl efficiency to correction coefficient.
5. Conclusions
To realize fast and accurate analysis of the SAS of turbofan engines, this paper developed a 1D-3D coupling approach in engineering applications. Components with different dimensionalities were coupled through unified interfaces, whereby 1D codes were used to model the components with standard geometric characteristics and a 3D commercial CFD solver was adopted to capture the complex flow features in the preswirl system. The disk radial temperature distribution was determined by the fluid-solid conjugate heat transfer method.The performance of the 3D preswirl system model and the 1D compressor cavity model has been validated with available data. A multi-fidelity coupling simulation method for the SAS is proposed on this basis.
Impacts of flight conditions on the performance of the SAS of an advanced geared turbofan engine were investigated through three branches including high-pressure turbine blade cooling, high-pressure compressor cavity ventilation, and rim cavity seal. The SAS performance is strongly influenced by the flight conditions and the difference can be distinguished by the power lever angle.Since the trends of preswirl efficiency improvement are converse with the reduction of pressure loss of the preswirl system, it is critical to achieve an optimal match. An accurate prediction of the performance of the preswirl system can help to determine the turbine blade metal temperature, and further to estimate the turbine life. In addition,the heat transfer in the cavities is greatly enhanced with a rising rotational speed. A significant temperature rise is confirmed when the cooling air skims over the surfaces of high-pressure compressor disks, hence special attention is indispensable to design the downstream cooling configurations. The leakage flow could change by a relatively large amount under different flight conditions and thus is related to the reliable engine performance evaluation.
The flexibility and generality of the simulation environment allow easy integration as a part of the complete engine performance model. A more realistic engine performance model could be created through the coupling method.
Declaration of Competing Interest
The authors declare that they have no known competing financial interests or personal relationships that could have appeared to influence the work reported in this paper.
Acknowledgements
This project was financially supported by Sichuan Gas Turbine Establishment, Aero Engine Corporation of China.
杂志排行

CHINESE JOURNAL OF AERONAUTICS的其它文章
- Recent developments in thermal characteristics of surface dielectric barrier discharge plasma actuators driven by sinusoidal high-voltage power
- A review of bird-like flapping wing with high aspect ratio
- Rotating machinery fault detection and diagnosis based on deep domain adaptation: A survey
- Stall flutter prediction based on multi-layer GRU neural network
- Supervised learning with probability interpretation in airfoil transition judgment
- Effects of input method and display mode of situation map on early warning aircraft reconnaissance task performance with different information complexities