Aerodynamic performance of hovering micro revolving wings in ground and ceiling effects at low Reynolds number
2023-02-09JinjingHAOYanlaiZHANGChaoZHOUSongtaoCHUJianghaoWU
Jinjing HAO, Yanlai ZHANG, Chao ZHOU, Songtao CHU, Jianghao WU
School of Transportation Science and Engineering, Beihang University, Beijing 100083, China
KEYWORDS Ceiling effect;Flapping wing;Ground effect;Micro air vehicle;Revolving wing
Abstract Numerous investigations have been conducted to understand the wall effects on rotors.The purpose of this study is to further investigate the aerodynamic performance of revolving wings,especially when it is very close to the ground and ceiling (i.e., less than half the wingspan) at low Reynolds numbers. Hence, the ground and ceiling effect for hovering micro revolving wings at low Reynolds numbers are investigated by improving the theoretical models.The theoretical model for the ground effect is established based on the wall-jet assumption,and that for the ceiling effect is improved by considering the uneven spanwise distribution of induced velocity. These two models are validated by comparing the results of experiments and CFD simulations with the Lattice-Boltzmann Method(LBM).Both ground and ceiling effects are found helpful to enhance the thrust,especially with small wing-wall distances, by making a difference to the induced velocity and the pressure distribution. By comparing the thrust generation and aerodynamic efficiency between the ground and ceiling effects, the former is found more helpful to the thrust augmentation, and the latter is more beneficial for the aerodynamic efficiency promotion.
1. Introduction
In the past two decades, Micro Air Vehicles (MAVs) have attracted great research interests due to their potential in military,security,and civil applications,including but not limited to intelligence gathering,fixed-point patrol,precise attack,and disaster relief.MAV prototypes in rotary-wing(e.g.,the Black Hornet1equipped by British scouts in 2016, DJI PHANTOM series,2and Parrot Bebop3) and flapping-wing (e.g., the RoboBee,4,5DelFly Nimble,6and KUBettle7,8) configurations especially stand out because of their hovering capability.These small and light-weighted flying robots are desirable to perform missions in confined environments, confronted with energy savings and reliable operation challenges.
One of the prominent problems in the application of MAVs is the short mission time.9,10The shrinking size inevitably leads to increased viscous loss and reduced efficiency conversion at low Reynolds numbers.10,11Flying creatures such as birds and insects take advantage of the ground effect to save energy.Researchers exploit this bioinspired method to extend the endurance of MAVs by perching on or hovering near surfaces.12As a result, studies on the influence of interaction between wings (including rotary and flapping wings) and surrounding walls on the aerodynamic performance of MAVs emerge in large numbers.
It is commonly accepted that the effect of lateral walls is negligible,13,14and lots of attention are paid to the ground and ceiling effects. Jardin et al.13extracted aerodynamic loads and velocity fields by experiments to check the influence of ground and ceiling effects on the aerodynamic performance of a hovering micro-rotor. In their experiments,the disk loading and pitching angle of the rotors were kept unchanged. In this condition, the rotor power loading will rapidly increase when the wing-wall distance is within one rotor diameter,indicating an increase in thrust at a given power.Furthermore,the increase in power loading in the ground effect is more obvious than that in the ceiling effect. They associated the ground effect with the change in the axial induced velocity at the rotor disk, and the ceiling effect with the distortion of the flow toward the rotor. Prothin et al.15carried out a numerical and experimental analysis on the flow field around a revolving wing in the ground effect.They validated that a decreasing distance between the rotor and the ground makes the flow recirculate upward and impinge the rotor from underneath, which changes the force distribution on the blade over the wingspan.Kocer et al.16tested the flight of micro-rotors on close proximities of ceilings and collected the real-time flight data,including rotor speed, rotor thrust, and battery current. The results showed a decrease in the current drawn by the battery with the ceiling effect,suggesting that the thrust efficiency increases while the rotor approaches the ceiling.
Apart from revolving wings, flapping wings in the wall effects also attracted much attention. Lu et al.17-19proposed that the ground effect on flapping wings consists of ‘‘force enhancement-force reduction-force recovery”, unlike rotary wings. They claimed that the force enhancement is because the ground blocks the downward convection of the trailingedge vortex shed from the previous stroke;the reduction might be due to the induced jet flow pointing toward the leeward side of the wing; the recovery is associated with the leading-edge vortex reattachment.However,in the ceiling effect,the aerodynamic force of flapping wings is found to increase monotonically with a closer position to the ceiling.14,20Meng20interpreted this phenomenon as the increasing relative velocity and the pitching angle, together with an interaction between the leading-edge vortex and its mirror vortex actuated by the ceiling.
Experimental evidence shows that ground and ceiling effects are not avoidable in the operation of MAVs, such as takeoff and landing, and must be treated with caution.21,22For example, MAVs are very likely to hit the ceiling due to the suction of the additional thrust, resulting in a crash without proper control.16,23Nakata et al.24developed a surface detector for autonomous flying vehicles. This collisionavoidance mechanism is independent of vision, mediated by perceiving modulations of induced flow caused by wall effects.Because control strategies accommodating to realistic situations call for accurate quantitative data about the change in aerodynamic force and power, it is ideal to have a theoretical model to assist design.
Most existing analytical models toward wall effects are based on the situation where a helicopter rotor is in the ground proximity,dating back to the early 20th century.In the 1950s,Zbrozek25implemented experiments on a hovering helicopter and determined that the thrust of a helicopter rotor operating at constant power increases as it approaches the ground.Betz26then built a theoretical model in which the rotor is replaced by a sink and the ground by an image sink with equal strength situated below the revolving wing. However, Cheeseman and Bennett27later argued that the flow pattern beneath the rotor resembles a source rather than a sink.Following this new assumption, they deduced an empirical evaluation of the ground effect for hovering revolving wings, i.e., the renowned Cheeseman-Bennett (C-B) model. Although the C-B model agrees well with flight test results, it fails when Dg/R ≤0.25(Dgrepresents the distance between the wing and the ground,and R represents the radius of the rotor) because the thrust is predicted to increase exponentially to infinity within this range.Apart from the C-B model, there are also some theoretical models, such as Hayden’s model and Johnson’s model(Table 127-29). However, these models hugely overvalued the thrust when wings are extremely close to the ground (Dg/R ≤0.25). As for the ceiling effect, helicopters do not have to bother with this issue,and related models are scarce.Conyers et al.30used the C-B model to predict the thrust of rotors in the ceiling effect. It turns out that the predicted results agree with the experimental results in the case of Dc/R >1 (Dcrepresents the distance between the wing and the ceiling) but diverge obviously when Dc/R ≤1. In doing so, the limitation of the C-B model mentioned above cannot be avoided, and the distinct physical mechanisms behind the ground and ceiling effects are ignored. Afterward, Hsiao and Chirarattananon9further proposed an original model for especially dealing with the ceiling effect based on the blade element momentum theory, which can provide good descriptions of experimental observations even when Dc/R ≤0.25.But this model neglected the uneven distribution of the induced velocity along the wingspan and confused the differential thrust for a blade element with the integral thrust over the entire wing.
In summary, rotary-wing or flapping-wing MAVs could benefit from reduced energy consumption and extended flight endurance with a closer position to the ground and the ceiling,such as perching on surfaces or hovering in the close vicinity of walls. To remain stable in these situations, the flight control system must adjust the altitude and attitude of MAVs. As a result, it is necessary to acquire a priori information about how MAVs perform with the presence of walls. Because the existing models are inadequate to predict change in aerody-namic performance with small wing-wall distances, this paper first modifies those aforementioned theoretical aerodynamic models by: (A) introducing the wall-jet assumption into the ground effect model to deal with small ground clearances;(B) improving Hsiao’s ceiling effect model by considering the uneven induced velocity distribution along the wingspan, and using the correct form of integral thrust over the entire wing.Then, modified models are compared with experimental measurements and CFD calculations. Finally, comparisons between the ground and ceiling effects in terms of thrust,aerodynamic power, and aerodynamic efficiency are conducted to analyze how to maximize the advantages of these two effects.

Table 1 Theoretical aerodynamic models for a single rotarywing in ground effect.
2. Model and methods
2.1. Model
This study makes use of a simple rectangular wing planform.The wing section is a flat plate, the thickness of which is 1%of the chord length of the wing.The constant chord length(c = 0.08 m) and changing wingspan (R) lead to changing aspect ratio(AR =R/c). AR = 1,3,5, and 7 are considered,basically covering the aspect ratio range of wings in MAVs.
The global coordinate system O-XYZ and the local coordinate frame o-xyz are introduced to describe the 3D motion and forces of a wing, as shown in Fig. 1 (a) and 1(b). These two coordinate systems share the same origin located on the 1/2 chord position of the wing root. The OY-axis, that is, the axis of revolution, is perpendicular to the horizontal plane O-XZ.The coordinate system o-xyz is fixed on the wing. The oxaxis is spanwise and points from the root to the tip. The oyaxis is chordwise and points from the trailing edge to the leading edge.The oz-axis is determined according to the right-hand rule.


The thrust (T), aerodynamic power consumption (P), and aerodynamic efficiency (η)are calculated to quantify the aerodynamic performance of the revolving wing. As plotted in Fig.1,the thrust is defined as the projection of resultant aerodynamic force along the OY-axis,and it can be nondimensionalized as CT=2 T/(ρUr2efS);the horizontal force(H)is defined as the projection of resultant aerodynamic force in the O-XZ plane,and it can be nondimensionalized as CH=2H/(ρUr2efS).Aerodynamic power is consumed to overcome the horizontal force, defined as P = Qa·˙φ, where Qais the aerodynamic torque around the OY-axis, and the power consumption can be nondimensionalized as CP= 2P/(ρUr3efS). The efficiency of thrust generation is described as η = CT3/2/CP.35
Wing-wall distance (Di(i = g, c)) ranging from 0 to 2R is considered, where the ground and the ceiling are specified by the subscript ‘‘g” and ‘‘c”, respectively. In particular, CTand CPof cases with Di= c, 0.5c, and 0.25c are computed using the CFD method to quantitively validate the theoretical model when the revolving wing is extremely close to the wall.
2.2. Ground effect modeling
This section establishes a theoretical model to explain the ground effect on the aerodynamics of a revolving wing in hovering. When the wing is far from the ground, that is, Out of the Ground Effect (OGE), the upstream and downstream flows can be regarded as vertical. When the wing is In the Ground Effect(IGE),the wingtip vortex(TV)first sheds from the trailing edge, then shrinks along the radius direction, and extends again when approaching the ground. In this process,the wake of the wing transits from the vertical direction to the radial direction. Meanwhile, the wing TV gets stretched due to dissipation in the presence of the ground. As a result,Fig.1 Schematics of wing motion and aerodynamic forces of a revolving wing in ground effect and in ceiling effect,and an airfoil section of revolving wing at a location r from root.the radial velocity in the wake first increases and then decreases sharply as the wing-ground distance (Dg) decreases,behaving like a wall-jet.36To describe the feature of the wake structure and the radial velocity, the wall-jet assumption is introduced into the theoretical model to ensure applicability in small ground clearances.

Fig. 2 Schematic of airflow around a revolving wing in ground effect.
As shown in Fig. 2, it is reasonable to build the hypothesis that the air vertically passes through the wing and generates the axial induced velocity vi. Assuming that viis radially uniform, which yields pressure difference between the upper surface (p-) and the lower surface (p+) of the wing, we have.

where pr(r) is the pressure of the air near the ground, p0is the atmospheric pressure, and v∞is the velocity of the downwash far from the wing.
Combining Eq. (1) and Eq. (4), we have.

Eqs. (3)-(5) associate Δp with vr(r). For simplicity, higherorder terms caused by a6, a5,and a0are omitted due to a negligible contribution to velocity vr(r).The dynamic pressure can be expressed as.

where CLαand CDαrepresent the slope of the lift and drag curve, respectively; Nbrepresents the number of revolving wings; θ represents the pitch angle (Fig. 1 (c)). CLαand CDαare determined by the quasi-steady model for flapping wings39to address for the cases with high angles of attack in this paper:

T and P can be obtained by substituting Eq. (17) into Eq.(14) and Eq. (15), respectively.
2.3. Ceiling effect modeling
In this section,a theoretical model proposed by Hsiao et al.9to explain the ceiling effect on the aerodynamics of a revolving wing in hovering is improved by considering an uneven distribution of vialong the wingspan. When the wing is ICE, the ceiling mainly obstructs the incoming air instead of the downwash. Therefore, the wall-jet hypothesis in the ground effect model does not work. It is assumed that the incoming airflow horizontally enters the region between the ceiling and the wing,and vertically passes through the wing, yielding axial vi. The horizontal velocity vr(r) is regarded as a function of the radial position r, independent of axial distance from the ceiling.
Let’s consider a blade element with a width dr at the radial position r, and a tube that connects the horizontal incoming flow beneath the ceiling and the downwash far from the wing(Fig. 3). Along the tube, the flow rate must remain constant:

After passing through the wing, the airflow continues to develop and finally becomes uniform. According to the Bernoulli equation, the pressure of the air near the wing can be described as.

Fig. 3 Schematic of airflow around a revolving wing in ceiling effect.

In particular, when the wing is far from the ceiling, that is,out of the ceiling effect(OCE),Dc→∞,γ(r )→1,Eq.(28)can be further expressed as.

which is exactly the same as the expression for the induced velocity of hovering revolving wings without wall effects.40
The above-mentioned analysis of the theoretical model for the ceiling effect is mainly based on the hypothesis and method proposed by Hsiao et al.9Compared with their model, an uneven distribution of vialong the wingspan (Eq. (28)) is considered in this paper, aiming at providing a more accurate description of airflow passing through the wing.
Substitute Eq.(29)into Eq.(10)and Eq.(11),and T and P over the entire wing are the integral of them along the wingspan, respectively.
2.4. CFD method
The validation of theoretical models concerning small wingwall distances,and the comparison of the aerodynamic performance between IGE and ICE wings are conducted based on the CFD results. In this study, the CFD simulation is performed using a Lattice-Boltzmann Method (LBM), whose capability to solve flows for revolving wings at low Re has already been demonstrated.41,42The LBM solves the discrete Boltzmann equation, a statistical equation for the kinetics of gas molecules, instead of directly solving the Navier-Stokes equations. Compared to traditional CFD methods solving N-S equations, in the LBM, fluid particles perform consecutive propagation and collision processes over a discrete lattice Cartesian grid. A Bhatnagar Gross and Krook (BGK) model with the single-relaxation-time approximation is introduced into the collision step for relaxation to equilibrium, and in the BGK model,the probability fi(x,t)with velocity eiat location × and time t is described as.
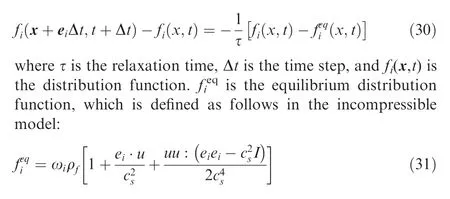
where ωiis the weight factor,and csis the speed of sound.The fluid density ρfand velocity u are computed according to the D3Q19 model and defined as.

The relaxation time τ is related to the viscosity by τ = 3ν + 0.5, where ν is the kinematic viscosity measured in lattice units. To ensure a non-negative kinematic viscosity, τ should be larger than 0.5. Thus, stability problems arise as the relaxation time approaches this limiting value at high Re.43To overcome this problem, the Recursive Regularized BGK (RR-BGK) collision model44is introduced to ensure a special regularization procedure. To treat the boundary condition on the wings, the immersed boundary method45is applied. The body forces are applied on lattice points near the boundary to enforce the no-slip condition on the boundary. The simulation in this study is conducted using LES with Wall-Adapting Local Eddy(WALE) model, which is assumed to have good properties both near to and far from the wall and for both laminar and turbulent flows.
Convergence checks are performed using the AR=5 wing far from the ground or ceiling as a typical case (c = 0.08 m,AR=5, ˙φ=1.5π rad/s,α=45°,Re≈6000).Results of three grids (Grids 1-3 in Table 2) with different lattice spacings but the same computational domain size (30c) are shown in Table 2. The time-averaged aerodynamic forces from Grid 2 and Grid 3 agree with each other approximately after five revolving cycles,indicating that the computed results are independent of the lattice spacing.Fig.4 shows that there are some obvious differences between Grid 1 and Grid 3 in the vorticity and iso-vorticity surface, but the discrepancy between Grid 2 and Grid 3 is slight. Because the computational time for Grid 3 is much longer than that for Grid 2,Grid 2 is ideal.Similarly,the influence of the computational domain size (20c, 30c, 40c)is also checked separately. The averaged thrust coefficients of Grid 2 with 20c, 30c, and 40c domain size are 1.4440,1.4217, and 1.4189, respectively. The difference in thrust between 30c and 40c domain size is around 0.2%,but the full domain elements of the latter are four times more than the former,leading to a longer calculation time.Specifically,the computational domain of 30c, the finest lattice spacing of 0.01c around the wing, and the coarsest lattice spacing of 0.25c are chosen.The time step is indirectly determined,keeping the stability parameter U(Δt/Δx)(where U is the velocity magnitude,Δt is the time step,and Δx is the finest lattice spacing)between 0.1 and 0.3.

Table 2 Lattice spacing and calculation time of three different grids (computational domain size of 30c).

Fig.4 Vorticity fields around the wing with different grids at φ=360°:(upper) contours of vorticity at R2 position (the magnitude of vorticity at outer contour is 500 and contour interval is 20);(down)iso-surface of vorticity(the magnitude of non-dimensional vorticity is 100).
A quantitative comparison with the existing results in Ref.34 is made.The contrast of the averaged force coefficients is shown in Fig. 5, where CFD results agree with the experimental measurements in the literature. Therefore, it is reasonable to believe that the CFD method is suitable for this study.
3. Results and discussion
3.1. Validation of theoretical model

Fig.5 Contrast of averaged CT and CH between CFD results in this study and experimental measurements in Ref.34.
Firstly, the accuracy of theoretical models in Section 2 is validated by comparing their estimations with experimental data.For the ground effect, experimental data are taken from Light’s experiment,46in which the thrust of a four-bladed rotor with constant chord and untwisted blades is measured(Fig.6).Parameters in Light’s experiment are shown as follows:R = 1.105 m, c = 0.18 m, ˙φ ≈172.3 rad/s, θ = 13°-17°,Dg= 0.25R-2R, and corresponding Re≈7 × 10⁶. In their results, the ratio of IGE thrust (TIGE) to OGE thrust (TOGE),i.e.,TIGE/TOGE,is used to describe the enhancement or degradation of the thrust with the presence of the ground.13Accordingly,the curve-fitted relationship between TIGE/TOGEand Dg/R is presented, and the analytical results based on the C-B model,27Hayden’s model,29and Johnson’s model30are also given for comparison. As shown in Fig. 6, all the five models show a consistent tendency with the experimental data, and the thrust gets augmented with the decrease of Dg. Quantitatively, predictions agree well with measurements when Dg/R ≥1, except Johnson’s low loading model. However, when Dg/R <1, only the IGE model in this paper can match the experimental results, while others all overestimate the thrust augmentation caused by the ground effect.
Similarly, for the ceiling effect, measurements taken from Conyers’ experiment28are compared with model estimation in terms of the ratio of ICE thrust(TICE)to OCE thrust(TOCE)with respect to Dc/R (Fig. 6). The Conyers’ experiment used the Gemfan 9 × 4.7 propellers with R = 0.11 m and ˙φ-≈ 1000 rad/s, where Re ≈ 1 × 10⁵. In the range of 0.25 <Dc/R <2,the ICE model in this paper agrees well with the experimental results. Overall,the theoretical model in Section 2 effectively solves the problem of inaccurate prediction of thrust augmentation in the ground and ceiling effects with relatively small clearances,particularly when Di/R ≤0.5,and also performs well with Diranging from R to 2R.

Fig. 6 Contrast between experimental measurements and model estimations.

Table 3 Comparison of thrust between theoretical model estimations and CFD calculations.

Table 4 Comparison of aerodynamic power between theoretical model estimations and CFD calculations.
Besides, theoretical estimations are also compared with CFD results to further validate the model in this paper with relatively small wing-wall distances and low Re (Re≈1000-9000). TIGE/TOGEand TICE/TOCE, as well as PIGE/POGEand PICE/POCE, of the wing with different AR (AR = 1,3,5, and 7)at varying Di(Di=0.25c,0.5c,and c)from theoretical estimations and CFD calculations are listed in Table 3 and Table 4. The model in this paper gives predictions close to CFD results,either IGE or ICE cases.For the thrust,the maximum errors between the estimation and calculation are - 6.45 % IGE (AR = 1, Dg= 0.5c) and - 10.52 % ICE(AR=7,Dc=0.5c),respectively;for the aerodynamic power,the numbers are - 6.02 % IGE (AR = 7, Dg= 0.25c)and-8.72%ICE(AR=7,Dc=0.5c),respectively.It seems that the effect of the aspect ratio cannot be ignored when it comes to the applicability of our theoretical model. In the range of AR = 3-5, the model performs well in the whole range of 0 <Di<2R, and the maximum error is no more than 4 %; when AR ≤1, predictions are relatively accurate when 0.5R <Di<2R, but gradually deviate from calculations with smaller Di, especially for ICE cases; when AR ≥7, the error gets even larger, and the model tends to underestimate the increase in thrust and aerodynamic power.As for the effect of Re, our improved model runs well compared with experiments with Re exceeding 105and calculations with Re around 103.Overall,the improved theoretical model is applicable within the range of Re≈103-106,covering the operation of most rotary-wing MAVs.

Fig.7 Contrast of time-averaged flow field and iso-surface of Q criterion around the wing at φ=1800°(AR =1, Di=0.5c)(arrows represent velocity vector, and color represents the velocity magnitude, the radial velocity and distance from the wall are nondimensionalized by Uref and R, respectively).
The flow field around the wing is depicted to validate the flow assumptions,which are the basis of the theoretical model.Fig.7 shows the velocity field and iso-surface of vorticity based on Q-criterion(Q=20)around the AR=1 wing in three situations: far from the ground and ceiling (OG(C)E), in the ground effect, and in the ceiling effect. For the OG(C)E wing,LEV migrates to the wingtip and then sheds into the wake together with a strong TV. The wake gradually develops into a spiral path below the wing surface. The spiral wake is obvious within the range of 2R apart from the wing along the axis.
As shown in Fig. 7(b), in contrast, the ground forced the wake integrated with LEV and TV to expand within a small axial distance,behaving like a wall jet.This jet-like flow structure is consistent with our assumption in the theoretical model,assuming that the radial velocity in the wake first increases and then decreases sharply in the process of approaching the ground (Fig. 7 (d)). Meanwhile, the loop-shaped wake rebounds upward from the ground. Due to the reboundedflow, on one hand, the spiral wake is of larger diameter; on the other hand, the vortices accumulate underneath the wing root and resemble a fountain, resulting in additional lifting force acting on the wing.47,48Simultaneously,the flow affected by the ‘‘fountain effect” is too complex to simplify as a walljet, which may be one of the reasons for the discrepancy between the model estimation and CFD calculation.

Fig. 8 Contrast of CFD-calculated and model-predicted of wings with different AR at different Di.
As shown in Fig.7(c),For the ICE wing,the incoming flow is approximately horizontal above the wing due to the obstruction of the ceiling, consistent with the flow assumption in the theoretical model.Influenced by the horizontal flow,the spanwise and tangential flow carries the LEV and TV away from the wing surface with higher velocity, collecting near the leading edge. The spiral wake in the stable spiral structure of the wake cannot be kept; instead, it quickly dissipates and breaks into many pieces within the range of R apart from the wing along the axis.
3.2. Effects of Di on aerodynamic performance
This part discusses the influence of Dion the aerodynamic performance of IGE and ICE wings based on CFD results. The contrast of CFD-calculated and model-predicted TIGE/TOGEand TICE/TOCEof wings with different AR at varying Diare presented in Fig. 8 (a) and 8(b). With a specific AR, either TIGEor TICEkeeps increasing as Didecreases; the smaller Diis, the higher the increasing rate is. Within the range of Diand AR studied, TIGEor TICEcan increase by 20 % at most.This indicates that the wing would benefit from thrust enhancement in the close vicinity of the ground or ceiling.The trend in the aerodynamic power is quite similar to that in the thrust, as shown in Fig. 8 (c) and 8(d).
With a fixed Di,the tendency of thrust enhancement weakens as AR increases for the ground effect. Particularly, when Di≤0.2R, thrust experiences a sharp augmentation in the AR = 1 wing, while only minor differences occur among AR ≥3 wings. However, the thrust enhancement in AR = 1 and AR = 7 cases is noticeable for the ceiling effect, but approximately remains a relatively low level in AR = 3 and AR = 5 cases.
According to the blade element theory(Eq.(14)),if ˙φ and α of the wing are kept unchanged,the thrust is highly dependent on the reduced velocity (vi). Taking the ceiling effect as an example,Fig.9(a)shows the distribution of vialong the wingspan of the AR=3 wing at different Dc.CFD-calculated and model-predicted viagree well with each other in the middle wingspan (approximately from r/R = 0.3 to r/R = 0.7), but show distinct discrepancy near the wing root and tip.In particular, the model predicts that vifor the OCE wing increases monotonously from the root to the tip,while CFD shows that it drops near the wingtip. Besides, in situations where Dc≤0.15, CFD gives viin opposite sign with a large change rate near the root area,which is not seen in model predictions.Such a discrepancy of vithat occurred near wingtip and root might be caused by the wing root vortex and tip vortex.However,both CFD and model results reveal that the magnitude of videcreases with the decrease of Dc.In the range of Dc/R ≤0.4,even a tiny fluctuation in Dccould lead to a noticeable change in vi. Besides, the spanwise distribution of vialso varies. With relatively large Dc, there is an obvious increase in vifrom r/R = 0.2 to r/R = 0.8. As Dcdecreases to a value less than 0.4R,the viprofile along the wingspan gets flattered within this region. The peak position of vigradually moves towards the wing root as Dcdecreases, resulting in a more severe change in vinear the distal end than the proximal end of the wing.Quantitatively, the peak viis -0.28Urefat r/R = 0.8 for the OCE wing, compared with - 0.12Urefat r/R = 0.4. Apart from vi, differences are also seen in the pressure coefficient Cpdistribution on the wing (Fig. 9 (b)). The enlarged area of negative pressure on the upper surface is the main reason for the thrust augmentation with decreasing Dc.Overall,the smaller the Dcis,the smaller the viis,and the more benefit the ICE thrust gains.A similar phenomenon is also true for the ground effect,reported by Prothin et al.15The closer the wing is placed to the ground,the more uniform the induced velocity distribution becomes, and the more significant the influence of it on the aerodynamic pressure distribution is.
3.3. Comparison of aerodynamic performancebetween IGE and ICE wings
Both ground and ceiling effects are found beneficial to thrust(T) augmentation for wings. Not only the thrust but also the power consumption (P) and aerodynamic efficiency (η) are of great importance in practical application. Table 5 shows the comparison of CFD results based on criteria including T, P,and η between ground and ceiling effects of different AR wings. Both T and P increase with the decrease of Di. And since T increases faster than P,49η gets enhanced as the wing approaches the ground or the ceiling. Table 5 also shows that the IGE wing gains more thrust augmentation than the ICE wing except for the AR=7 case.TIGE/TOGEis approximately 2%-8%larger than TICE/TOCEwhen AR <7.In general,the ceiling effect is more aerodynamically effective,with ηICE/ηOCEexceeding ηIGE/ηOGEby 2%-7%on average(see Fig.8(e)and 8(f)).

Fig. 9 Distribution of induced velocity along wingspan, and static pressure on upper and lower surfaces (AR = 3) at different Dc.
The AR = 5 wing is taken as an example. As shown in Fig. 10 (a) and 10(b), the sectional CTand CPincrease across the entire wingspan as Didecreases. Comparing the two wall effects, we can see that the IGE wing expresses a lower rate of growth in sectional CTand CPover the proximal end(0 < r/R < 0.5), but a higher rate over the distal end(0.5 <r/R <1) than the ICE wing. As for η, both ground and ceiling effects show enhancement in magnitude but withdifferent distribution regimes. The IGE wing has a higher η over the middle part of the wingspan, while the ICE wing has a higher η over root and tip ends, as shown in Fig. 10 (c).

Table 5 Contrast of CFD-calculated T, P, and η of wings with different AR at different Di (averages over four revolving cycles).

Fig. 10 Contrast of CFD-calculated distribution along wingspan of AR = 5 revolving wing (averages over four revolving cycles).
Differences in T and P are reflected more intuitively by the distribution of the static pressure. Fig. 10 (d) depicts the average static pressure coefficient(Cp=2p/(ρUr2ef))over the entire upper and lower surfaces of the AR=5 wing.Quantitatively,the average Cpon the upper and lower surfaces of the OG(C)E wing are - 1.4694 and 0.3848, respectively; for the IGE wing,numbers are - 1.7135 and 0.7846; for the ICE wing, they are - 1.7483 and 0.4879. The ground effect creates a larger area of positive pressure with a higher magnitude on the lower surface. In comparison, the ceiling effect creates a larger area of negative pressure on the upper surface, but the peak values of the negative pressure in the two effects are at the same level.Overall, the integration of the pressure difference for the IGE wing(about 0.4928)is larger than that for the ICE wing(about 0.4687),resulting in greater aerodynamic forces.However,the corresponding power consumption inevitably increases because it is proportional to the drag in the revolving motion.Accordingly,MAVs with revolving wings can be applied in the close vicinity to walls for improved aerodynamic performance.Priority can be given to the ground effect for carrying a high payload and the ceiling effect to maintain long flight endurance.
4. Conclusions
(1) The theoretical models estimating the thrust and aerodynamic power of the revolving wing in two wall effects are improved.The model for the ground effect is established based on the wall-jet consumption, and that for the ceiling effect is improved by considering the uneven spanwise distribution of induced velocity.These two models are both validated by comparing the experimental measurements with CFD simulations in LBM methods. It is suggested that the model developed in this paper performs well when the wing-wall distance is within the range of 0 <Di≤2R. Although the applicability of our theoretical model is aspect-ratio-dependent, its predictions agree well with the existing experimental measurements. The error between theoretical estimations and CFD calculations is no more than 10 %, and keeps as low as 3 % on average in the range of AR = 3-5. The wall-jet assumption and the blade element momentum theory used to establish the model are validated to be reasonable by analyzing the flow field structures.
(2) Based on the theoretical models and CFD simulation,the influence of wall clearance is addressed. Both ground and ceiling effects are found helpful for thrust enhancement,which increases by at least 20%compared to hovering cases without wall effects. The small wing-wall distance can highlight the aerodynamic benefit because of the reduced induced velocity and enlarged negative pressure area over the upper surface of the revolving wing.
(3)The aerodynamic performance in the ground and ceiling effects is compared in terms of thrust generation and aerodynamic efficiency.It is found that operating MAVs with revolving wings in the close vicinity of the ground is more helpful to enhance thrust for carrying a high payload, while the ceiling effect is more helpful to improve aerodynamic efficiency for long flight endurance.
Declaration of Competing Interest
The authors declare that they have no known competing financial interests or personal relationships that could have appeared to influence the work reported in this paper.
Acknowledgements
This research was supported by the National Natural Science Foundation of China (No. 11902017) and the China Postdoctoral Science Foundation (Nos. 2020T130043 and 2019M650418). The authors would like to thank Dr. Long CHEN of Northeastern University for the helpful discussion regarding this project and the valuable comments on the manuscript.
杂志排行

CHINESE JOURNAL OF AERONAUTICS的其它文章
- Recent developments in thermal characteristics of surface dielectric barrier discharge plasma actuators driven by sinusoidal high-voltage power
- A review of bird-like flapping wing with high aspect ratio
- Rotating machinery fault detection and diagnosis based on deep domain adaptation: A survey
- Stall flutter prediction based on multi-layer GRU neural network
- Supervised learning with probability interpretation in airfoil transition judgment
- Effects of input method and display mode of situation map on early warning aircraft reconnaissance task performance with different information complexities