Discharge characteristics of coal and extraction residue from direct coal liquefaction in partial fluidization silo
2023-01-30ZhenLiuHaiquanAnJianshengZhang
Zhen Liu, Haiquan An, Jiansheng Zhang
1 Department of Energy and Power Engineering, Tsinghua University, Beijing 100084, China
2 National Institute of Clean-and-Low-Carbon Energy, Beijing 100084, China
Keywords:Discharge characteristics Silo Extraction residue Direct coal liquefaction Fluidizing air
ABSTRACT Gasification of extraction residue (ER) from direct coal liquefaction with pulverized coal is an efficient way for the utilization of carbonaceous wastes,which improve the overall efficiency of direct coal liquefaction technology.The discharge characteristics of ER mixing with pulverized coal is important paraments for its gasification process, which is seldom studied in the literature.In this study, the discharge characteristics of the pulverized coal(M1)as well as its mixture with ER(M2)were systematically investigated in an atmospheric pressure partial fluidization silo with different fluidization apparent velocity.It was observed that although M2 is a viscous powder with lower flowability than M1,the mass flow rate of M2 is 65%higher than M1 at the 3.7 mm∙s-1 apparent gas velocity.M2 exhibits the properties of Geldart A type powder,which improves the mass flow rate and stability of the discharged material.The mass flow rate of both M1 and M2 first increases and then slowly decreases with the increase of apparent gas velocity of the fluidizing air,which means the discharge process of M1 and M2 can be optimized by the apparent gas velocity.
1.Introduction
Large-scale coal gasification technology is an efficient and clean coal conversion technology[1,2].This process is a highly adaptable feedstock conversion technology for carbon-containing complex feedstocks such as biomass[3],petroleum coke[4],and extraction residue (ER) from direct coal liquefaction [5].One of the most important components of the pulverized coal gasification unit is the discharge of the pulverized coal from a high-pressure silo and its transport by a dense phase gas to the gasifier for reaction[6].The stability of the pulverized coal discharge from the silo has been repeatedly studied in the literature as one of the key factors influencing the gasification process performance.
Since the beginning of the 20th century,numerous studies have been carried out on the flow characteristics of powders in silos,among them powder physical properties, particle size, density,friction, and viscosity are of particular importance that affect the powder flow characteristics and stress distribution in the silo.Jinetal.[7,8]studied the effect of moisture on the flow of lignite using FT-4 rheometer and found that the lignite flow decreased with an increase in moisture content.Spinketal.[9] studied the flow pattern of sand with different particle sizes under the gravity flow pattern,and concluded that the downflow rate of the particles slowly decreased with increasing the sand particle size.However, sand is a non-viscous powder, which is very different from substances such as coal dust.Guoetal.[10] studied the flow characteristics of a mixture of rice straw particles and coal dust,and indicated that the mixture flow characteristics were no longer clearly related to its Hausner ratio value due to the irregular shape of the rice straw particles.In addition to the effect of powder physical properties,the powder flow characteristics in the silo are also influenced by the silo structure[11,12].The ER has a certain viscosity,and similar cohesive powders are prone to discharge difficulties during silo discharge, which are often solved by silo vibration, ventilation and fluidization in practical applications.Luetal.[13,14] studied the pulverized coal discharge in a carbon steel hopper at several aeration rates.
In summary, the powder flow characteristics in the hopper are different due to variations in physical properties, and the fluidization process can help the powder to be steadily discharged from the hopper.The coal liquefaction oil residue extract is a carbonaceous raw material that has undergone through the direct coal liquefaction and extraction processes,and its properties are similar to those of the pulverized coal but with high ash and sulfur contents as well as high viscosity.In the gasification process of the pulverized coal and ER mixture, the stability of transportation as well as safety of the process are directly affected by the mixture flow characteristics in the silo.Due to the importance of the mixture properties with focus on its flowability, we characterized the flow properties of the pulverized coal as well as its mixture with ER in a systematic study through flow characteristics experiments under different fluidization wind speeds in an atmospheric pressure partial fluidization silo.
2.Materials and Methods
2.1.Experimental apparatus
In Fig.1,the schematic setup of an atmospheric fluidized silo is presented which facilitates the study of discharge characteristics,and is composed of three main components: silo, gas supply system, and a data acquisition system.The silo, containing a cylinder section and a cone section is made of stainless steel.The cylinder section is 90 cm high, with an inner diameter of 30 cm.The silo is places vertically on the support frame,which is 30 cm away from the bottom of the cylinder section of the outer wall that is evenly arranged along the circumferential direction of three ear bearings.The cone angle of the cone section is 30°, with an outlet diameter of 2 cm, and is composed of three sections: the middle part (88–192 mm from the virtual apex of the cone)is the annular air chamber section,which is used to carry out local fluidization of the powder inside the chamber.The wall cloth air plate of the air chamber is made of sintered metal powder, with a filtration accuracy of 30 μm.The outer wall of the metal pipe is connected to the air supply system.Each section of the experimental bin is connected to a flange.In order to obtain a stable stacking state and enhance repeatability of the experiments, a feeding tank was set up above the experimental silo.The outlet diameter of the feeding tank is 5 cm.The gas supply system consists of air compressor,gas storage tank and mass flow rate controller for the gas phase.The capacity of the gas storage tank is 0.3 m3, with a maximum working pressure of 0.84 MPa,which is used to buffer the pressure fluctuations and stabilize the gas supply.The gas mass flow controller is used to accurately control the gas flow rate.The data acquisition system is composed of two parts that acquire mass data as well as wall stress measurements.Measurement and collection of the mass data is conducted using a mass sensor installed under the ear support,with the help of a data acquisition software.The wall stress measurements were carried out using stress sensors as well as a stress and strain analyzer.The stress sensors are installed along the discharging direction, at subsequent distances of 770, 645, 520, 395,270, 145, 20, –30, –130, –230, and –330 mm away from the cone joint with a consideration that the positive direction is toward the top of the joint surface.Corresponding numbers were 0–10, a total of 11 sensors.The pressure sensing surface of the stress sensors were flush with the inner wall surface of the silo.The measurement range of the stress sensors are within –5 to 10 kPa.The mass and wall stress measurements were collected and stored in a computer through some auxiliary connecting cables.
2.2.Materials
In the experiments,we used a mixture of Wuhai(WH,mined in Wuhai, Inner Monglia, China) coal and Shenmu (SM, mined in Shenmu, Yulin, China) coal with a ratio of 1:10 as the coal sample(M1 sample),as well as mixtures of M1 with ER with a composition ratio of 80% to 20%, respectively (designated as M2 sample).The particle size distributions of the two tested materials of M1 and M2 are narrow and unimodal(Fig.2).The scanning electron microscope (SEM, Thermo Scientific Apreo, USA) images of the pulverized coal and ER particles are displayed in Fig.3.As evident in these images, the surfaces of the pulverized coal are smooth and compact,while the raffinate has more pores and is relatively loose.The specific physical property parameters of the tested materials are shown in Table 1.The M1 and M2 samples have some similar parameters such as moisture content and average particle size,with less significant impact on their mobility [15].However, M2 has a greater true density and higher critical fluidization wind speed than M1.
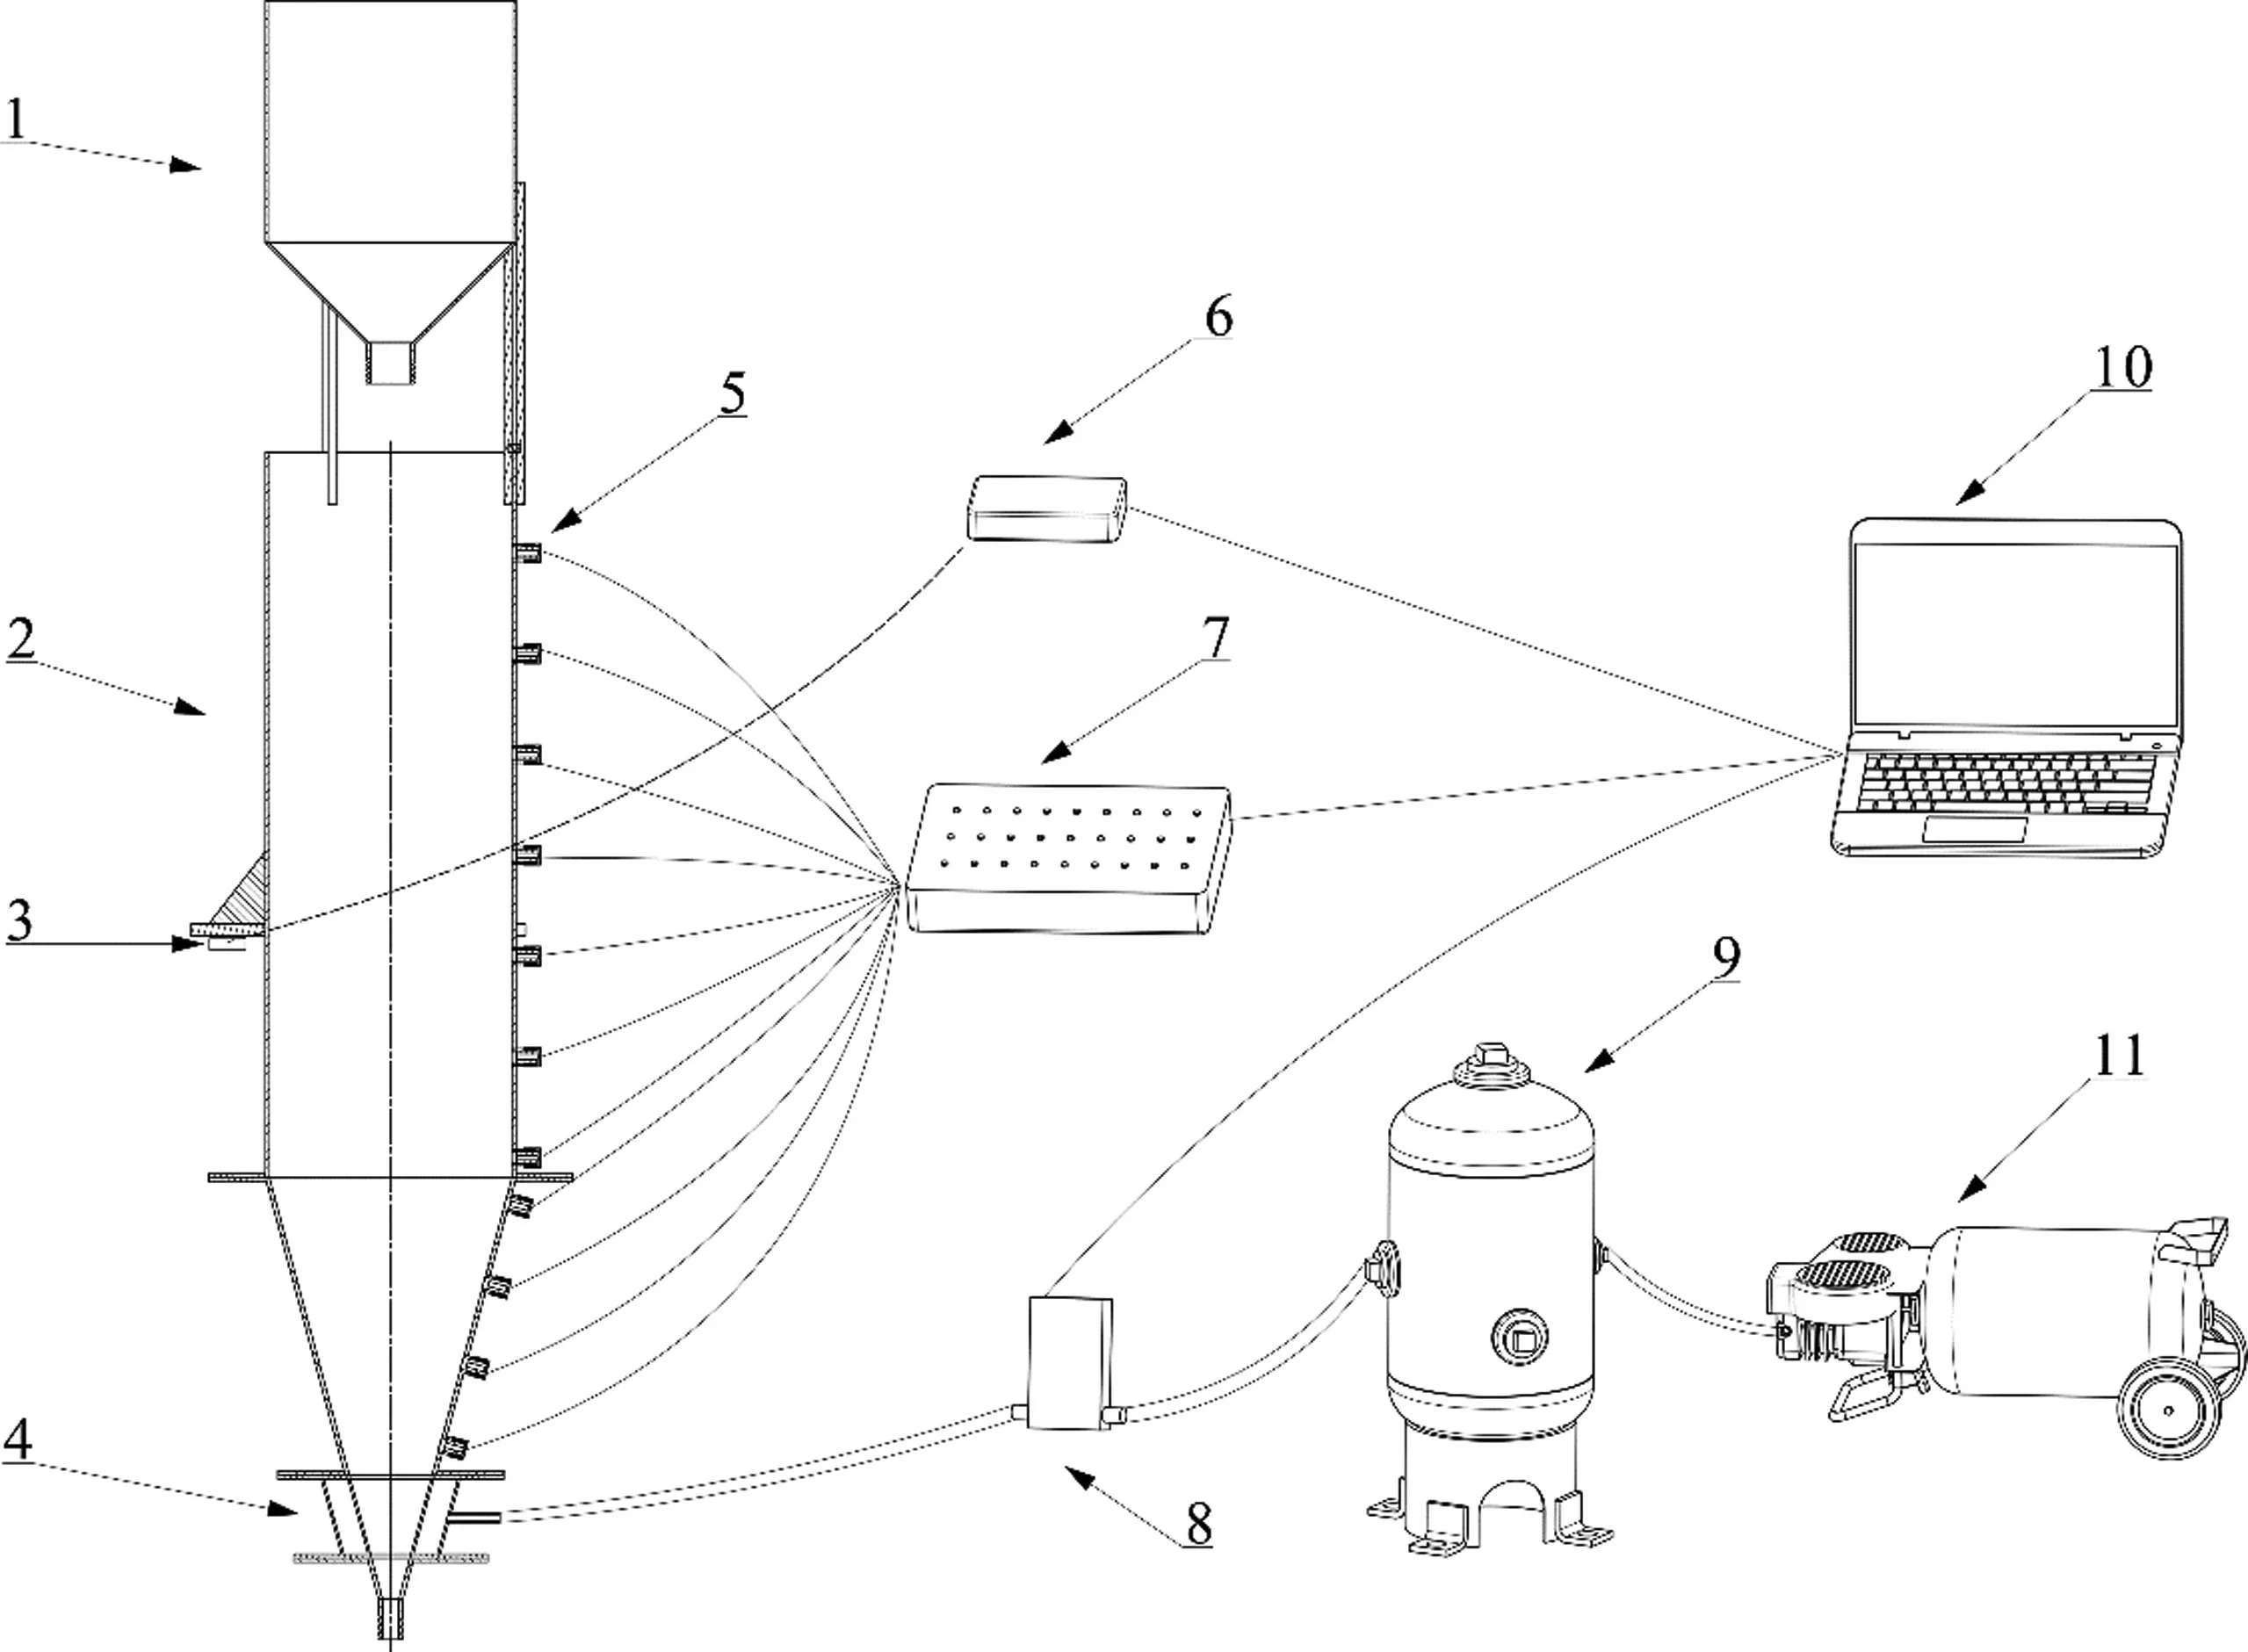
Fig.1. Schematic diagram of the experimental system(1.feed pot,2.experimental silo,3.load cells,4.annular wind chamber,5.pressure sensors,6.data acquisition module,7.strain test analyzer, 8.mass flow controller, 9.air storage tank, 10.computer, and 11.air compressor).

Fig.2. Particle size distributions of M1 and M2 samples.

Fig.3. SEM images of (a) coal and (b) extraction residue.
The critical fluidizing wind speed can be calculated using Eq.(1):

where,dp(m) is particle size,ρp(kg∙m-3) is the true density of the particle,ρg(kg∙m-3)is the gas density,μg(Pa∙s)is the gas dynamic viscosity, andg(m∙s-2) is the gravitational acceleration.
2.3.Experimental procedure
When the ball valve at the bottom of the experimental silo as well as the gas flow rate controller are closed, the materials are poured into the feeding tank, and then injected into the experimental silo so that the material level reaches 80 cm from the bottom of the barrel section.Then, the gas mass flow controller is opened and adjusted to the corresponding working condition.When the wall shear stress readouts are stable, the ball valve at the bottom of the bin is opened for discharging while the mass as well as wall stress data are continuously measured and collected on a real time basis throughout the experimental duration.The above operating procedure is repeated for various working conditions specified in Table 2.Before each experiment, the materials were pre-fluidized with a fluidizing air volume of 0.5 m3∙h-1.
The apparent velocity,Ug, at the air distribution plate is calculated using Eq.(2):

whereri(m)andrj(m)are the radii of the upper and lower boundary parts of the ventilation section,respectively,and θ(°)is the half cone angle of the cone section of the silo.
3.Results and Discussion
3.1.Shear properties
The shear properties of powders are closely related to their flowability.The results are shown in Fig.4 and Table 3.The effective internal friction angle, wall friction angle, as well as the flow function of M2 are greater than those of M1.The flow function of M2 is between 2 and 4,which belongs to the cohesive region,while M1 has a flow function of between 4 and 10,which is easy to flowing.The above results may be caused by the porous structure of the extractives, which were high porosity materials, as well as due to the increase of the specific surface area associated with the samples which leads to an increase in the inter-particle cohesion as well as poor flowability in the absence of gas–solid interactions[16,17].

Table 1Physical properties of the powders

Table 2Operating conditions of the experiments

Fig.4. Flow function of powder samples.
3.2.Stress distribution characteristics
The normal stress at the wall σt(Pa), collected by the sensor,is the sum of the normal stress caused by the powder at the wall σs(Pa) and the gas pressurePg(Pa), as shown in Eq.(3):

Several typical trajectories for the full stress signal were plotted by taking about 10 s before the moment of fluidizing wind opening as the zero point of the transverse coordinate,as shown in Fig.5.It is clear that the wall stress is elevated with the opening of the fluidizing wind.When the apparent gas velocity of the fluidizing wind is small, the wall stress is raised more slowly and there is almost no stress fluctuation after reaching stability as shown in Fig.5(a).At the same time, there is also a more uniform fluidization, where the wall stress falls back slightly after the peak and remains stable at the high level.Moreover, at higher apparent gas velocities, the wall stresses show high-frequency oscillations,indicating the existence of intense gas–solid interactions.
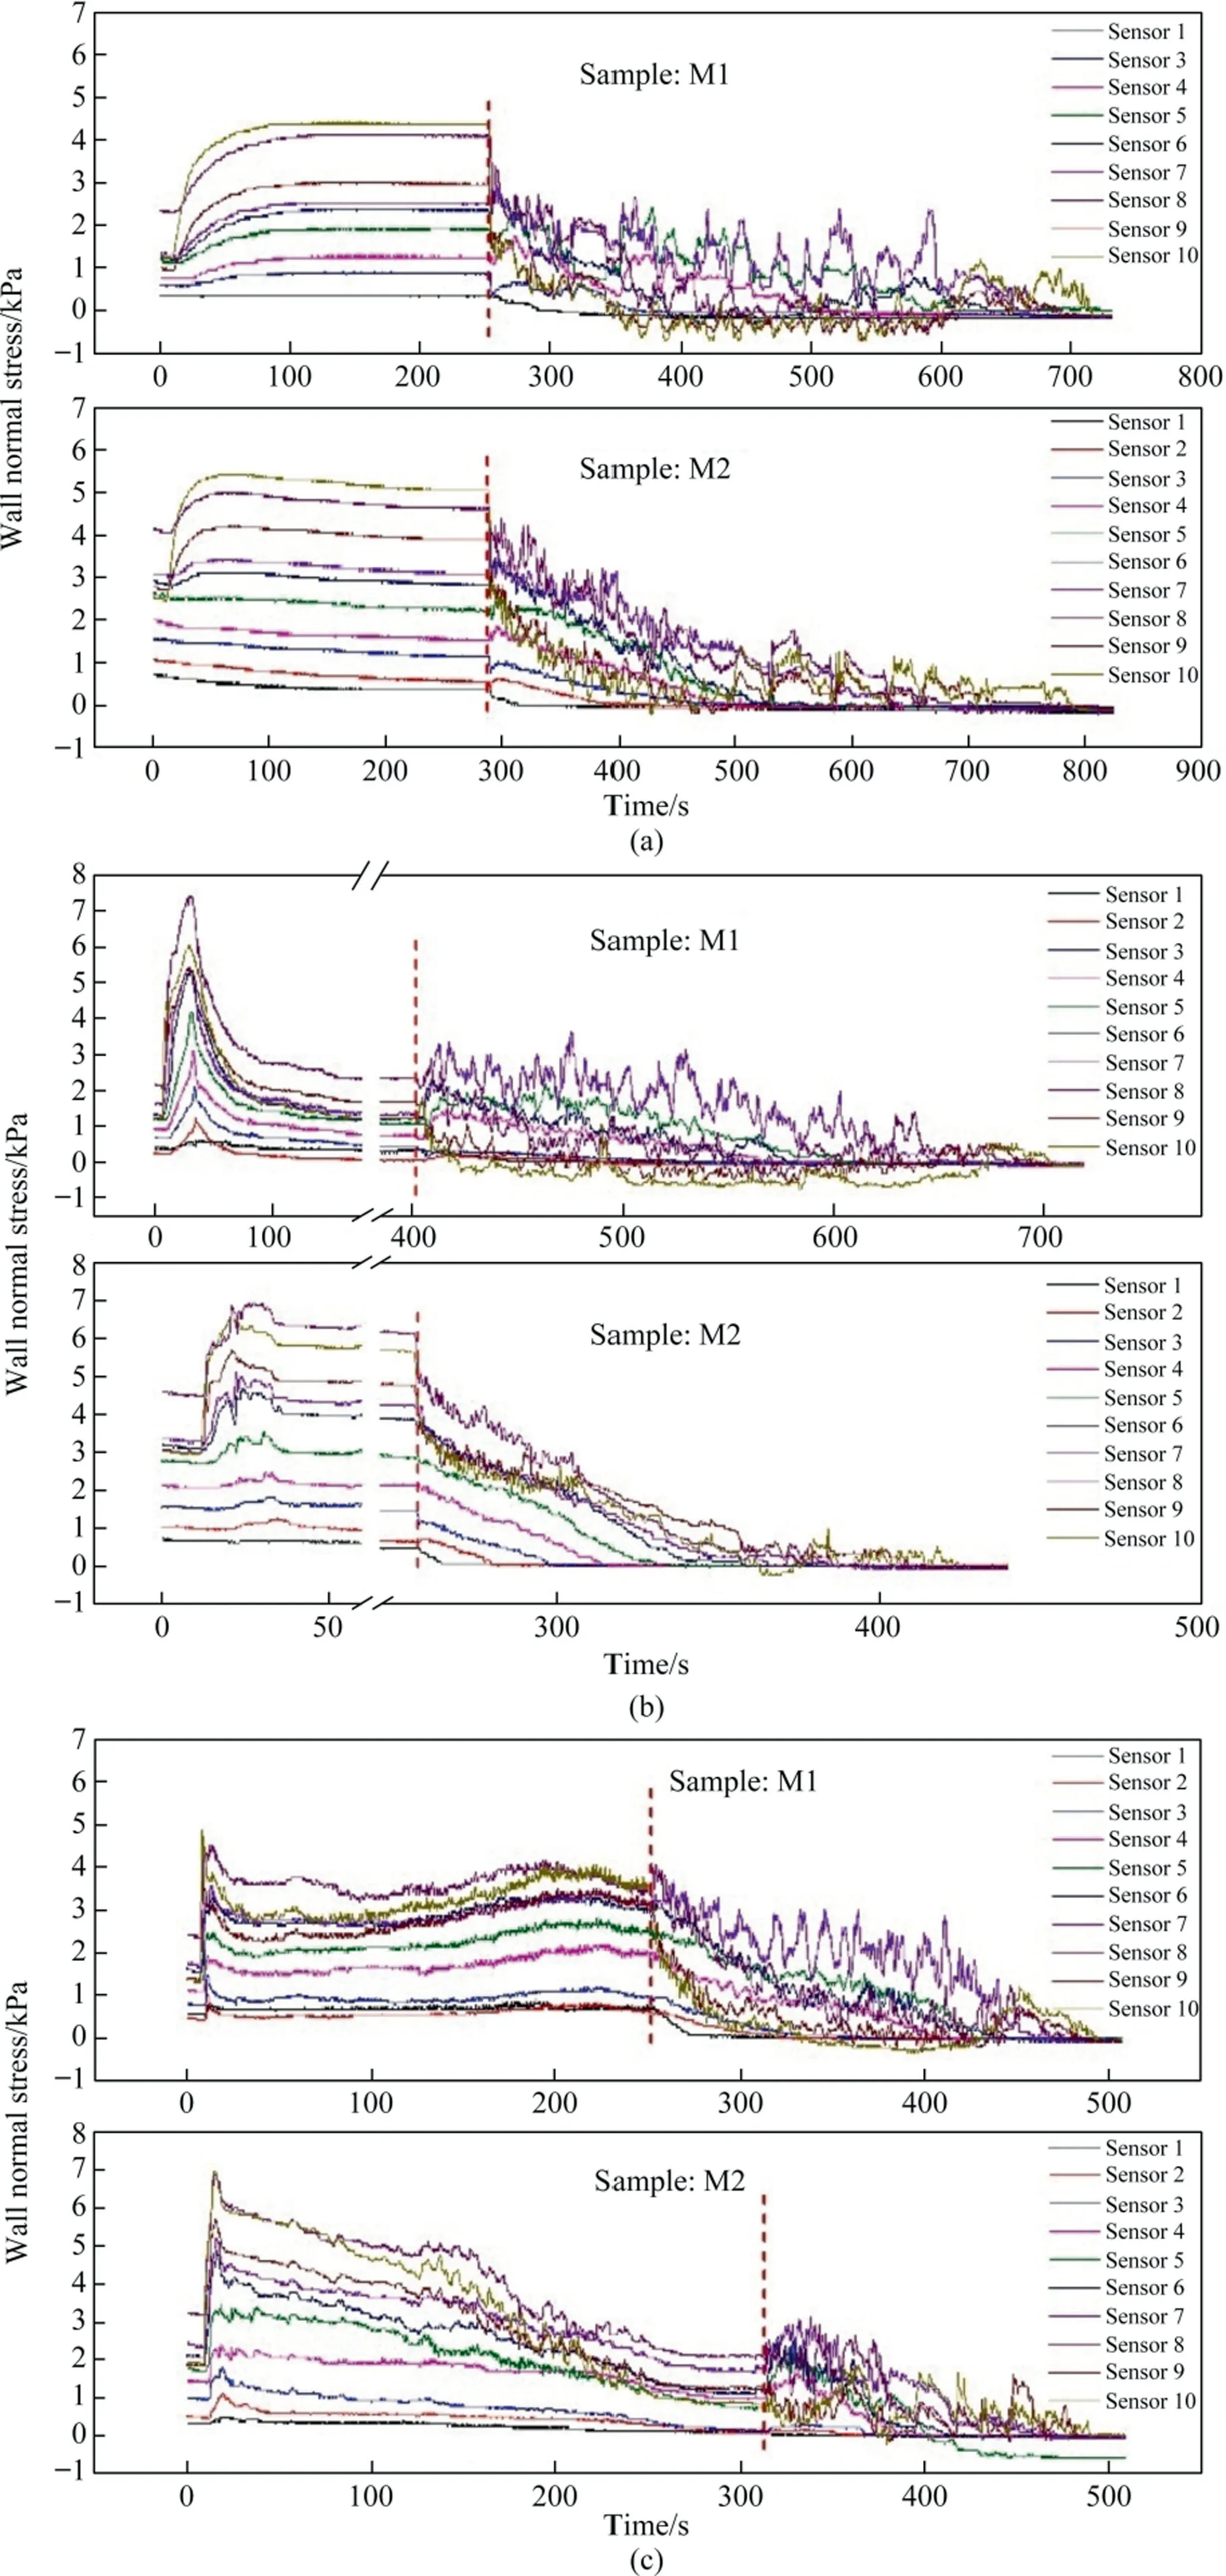
Fig.5. Stress signal trajectories at different fluidization wind speeds: (a) Ug=0.6 mm∙s-1, (b) Ug=2.4 mm∙s-1, (c) Ug=4.9 mm∙s-1.
The time required for the wall stress to peak after turning on the fluidizing air is given in Fig.6,which clearly has a decreasing trend with respect to increasing the apparent air velocity.At higher air velocities, only 1 s is required to reach the peak stress.The relatively short time required forUg=0.6 mm∙s-1is due to its high void fraction just after fluidization at high gas velocities.

Fig.6. Time required to reach peak stress in the local fluidization phase.
The wall stress distribution after reaching stability is shown in Fig.7.From this figure, the trend of stress distribution along the vertical direction is basically the same as that without fluidization except for the lowermost sensor No.10.Sensor No.10 was installed directly above the conical air distribution plate, where there is an obvious stress elevation.If the powder is fluidized as a whole, the normal stress on the wall should decrease gradually from the bottom to the top.As evident in Fig.7, this trend is not present, and the powder in the silo was in a localized fluidization state under the selected working conditions, which is consistent with the actual industrial application scenario.
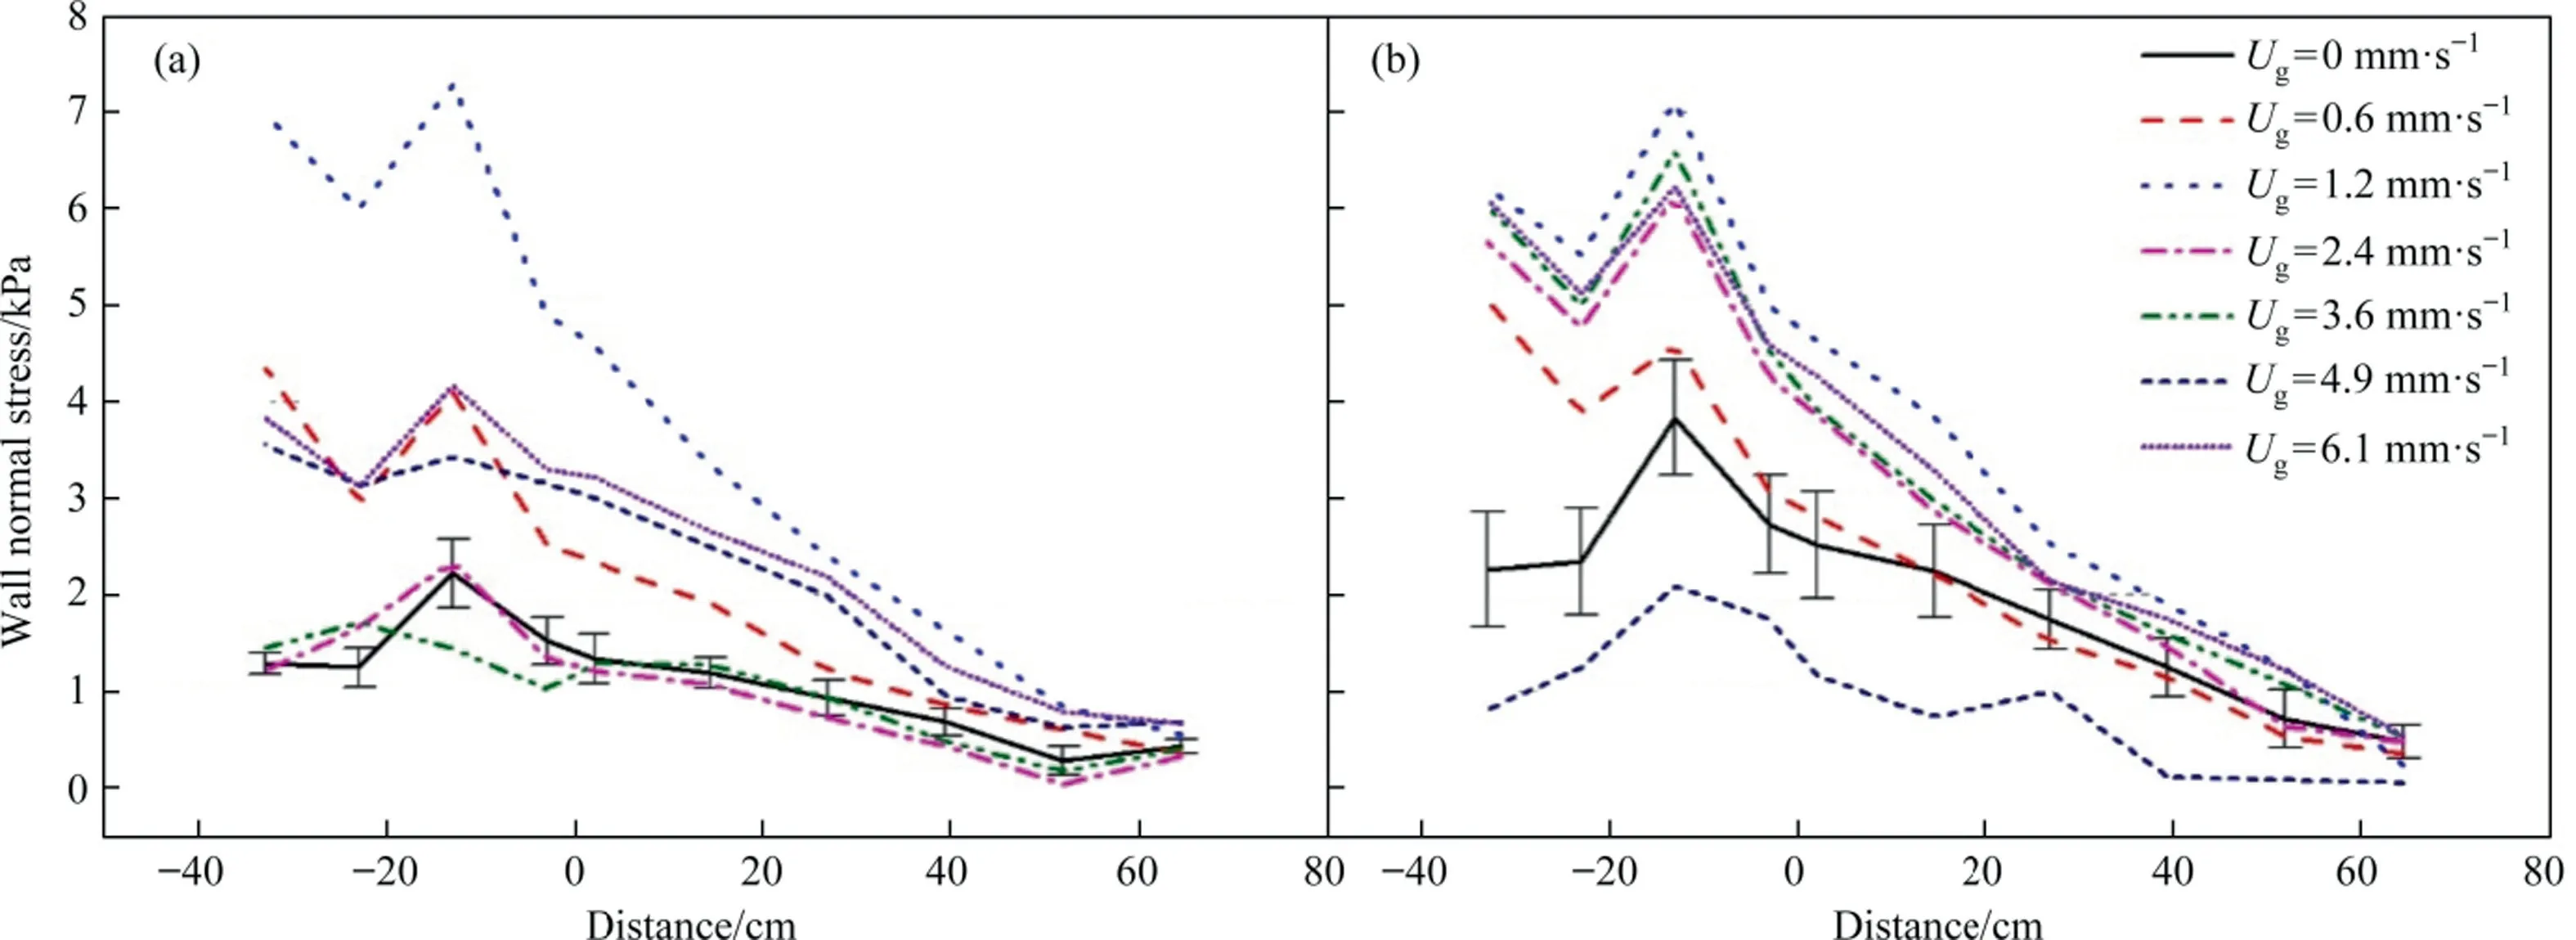
Fig.7. Stress distributions at different fluidization wind speeds during the fluidization stabilization stage: (a) M1, (b) M2.
From Fig.5,it was also found that after the discharge valve was opened,there is a rapid and significant change in the stress values at all measurement points, with the peak of stress distribution occurring at the locations of sensors 7 and 8 at the top of the cone section.The wall stress values at the top of the cone section during the initial stage of discharging are given in Fig.8.From Figs.5 and 8, it is found that after opening the discharge valve, the gas phase almost always flows out through the bottom discharge port, and the stress distribution is more similar to that of the pure gravity discharge case,and the peak value is reached at the top of the cone section.Moreover,the stress values under each working condition are similar,and there is a weak correlation with the stress state in the fluidization stage.

Fig.8. Wall stress values at the top of the cone section during the initial stage of discharging.
3.3.Discharge characteristics
When fluidizing air was not applied, the powder in the bin could not be discharged.In Fig.9, the remaining mass–time series curve for the discharging process after application of the air fluidization is plotted.From Fig.9(a), it is concluded that the pulverized coal in the bin can be discharged autonomously at an apparent air velocity of 0.6 mm∙s-1.The discharge process of M1 is smoother than that of M2,which is consistent with the shear characteristics of the powders.Meanwhile,there is a smooth step in the discharging curve of M2, during which the apparent air velocity is very small, which indicates that the fluidizing air mainly plays the role of arch breaking under this working condition.With the increase of apparent air velocity, the mass–time curve of M2 becomes smoother and more linear.
The mass flow rates for the full discharge as well as the stabilization phase (i.e., middle 1/3 of the full discharge) periods for all the operating conditions are displayed in Fig.10(a) and (b),respectively.The mass flow rate of the whole process is obtained as the mass difference before and after the discharge compared to the discharge time.In addition, the mass flow rate during the stabilization stage is the slope of the linear trend fitted over the mass-time plot during the stabilization section.For the case of small apparent gas velocity, evaluating the mass flow rate for the whole process seems more reasonable.Irrespective of the evaluation method of the mass flow rate, it was obtained that the mass flow rate of M1 and M2 increases first and then slowly decreases.Moreover, the mass flow rate of M2 is larger than that of M1 at the same gas velocity condition.In addition, the analysis of standard deviation as well as standard deviation coefficient of the instantaneous downstream flow rate reveals that for most cases,the discharge stability of M2 is greater than that of M1 (Table 4).At the apparent gas velocity of 3.7 mm∙s-1,the discharge mass flow rate of M2 reaches a peak point while having the minimum fluctuations in the mass flow rate behavior.This resulted in about 65%improvement in the discharge mass flow rate of M2 compared to M1 at the same working conditions (Fig.11).
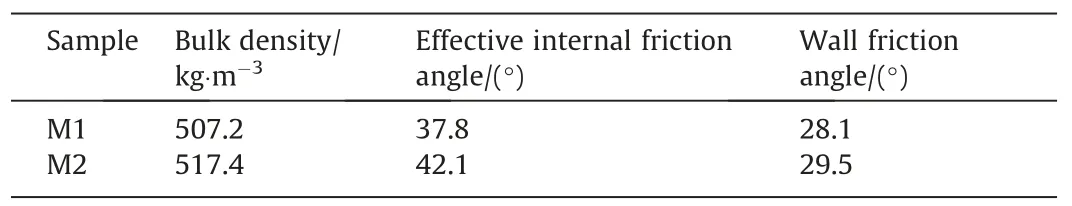
Table 3Shear properties of powder samples
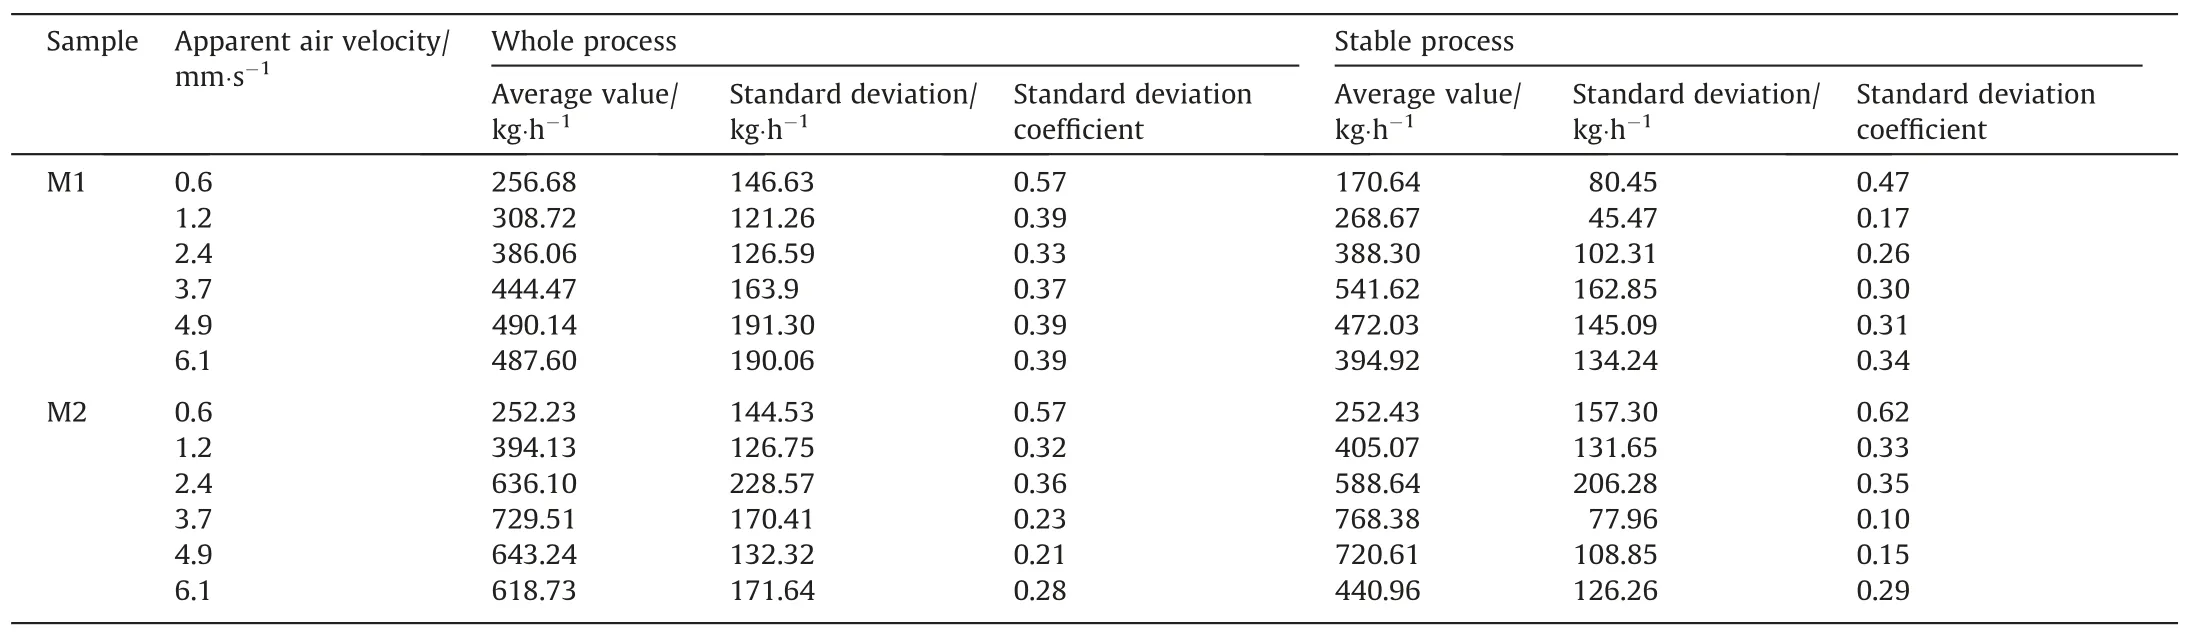
Table 4Mass flow rate fluctuations
When the apparent velocity is small,the fluidizing air promotes the discharge process mainly through breaking the arch and eliminating the local negative pressure at the discharge port.As most of the fluidizing air flows out of the bin through the outlet, the entrainment capacity of the gas increases with increasing the apparent gas velocity at the air distribution plate, which in turn increases the discharge mass flow rate.With the further increase of the apparent gas velocity, the gas phase cannot escape through the outlet quickly, resulting in formation of air pressure arch near the outlet, which leads to the decrease of the discharge mass flow rate.The relatively high discharge mass flow rate of M2 may be due to the high porosity and large specific surface area associated with the extractive residue compared with the pure pulverized coal.The M2 sample mixed with the extractive residue is more likely to agglomerate under the greater apparent air velocity and participate in the local fluidization and discharge with the formation of larger particle size agglomerates, which exhibits the properties of Geldart A type powder, thus improves the mass flow rate and stability of the discharge.
3.4.Relationship between the stress and discharge characteristics
Although the discharge mass flow rate is more strongly influenced by the apparent gas velocity, it was found that the wall stress signal during the discharging process to some extent reflects the discharge characteristics as displayed in Fig.12 [18,19].
The wall stressvs.mass correspondence curve for the M1 powder at an apparent gas velocity of 1.2 mm∙s-1is shown in Fig.12(a).There is an obvious transition point for the mass flow rate data during the feeding process as indicated by the red dashed line Fig.12(a).Before this transition point, the mass flow rate is low,and there is a negative pressure for a long period of time near the air distribution plate at the bottom of the cone section.After this transition point, the mass flow rate increases and the wall stress changes to a positive value.When the apparent gas velocity is less than 2.4 mm∙s-1, the M1 powder clearly shows the above characteristics.This is due to the fact that the fluidizing wind makes the particles flow faster near and below the air distribution section while there is a dynamic arch above the air distribution section,and the rate/amount of the falling materials is slower/less to replenish the lost space of particles in time, resulting in local negative pressure.With the increase of apparent gas velocity, the gas phase can replenish to eliminate the negative pressure and improve the dynamic arch formed above at the same time, which is likely the reason why there is no obvious transition point at greater apparent gas velocity values.

Fig.9. Powder mass–time series curve during the discharge process: (a) Ug=0.6 mm∙s-1, (b) Ug=3.7 mm∙s-1, (c) Ug=6.1 mm∙s-1.

Fig.10. Effects of air velocity on the mass flow rate of powders (a) during the entire discharging process and (b) during the stable discharging process.
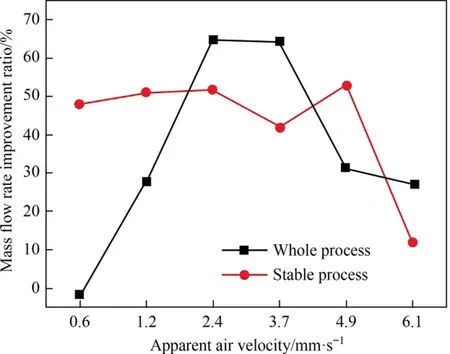
Fig.11. Effect of blendingextraction residue on the mass flow rate of powders.
The wall stress versus mass correspondence curve for the M2 powder at an apparent gas velocity of 0.6 mm∙s-1is displayed in Fig.12(b).The apparent gas velocity is small at this working condition, and the M2 powder is not agglomerated and shows the characteristics of a viscous powder.Although the material can be discharged with the assistance of the fluidizing air, there is intermittent stopping at some moments as indicated by the blue dashed box in Fig.12(b), where localized elevation in the wall stress is observed.When the pressure rises to a certain level, the air pressure breaks the static arch and the discharge restarts again.
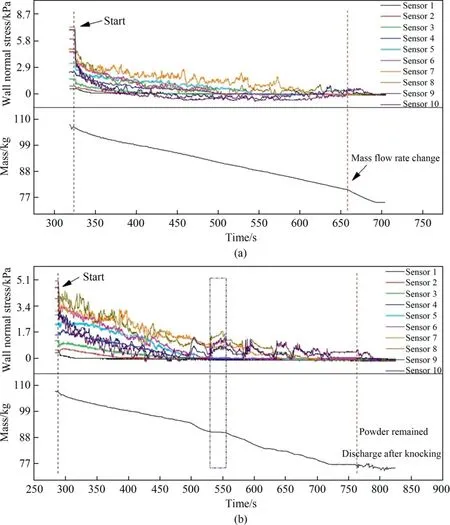
Fig.12. Relationships between the wall stress and powder mass flow rate during the discharge process: (a) M1, Ug=1.2 mm∙s-1, (b) M2, Ug=0.6 mm∙s-1.
4.Conclusions
In this study,we carried out experiments to study the discharge characteristics of coal liquefaction residue extractives blended with pulverized coal using an atmospheric pressure partial fluidization bin.The following conclusions are drawn from this study:
(1) The conventional shear characteristics of the two tested powders show that the flow function of M2 was between 2 and 4, representing the cohesive region, while that of M1 was mostly between 4 and 10,showing‘‘easy to flow”characteristic.The high porosity, large specific surface area and high cohesion of M2 (i.e., blended powder) reduce its mobility.
(2) After turning on the fluidizing air, the wall stress rapidly increased and then stabilized at different stress states according to the fluidization of the bed.After reaching stability, the trends for wall stress distribution along the vertical direction was basically the same as that without fluidization except for sensor No.10, and the bin was in a local fluidization state.When the discharge valve became open,the stress distribution state was more similar to that of the pure gravity discharge, and all the stress values reached their peak value at the upper part of the cone section.Moreover, the stress values under each working condition were also similar, and there was a weak relationship with the stress state in the fluidization stage.
(3) The mass flow rate of both M1 and M2 powders first increased, and then decreased slowly with the increase of the apparent velocity of the fluidizing wind.When the apparent velocity was small,the fluidizing wind mainly promoted the discharge by breaking the arch and eliminating the local negative pressure at the outlet.By increasing the apparent gas velocity,the effect of gas fluidizing on the powder and entrainment ability was increased, which in turn improved the discharge mass fluid.By further increasing the apparent gas velocity, part of the gas could not escape quickly through the outlet, and formed a stress arch which reduced the discharge mass flow rate.
(4) For most cases,the discharge mass flow rate and stability of M2 were greater than those of M1.For M2 powder, the discharge mass flow rate reached a peak while its fluctuations became minimal at an apparent gas velocity of 3.7 mm∙s-1.This resulted in an improvement of 65% in discharge mass flow rate compared with that of M1 at similar working conditions.This is probably due to the fact that the mixing of extractive residues could easily form larger size agglomerates to participate in local fluidization and discharge, which exhibited the properties of Geldart A type powder and thus improved the mass flow rate and stability of the discharged material.
(5) The stress signal at the wall during the discharging process reflected the discharge characteristics to a certain extent,but it needed to be reasonably analyzed according to each particular situation.At the time of stagnation of the discharge,the wall stress showed a more obvious increase,followed by a decreasing trend when the discharged was continued.
Declaration of Competing Interest
The authors declare that they have no known competing financial interests or personal relationships that could have appeared to influence the work reported in this paper.
Acknowledgements
The authors would like to express their gratitude to Edit Springs(https://www.editsprings.com/) for the expert linguistic services provided.
杂志排行
Chinese Journal of Chemical Engineering的其它文章
- Preparation of lithium carbonate by microwave assisted pyrolysis
- Simulation and design of a heat-integrated double-effect reactive distillation process for propylene glycol methyl ether production
- Hyper-parameter optimization of multiple machine learning algorithms for molecular property prediction using hyperopt library
- High-efficiency and safe synthesis of tonalid via two Friedel-Crafts reactions in continuous-flow microreactors
- Improvement of synergistic effect photocatalytic/peroxymonosulfate activation for degradation of amoxicillin using carbon dots anchored on rod-like CoFe2O4
- Boosting the hydrogen storage performance of magnesium hydride with metal organic framework-derived Cobalt@Nickel oxide bimetallic catalyst