Hyper-parameter optimization of multiple machine learning algorithms for molecular property prediction using hyperopt library
2023-01-30JunZhangQinWangWeifengShen
Jun Zhang, Qin Wang, Weifeng Shen,3,*
1 School of Chemistry and Chemical Engineering, Chongqing University, Chongqing 401331, China
2 School of Chemistry and Chemical Engineering, Chongqing University of Science & Technology, Chongqing 401331, China
3 Chongqing Key Laboratory of Theoretical and Computational Chemistry, Chongqing 400044, China
Keywords:Machine learning Prediction Optimal design Hyper-parameter optimization Hyperopt library
ABSTRACT Due to outstanding performance in cheminformatics, machine learning algorithms have been increasingly used to mine molecular properties and biomedical big data.The performance of machine learning models is known to critically depend on the selection of the hyper-parameter configuration.However,many studies either explored the optimal hyper-parameters per the grid searching method or employed arbitrarily selected hyper-parameters, which can easily lead to achieving a suboptimal hyper-parameter configuration.In this study, Hyperopt library embedding with the Bayesian optimization is employed to find optimal hyper-parameters for different machine learning algorithms.Six drug discovery datasets,including solubility,probe-likeness,hERG,Chagas disease,tuberculosis,and malaria,are used to compare different machine learning algorithms with ECFP6 fingerprints.This contribution aims to evaluate whether the Bernoulli Naïve Bayes,logistic linear regression,AdaBoost decision tree,random forest,support vector machine, and deep neural networks algorithms with optimized hyper-parameters can offer any improvement in testing as compared with the referenced models assessed by an array of metrics including AUC,F1-score,Cohen’s kappa,Matthews correlation coefficient,recall,precision,and accuracy.Based on the rank normalized score approach,the Hyperopt models achieve better or comparable performance on 33 out 36 models for different drug discovery datasets, showing significant improvement achieved by employing the Hyperopt library.The open-source code of all the 6 machine learning frameworks employed in the Hyperopt python package is provided to make this approach accessible to more scientists, who are not familiar with writing code.
1.Introduction
Recent advances in computational capabilities and data analysis and inference techniques have provided opportunities for various fields of data science, including material and medicinal science[1].Meanwhile, the exponentially increase in the volume of available compound property and biomedical data [2], mainly from high throughput screening(HTS)assays,make data-driven analysis become a routine procedure in various chemical and biological applications, including virtual screening [3], chemical property prediction [4], and quantum chemistry calculations [5].
Due to the outstanding performance in cheminformatics, deep neural network (DNN) [6], support vector machine (SVM) [7],logistic linear regression (LLR) [8], Bernoulli Naïve Bayes (BNB)[9], AdaBoost decision tree (ABDT) [10], random forest (RF) [11],and others[12]have been increasingly used to mine the compound activity and biomedical big data.
The performance of DNNs and other machine learning methods is known to critically depend on the choice of the hyper-parameter configurations [3].However, the published studies either employed arbitrarily selected hyper-parameters [13] or explored the hyper-parameters through the grid searching method [13,14].The grid search method works well in searching the entire search space and the global optimal solution can be achieved when the interval of grid search is employed small enough[15],while a huge amount of computing resources will be consumed.Typically,machine learning models training on different datasets correspond to different optimal hyper-parameters [16], and therefore there would be a very small probability of empirically selecting the optimal hyper-parameters as shown in Fig.1(a), (c), and (d).
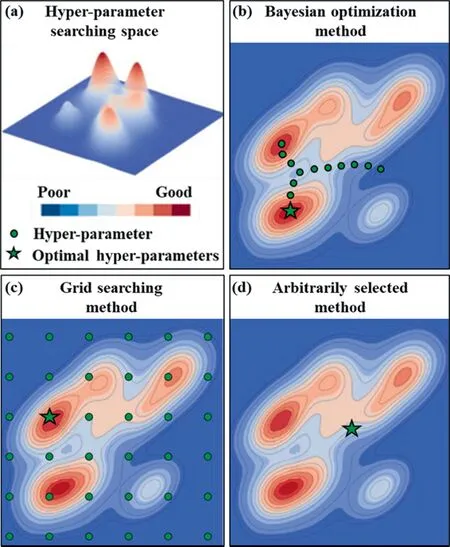
Fig.1. The result of hyper-parameter optimized in the (a) hyper-parameter searching space by(b)Bayesian optimization,(c) grid searching,and (d)arbitrarily selected methods.
Fortunately, one of the most efficient and promising optimization methods, namely the Bayesian optimization method [17], is widely applied to tune the hyper-parameters [18].The efficiency of this optimization algorithm makes it appropriate to optimize hyperparameters of machine learning algorithms that are slow to be trained,as shown in Fig.1(a)and(b).As iterated over and over,the algorithm balances its needs for exploration and exploitation taking into account what it knows about the target function.When targeting the optimal hyperparameters in the search space, a tree Parzen estimator [19] (TPE) is fitted to the points previously explored, and the posterior distribution, combined with an exploration strategy (such as upper confidence bound, or expected improvement), are used to determine the next point that should be explored.This process is designed to minimize the number of steps required to find a combination of parameters that are close to the optimal combination.The Hyperopt package in Python provides Bayesian optimization algorithms and parallelization infrastructure for implementing hyper-parameters optimization [19].
A recent study by Korotcovetal.[13] (the referenced model in this study) investigated and compared deep neural networks(DNNs) with multiple classic machine learning (CML) models and metrics for quantitative structure-activity relationships (QSARs)[20] applications.The authors employed empirically selected the BNB, ABDT, and DNNs hyper-parameter configuration rather than an exhaustive search of possible hyper-parameter combinations,and a grid searching method with large intervals is used to explore the best hyper-parameters of the LLR, RF,SVM modules.However,to the best of our knowledge, few studies employed the Hyperopt package directly, while most of them are focused on developing a complex in-house encoding implementation with Bayesian optimization algorithms to optimize hyper-parameters.To make matters worse, most so-called models are often not accessible to readers, hereby impeding wider adoption of the machine learning techniques with optimized hyper-parameters [13].
In this study, Hyperopt library embedding with the Bayesian optimization using 5-fold cross-validation is employed to find optimal hyper-parameters for different machine learning algorithms.And the Morgan (extended connectivity fingerprints, ECFP6) fingerprints [21] have been used as the descriptors.In addition, the precision,recall,F1-score,accuracy,Cohen’s kappa(CK),Matthews correlation(MCC),and area under the receiver operating characteristic curve(AUC)are employed to assess the performance of different machine learning models.Rank normalized scores approach[22]is used in this work to evaluate whether the machine learning modules with Hyperopt optimization can make any performance improvement compared to the referenced models.In this contribution, we provide open-source code based on python to integrate data manipulation, machine learning models (i.e., the BNB, LLR,ABDT, RF, SVM, and DNNs), and hyper-parameters optimization(python-based Hyperopt library)using much simpler codes,which make this method accessible to more scientists.
2.Materials and Methods
In this contribution, a systematic procedure for predicting molecular properties using machine learning algorithms with optimized hyper-parameters is proposed as shown in Fig.2.First,several drug discovery datasets are prepared and the ECFP6 fingerprints have been used as the descriptors.Second, the BNBs,LLR, ABDT, RF, SVM, and DNNs are developed for the prediction of molecular properties, and the Hyperopt library is employed to optimize the hyper-parameters.After that,an array of performance metrics has been used to comprehensively compare the proposed models and referenced models.In addition, the rank normalized score approach is used to evaluate these algorithms with optimized hyper-parameters as compared with the referenced models.

Fig.2. A systematic procedure for predicting molecular properties using machine learning algorithms with optimized hyper-parameters.
2.1.Computing
All the computation is done on an 8-core(Intel i9-9900K)server running Windows 10 with 32 GB memory and an NVIDIA TITAN V GPU.The following software modules are installed: PyCharm 2020.2.3 (community edition), Python 3.7.7, Anaconda3 2020.02,scikit-learn 0.23.1, Keras 2.3.1, Tensorflow 2.3.1, hyperopt 0.205,RDKit 2020.03.4.
2.2.Datasets and descriptors
Diverse drug discovery datasets (Table S1 in Supplementary Material) that are publicly available for various types of property prediction are used to develop the property prediction models in this work.The same datasets have been used in the referenced models [13] for comparing the performance of deep learning with multiple machine learning methods for predicting different active properties.The Morgan (extended connectivity fingerprints,ECFP6) fingerprints [21] have been used as the descriptors and the 1024 bins datasets are computed from SMILES files(computed from SDF files) based on RDKit.
2.3.Hyperopt library
Hyperopt [19] package in python provides Bayesian optimization algorithms for executing hyper-parameters optimization for machine learning algorithms.The way to use Hyperopt can be described as 3 steps: 1) define an objective function to minimize,2) define a space over which to search, 3) choose a search algorithm.In this study,the objective function of DNNs and CML methods to minimize is MCC and F1-score, respectively.The searching space of different machine learning methods will be introduced in the next part.The searching algorithm selected in this study is the tree-structured parzen estimator (TPE) approach [19].Although the searching algorithm is the toughest part of Bayesian optimization, it just takes only lines of code to implement in Hyperopt as shown in the Supplementary Material.
2.4.Machine learning algorithms
Machine learning algorithms employed in the work can be categorized as the DNNs and CML algorithms, such as the BNBs, LLR,ABDT,RF,and SVM.The DNNs are developed by using Keras,a deep learning library, and Tensorflow as a backend.All CML models employed in this study are developed, tuned, and validated by using open source Scikit-learn ML python library.Each dataset is split to 80% for hyper-parameters tuning using 5-fold crossvalidation and the rest 20% is used as a test set.An example of the DNNs and CML modules driven by the probe-like dataset using PyCharm software is provided in the Supplementary Material.The searching space of the ML methods employed in the study is summarized in Table S2, and the detailed information on how the DNNs and CML methods are developed can be referred to in the open-source code in the Supplementary Material.
2.5.Performance evaluation
In this work, the machine learning models employed in Korotcovetal.[14]are treated as the referenced models to compare with the performance of the ML modules with optimized hyperparameters(Hyperopt models).Hence the same performance metrics are employed, including precision, recall, F1-score, accuracy,Cohen’s kappa (CK) [23], Matthews correlation (MCC) [24], area under the receiver operating characteristic (ROC) curve(AUC), and the Eqs.(1)–(8) are given below with quantitative ranges.
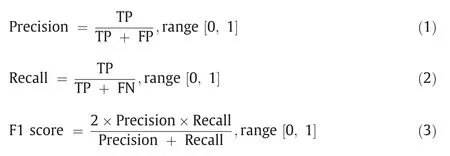
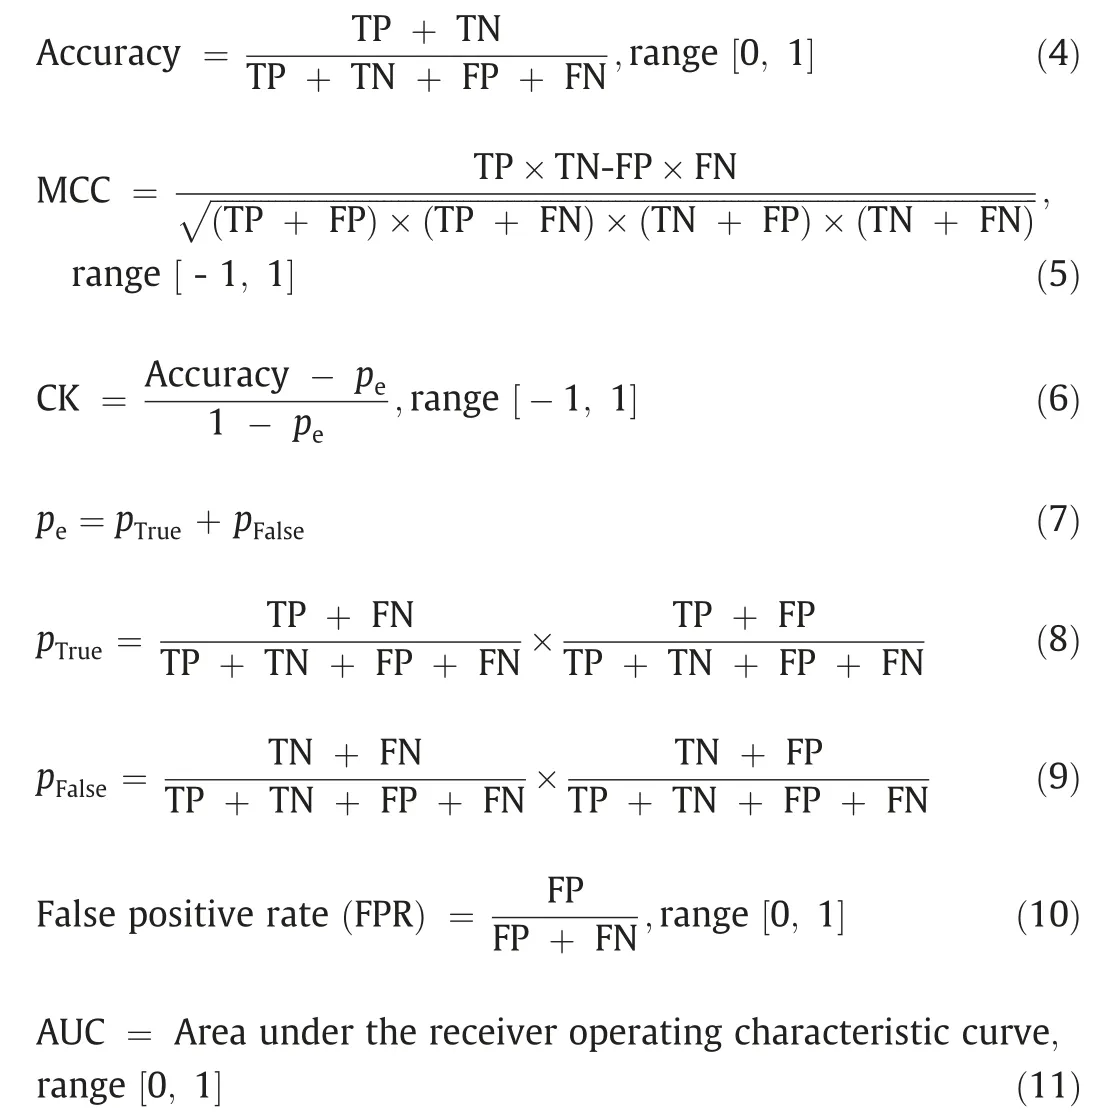
In the equations above,TP,FP,TN,and FN represent the number of true positives,false positives,true negatives,and false negatives,respectively.Precision represents the ratio of the correctly predicted targets(TP)to all positively predicted targets,whereas recall refers to the proportion of correctly predicted labels among all truly positive samples.An unrealistic conclusion may be drawn by using only precision or only recall to evaluate the performance of modules.For example,using only recall as the evaluation metric would result in overlooking the high number of FP predictions,since recall does not take FPs into account.The same case is also applied for the precision and the FNs.To address this issue, as a harmonic mean of precision and recall, F1-score, accuracy, CK,MCC,and AUC are employed to take both the FPs and FNs into consideration.All the metrics mentioned above can be calculated by the Scikit-learn python library.ML modules can perform well on one metric but could perform poorly on other metrics.As such, it is important to assess machine learning algorithms on a broad set of performance metrics.
3.Results and Discussion
The optimal hyper-parameter configures obtained in the searching space for different machine learning methods with 6 datasets have been summarized in Table 1.The AUC, F1-score,accuracy, CK, MCC, precision, and recall values of the DNNs and CML modules with the optimal hyper-parameters for different datasets have been summarized in Table S3-S9, and individual module python files are also provided in Supplementary Material.For clarity, the precision, recall, F1-score, accuracy, CK, MCC, and AUC for both referenced models and hyperopt models have been grouped in the radar plots with each test dataset, as shown in Figs.3–8.
The shape of the radar plots is indicative of the quality of the machine learning models.The larger the circle for the test dataset,the better the model.It is ready to find that the circle of 5 Hyperopt models is larger than that of the referenced models except for the ABDT model for the solubility dataset as shown in Fig.3(c).
Both Hyperopt and referenced models got comparable F1-score,accuracy, CK, MCC, and precision values for the ABDT algorithm with the solubility dataset,whereas the Hyperopt achieve a better recall value but a worse AUC value.For clarity, the normalized score approach is employed to further understand which ABDT model performs better across the performance metrics.The average score across all seven metrics is summarized in Table S10.The average score of the ABDT algorithm for the Hyperopt model is 0.85 and for referenced model is 0.86.In this study,when the difference of rank normalized score between the Hyperopt model and referenced model is equal to or less than 0.01, we considered the two models got a comparable performance.
For the probe-like dataset (see Fig.4), the circles of all the 6 Hyperopt models are observably larger than the referenced models, and the detailed performance metrics and average scores for different machine learning algorithms are summarized in Table S11.The results indicate that outstanding performance is achieved by the Bayesian optimization.
The hERG dataset is a well-balanced example (Fig.5), it is not easy to tell which model is better just from the radar plot.The average scores and different metrics values for different machine learning algorithms with the hERG dataset are calculated in Table S10.The result indicates that the score of referenced model with LLR algorithm(0.75)is better than that of the Hyperopt model(0.73) as shown in Fig.5(b), and the score of the Hyperopt model with ABDT method (0.70) is better than that of referenced model(0.67)as shown in Fig.5(c).The rest of the 4 models are comparable models as the results shown in Table S12.The referenced models and Hyperopt models got comparable performance because an outstanding prediction performance can be easily achieved with a well-balanced dataset.Therefore, we cannot easily improve the performance of the machine learning models just by employing the optimized hyperparameters.
The radar plot for the Chagas disease dataset(Fig.6)shows that BNB, LLR, ABDT, RF, and SVM models with the Hyperopt method outperform the referenced models across the metrics by a large margin and by a small margin on the Hyperopt DNN model.The detailed metrics value and average scores are shown in Table S13.
The tuberculosis dataset for prediction is a tough issue (see Fig.7).From the radar plot,we can figure that the Hyperopt model outperforms the referenced model for the BNB and DNNs algorithms as shown in Fig.7(a) and (f), and the Hyperopt Model and Referenced model are evenly matched in prediction performance for the LLR and SVM algorithms as shown in Fig.7(b)and(e).However, the radar plot of the ABDT and RF algorithms for both the Hyperopt model and referenced model has an irregular shape as shown in Fig.7(c) and (d), it is hard to distinguish which model has better prediction performance just from the plot.The detailed metrics value and average scores are shown in Table S14.From the calculated results we can find that the Hyperopt model and referenced model with the RF algorithm are also comparable models.It is worth noting that the rank normalized score for the Hyperopt model with the ABDT algorithm is 0.39 and the score for the referenced model is 0.44.The main reason is that the Bayesian optimization algorithm may fall into the local minimum and fail to get the global optimal solution [25].Although the tree-structured Parzen estimator (TPE) approach can jump out of the search domain of the local minimum, there is still the probability to get a locally optimal solution for the limited iterations times (30 iterations employed in this study).
The malaria dataset for prediction is a complicated example(Fig.8),the recall value of all referenced models is equal to or bet-ter than that of Hyperopt models,while the Precision,MCC,and CK value of 5 Hyperopt models are much bigger than that of referenced models except the BNB algorithm as shown in Fig.8(a).The average scores of Hyperopt models and referenced models for 6 machine learning algorithms are summarized in Table S15.From the results, we can tell that the Hyperopt models with 5 out of 6 algorithms outperform the referenced models except for the DNNs algorithm.The referenced model with the DNNs is outperform the Hyperopt model by a small margin (0.02).It can be noted that the hyper-parameter configuration of the Hyperopt model for the DNNs summarized in Table 1 is very close to that of referenced models.The early stopping function is employed to avoid overfitting.However, to save computational time, the patience(waiting epochs)is set from 200 to 20.The changes in this parameter may contribute to a small reduction in the predictive performance.
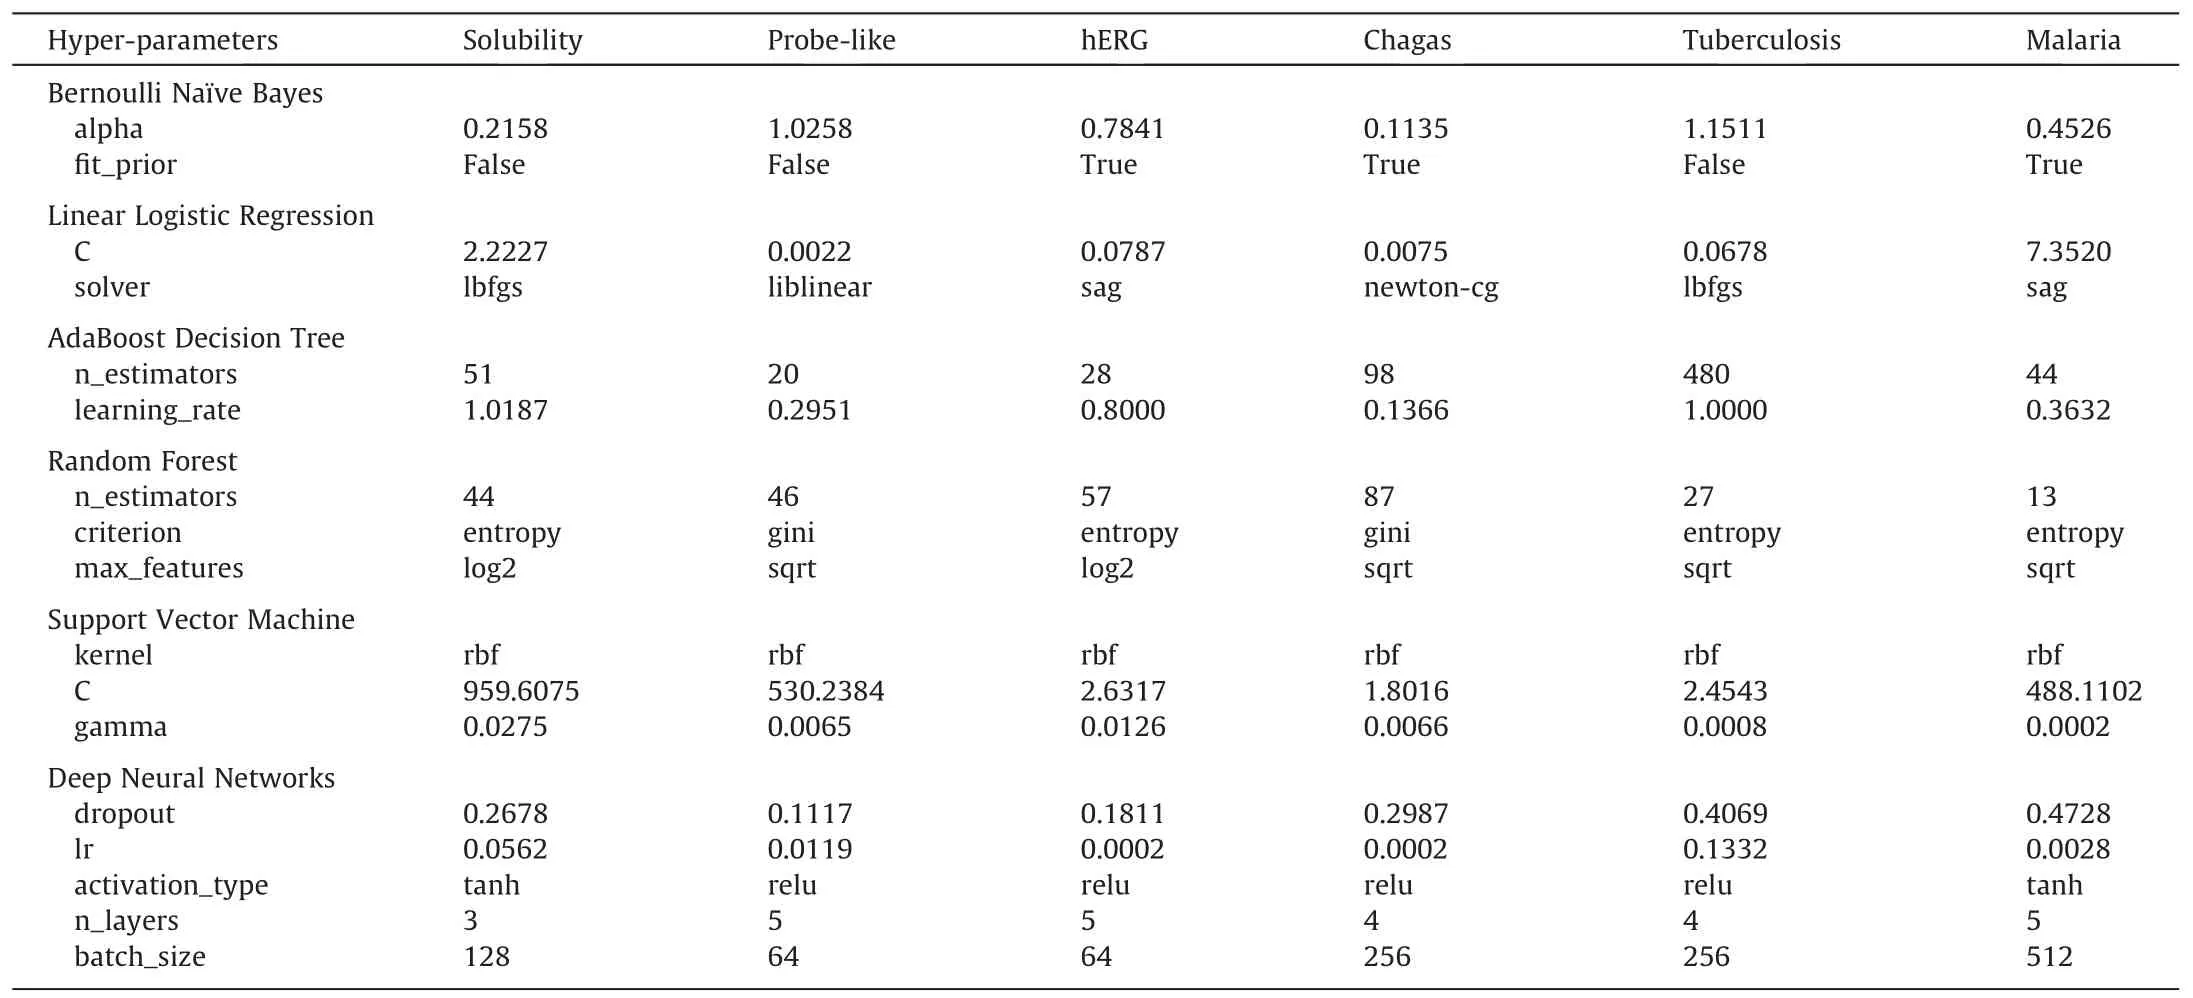
Table 1The optimal hyper-parameter configurations for different machine learning models with different datasets

Fig.3. Rader plot of the referenced models and Hyperopt models for the(a)BNB,(b)LLR,(c)ABDT,(d)RF,(e)SVM,and(f)DNN models with different metrics for the solubility dataset.
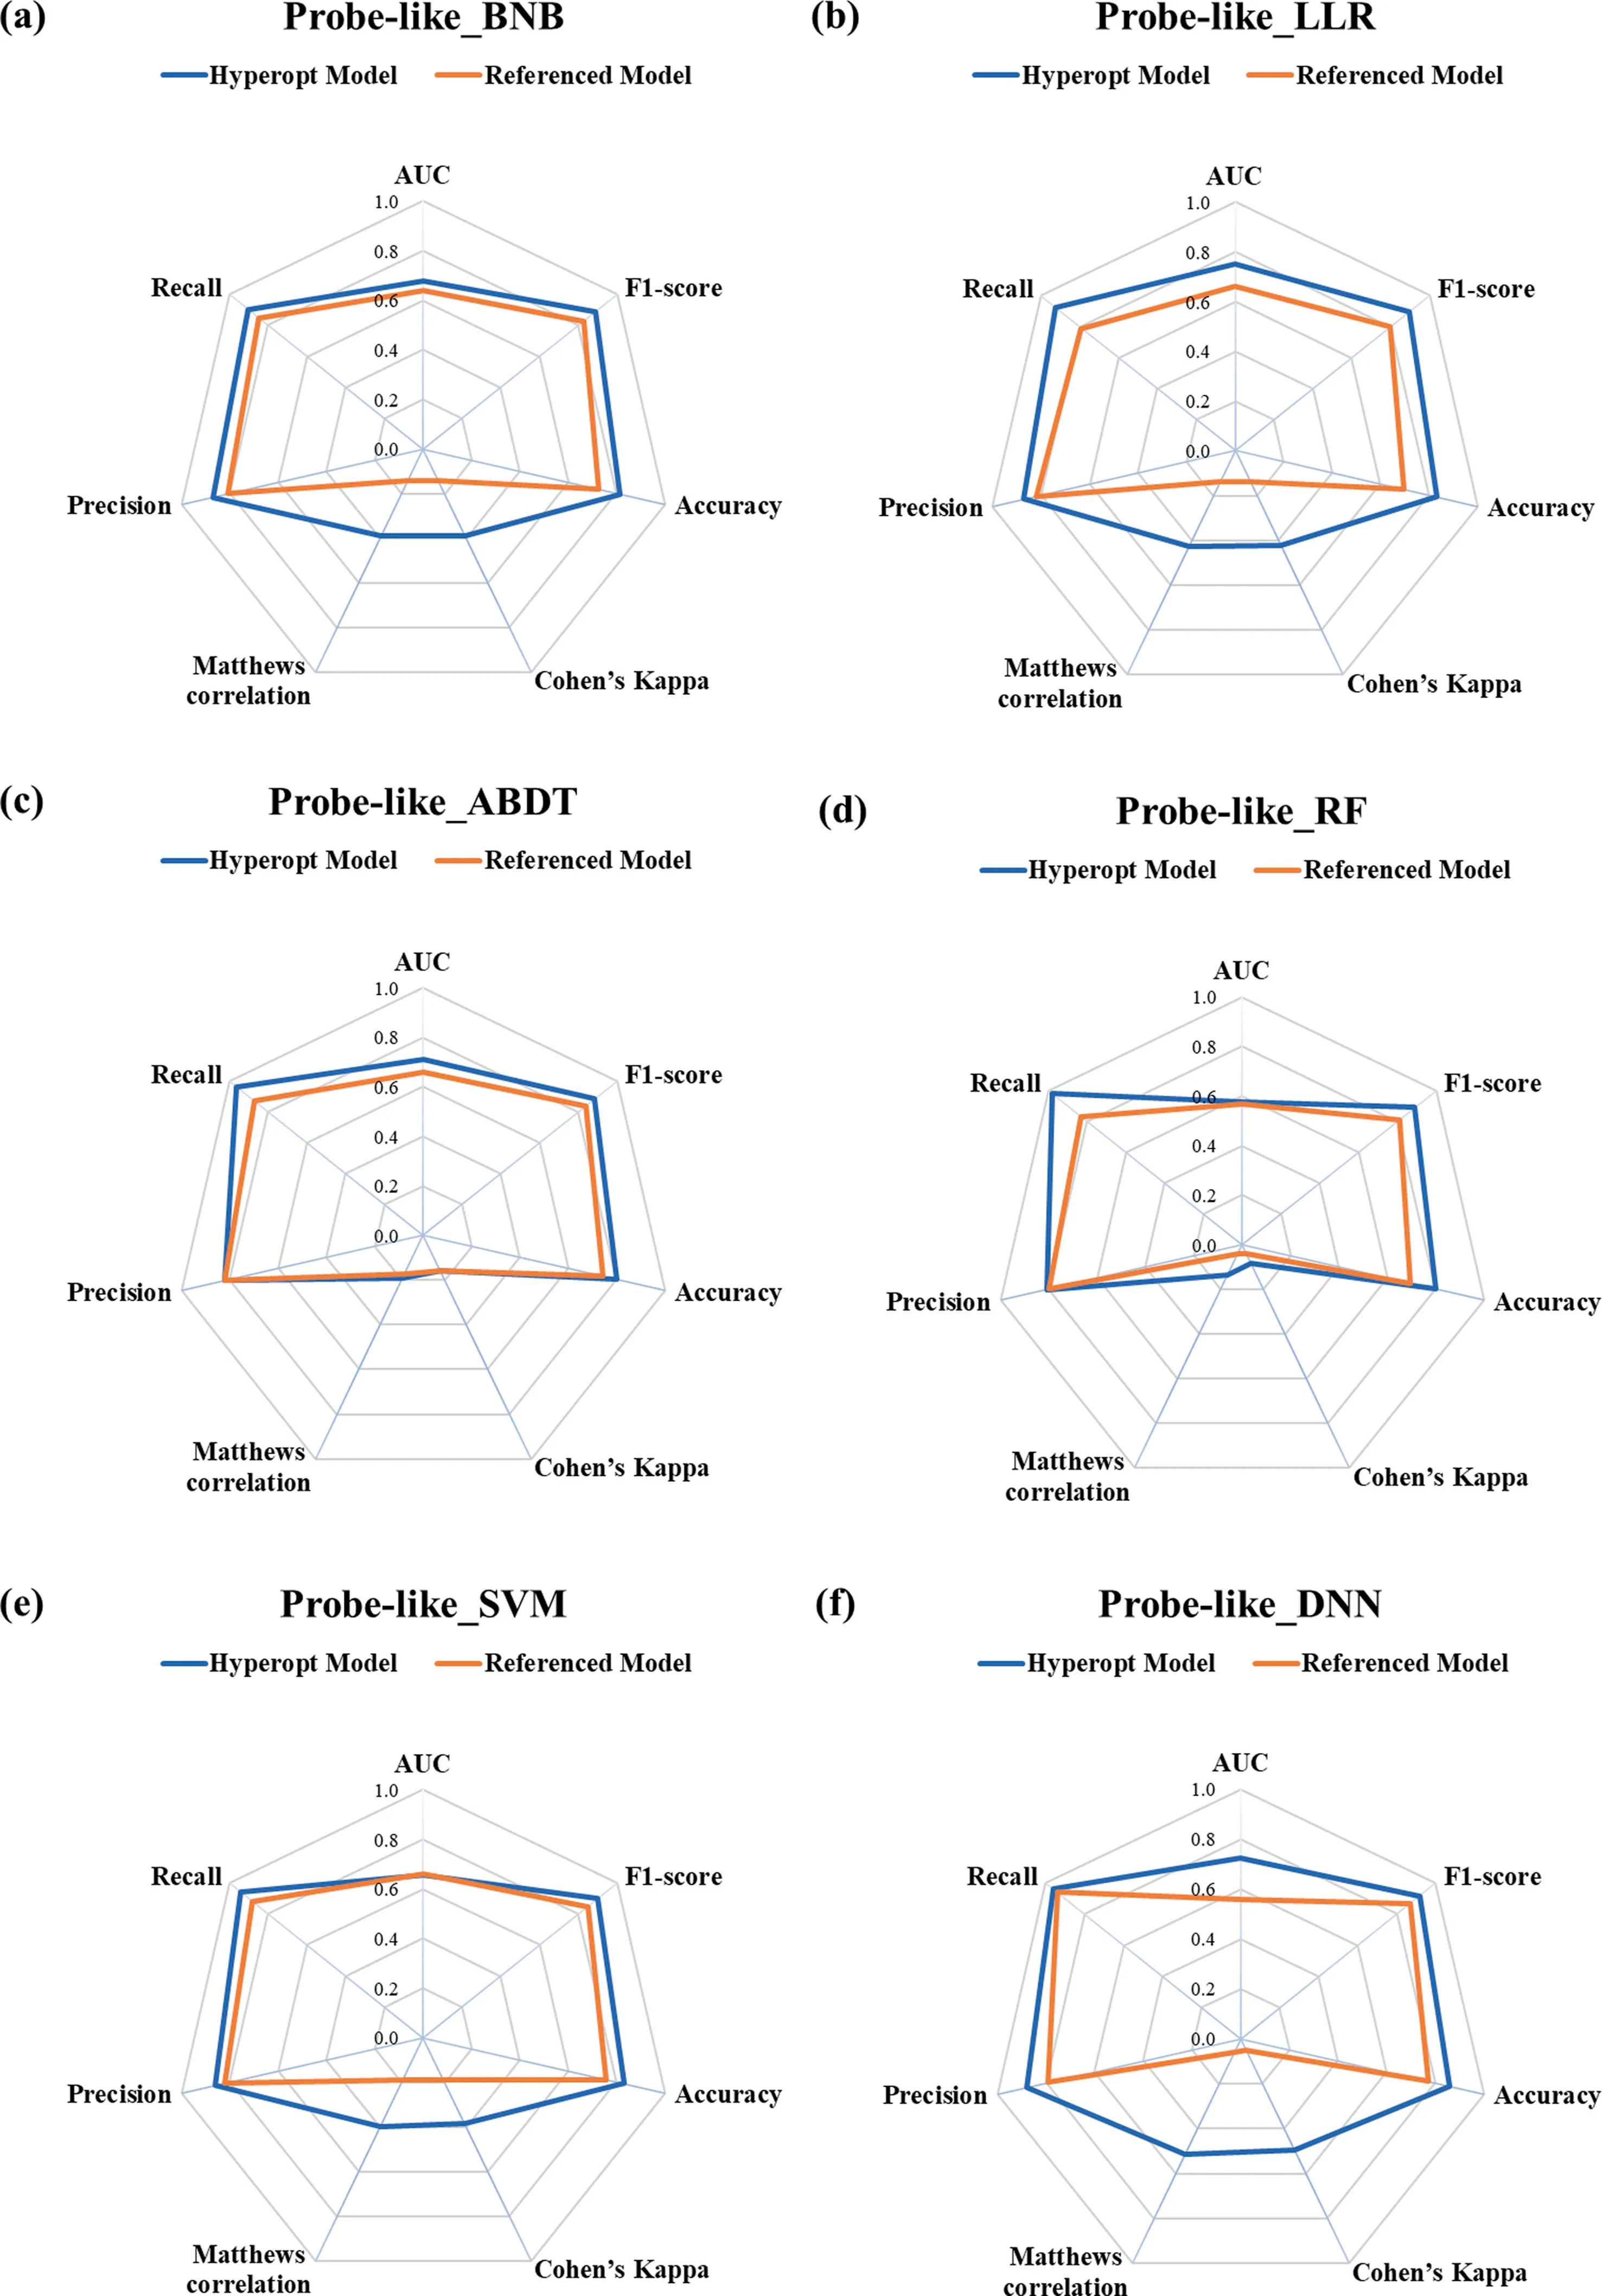
Fig.4. Rader plot of the referenced models and Hyperopt models for the(a)BNB,(b)LLR,(c)ABDT,(d)RF,(e)SVM,and(f)DNN models with different metrics for the probelike dataset.
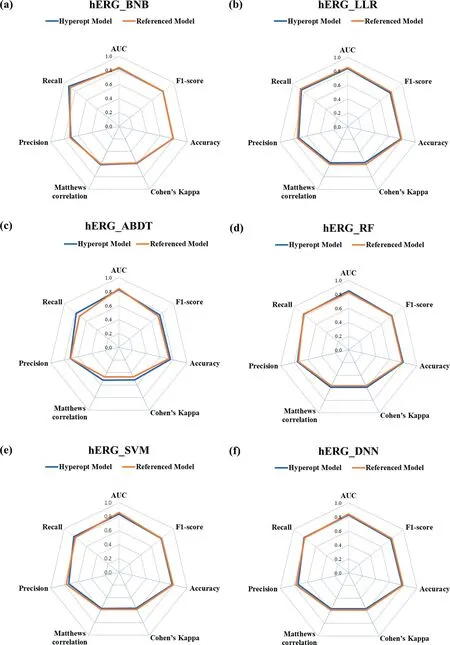
Fig.5. Rader plot of the referenced models and Hyperopt models for the(a)BNB,(b)LLR,(c)ABDT,(d)RF,(e)SVM,and(f)DNN models with different metrics for the hERG dataset.
Rank normalized scores (Table 2) for each machine learning algorithm across all datasets are employed to further understand which models performed best in the case of employing the Hyperopt method.The best performance machine learning algorithms of 5 drug discovery datasets have changed by employing the Hyperopt method compared to the ranked results summarized by Korotcovetal.[13], and the SVM model for tuberculosis performs best with the help of the proposed Bayesian optimization.Therefore,it is unfair to compare machine learning models with sub-optimal hyper-parameters.In addition, as the no free lunch theorem suggests, there is no universally best machine learning algorithm.Even the best models perform poorly on some datasets, and models that have poor average performance perform well on a few datasets or metrics.

Table 2Rank normalized scores for each machine learning algorithm by metrics (average over each dataset for the test dataset)

Fig.6. Rader plot of the referenced models and Hyperopt models for the(a)BNB,(b)LLR,(c)ABDT,(d)RF,(e)SVM,and(f)DNN models with different metrics for the Chagas disease dataset.
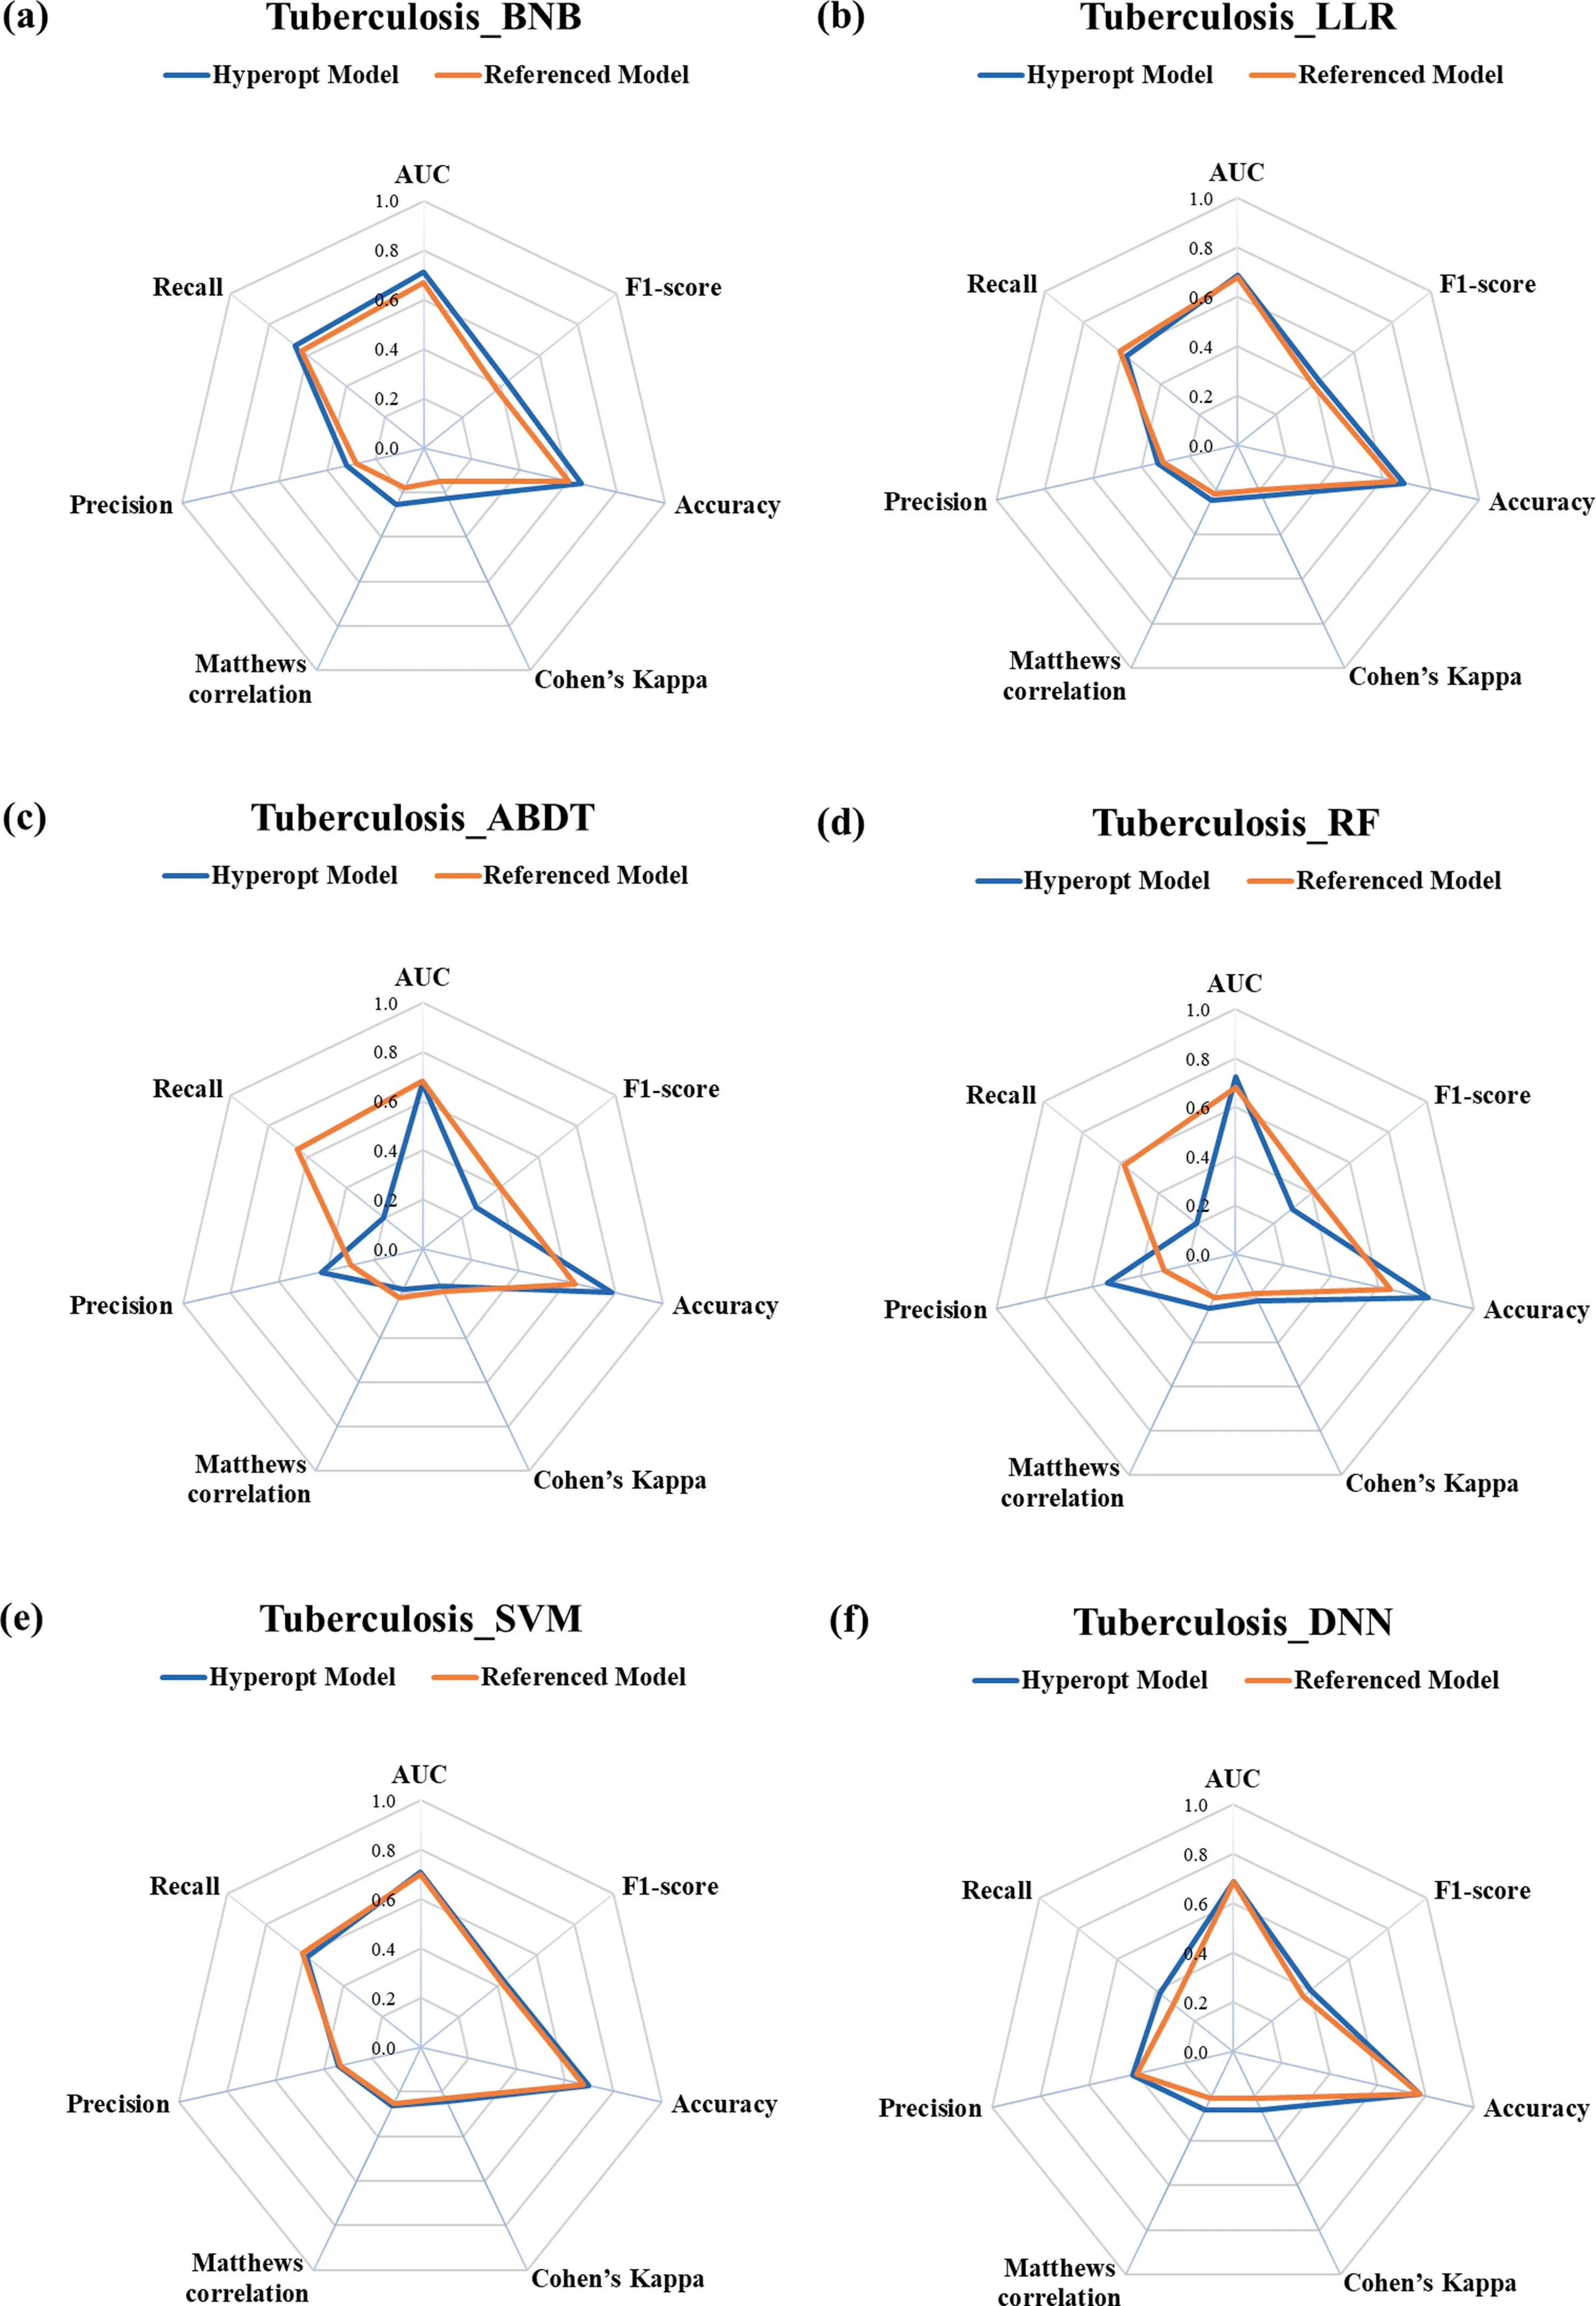
Fig.7. Rader plot of the referenced models and Hyperopt models for the (a) BNB, (b) LLR, (c) ABDT, (d) RF, (e) SVM, and (f) DNN models with different metrics for the tuberculosis dataset.
4.Conclusions
In this study, the approach of Hyperopt Library embedding with Bayesian optimization is employed in different machine learning algorithms to find the optimal hyper-parameters, which is different from most studies relying on grid searching or arbitrary selecting to get the hyper-parameters.In addition, the precision, recall, F1-score, accuracy, Cohen’s kappa, Matthews correlation, and AUC are employed to assess the performance of different machine learning models.And the rank normalized scores approach is used in this contribution to evaluating whether the machine learning modules perform better with the aid of Bayesian optimization as compared with those of the referenced models.

Fig.8. Rader plot of the referenced models and Hyperopt models for the(a)BNB,(b)LLR,(c)ABDT,(d)RF,(e)SVM,and(f)DNN models with different metrics for the malaria dataset.
As it turned out, this study demonstrated that significant improvements are achieved by employing the Hyperopt library embedding with Bayesian optimization compared to the referenced model.The Hyperopt models achieve comparable or better performance on 33 out of 36 models for different drug discovery datasets.Although the tree-structured Parzen estimator (TPE)approach can jump out of the search domain of the local minimum,there is still the probability to get a locally optimal solution for the limited iterations times (30 iterations employed in this study).In addition,as the no free lunch theorem suggests,there is no universally best machine learning algorithm.Even the best models perform poorly on some datasets.
Up to now, there are a few commercial/free machine learning platforms (KNIME, RapidMiner, SAS, TempoAI, DeepChem, Chemprop,etc.) that are accessible for users to architect, validate, and test machine learning modules based on their datasets.However,the commercial machine learning platforms will charge exorbitant fees,and most of free machine learning platforms need an expert in cheminformatics and programming.These limitations have slowed down scientists to employ these approaches for either developing models or generating predictions.We are far from there yet but using the PyCharm to integrate data manipulation,machine learning models (i.e.the BNB, LLR, ABDT, RF, SVM, and DNNs), and hyper-parameters optimization using quite simple Python codes.Making such modules accessible will allow more academic groups to evaluate their dataset for internal quality, before validating them by purchasing a commercial machine learning platform.
Data Availability
Data will be made available on request.
Declaration of Competing Interest
The authors declare that they have no known competing financial interests or personal relationships that could have appeared to influence the work reported in this paper.
Acknowledgements
We acknowledge the financial support provided by the National Key Research and Development Project (2019YFC0214403) and Chongqing Joint Chinese Medicine Scientific Research Project(2021ZY023984).
Supplementary Material
The Supplementary Material is available free of chargeviathe Internet.Links to our code and details on the model metrics for all referenced models and Hyperopt models are provided in the supplementary material (PDF).
Supplementary data to this article can be found online at https://doi.org/10.1016/j.cjche.2022.04.004.
杂志排行

Chinese Journal of Chemical Engineering的其它文章
- Preparation of lithium carbonate by microwave assisted pyrolysis
- A breathing A4 paper by in situ growth of green metal–organic frameworks for air freshening and cleaning
- Simulation and design of a heat-integrated double-effect reactive distillation process for propylene glycol methyl ether production
- High-efficiency and safe synthesis of tonalid via two Friedel-Crafts reactions in continuous-flow microreactors
- Improvement of synergistic effect photocatalytic/peroxymonosulfate activation for degradation of amoxicillin using carbon dots anchored on rod-like CoFe2O4
- Boosting the hydrogen storage performance of magnesium hydride with metal organic framework-derived Cobalt@Nickel oxide bimetallic catalyst