Investigation on small molecule-aptamer dissociation equilibria based on antisense displacement probe
2023-01-03LeiWangLiliYaoQihuiMaYuMaoHaoQuLeiZheng
Lei Wang, Lili Yao, Qihui Ma, Yu Mao*, Hao Qu, Lei Zheng*
School of Food and Biological Engineering, Hefei University of Technology, Hefei 230009, China
Keywords:Aptamer Small molecule Dissociation equilibria Antisense displacement probe Le Chatelier’s principle
A B S T R A C T Food safety is a major issue to public health and have attracted global attention. Fast, sensitive, and reliable detection methods for food hazardous substances is highly desirable. Aptamers which can bind to the target molecules with high aff inity and specif icity represent an attractive tool for the recognition of food hazardous substances, which play an important role in the development and application of new food safety detection technology. But current assays for characterizing small molecule-aptamer binding are limited by either the mass sensitivity or the size differentiation ability. Herein, we proposed a comprehensive method for assessing the dissociation equilibria of small molecule-aptamer, which is immobilized-free under ambient conditions. The design employs the Le Chatelier’s principle and could be used to effectively measure small molecule-aptamer interactions. ATP binding aptamer and anti-af latoxin B1 aptamer were used as the model system to determine their aff inity, in which their dissociation equilibria measurements are in excellent close to their previous work. Due to the simplicity and sensitivity of this new method, we believe that it could be recommended as an effective tool for characterizing small molecule-aptamer interactions and promote the further application of small molecular aptamer in food safety.
1. Introduction
Food safety problems is widely concerned by countries all over the world, which includes foodborne pathogenic microorganism pollution [1,2], toxin production [1,3], abuse of antibiotics [4,5],excessive use of food additives [6,7], heavy metal ion pollution [8,9],pesticide and veterinary drug residues [10,11], addition of other harmful substances and illegal additives [12], and so on. It is of great significance to analyze and detect food safety problems. How to detect all kinds of toxic and harmful substances quickly, accurately,conveniently and on-site is an urgent problem.
Antibody-based immunoassay technology has been developed for rapid, sensitive, specif ic and on-site detection [13,14]. However,it generally remains diff icult to screen and prepare specif ic antibodies against various small molecular compounds. Besides, immunoassay is still unable to detect many small molecules. Interestingly, aptamers
called chemical antibodies can replace antibodies [15]. Aptamers are
single-stranded nucleic acids obtained from the systematic evolution of ligands by an exponential enrichment (SELEX) [16-18]. They can fold into unique three-dimensional structures and bind to the target molecules with high affinity and specificity [15]. Compared with antibodies, aptamers have a lot of advantages, such as small size,easy synthesis and chemical modif ication, effective renaturation and non-immunogenicity [19,20]. These advantages make aptamers ideal for a great application in food safety detection [21,22]. Through the use of aptamers, many simple, rapid, sensitive and excellent detection methods have been developed [23-29].
However, there are still great problems in the screening of small molecular aptamers. The sensitive, reliable, and simple to use methods for the measurement of binding affinity (the equilibrium dissociation constant of the complex,Kd) between aptamers and small molecules are of great significance for their diverse applications [30].Up to now, various methods are developed to characterize the binding affinity, including isothermal titration calorimetry (ITC) [31],surface plasmon resonance (SPR) [32,33], backscattering interferometry (BSI) [34] and microscale thermophoresis (MST) [35,36],capillary electrophoresis (CE) [37], flow cytometry [38] and so on. However, these methods usually suffer from sample and time consumption, nonspecific adsorption, expensive equipment that not always available in most of the labs and may also require professional technicians [39,40]. These challenges are particularly problematic for small molecules, since most of the affinity binding assays are not sufficiently sensitive enough to detect binding of low molecular weight targets. This greatly hinders the screening of small molecular aptamers and their application in food safety testing and life sciences.
As a consequence, some new methods have been designed and developed to measure small molecule-aptamer affinity. Among these methods, including microarray analysis [41], affinity chromatography [42],and isocratic elution [43] are heterogenous methods which typically rely on the immobilization of one of the interacting species. However,the conformational change during immobilization is known to impact the binding. The binding activity is critically depending on the optimal configuration of aptamer. Therefore, homogeneous methods are more preferable forKdmeasuring. A widely used method is molecular beacon-based analysis which employs binding-induced structural change in the presence of target molecules [44,45]. This method is rapid, facile and inexpensive. However, it has a significant drawback:large amounts of aptamers have unpredictable binding domains and some of them may not have structure-switching functionality. Thus,additional sequence engineering steps are required to introduce structure-switching functionality to such aptamers, but the effect of aptamer design on response is far less understood.
The competition strategy [46-48] offers an alternative for the measurement of small molecule-aptamer interaction, in which the aptamer is partially blocked by an antisense displacement probe.The measurement relies on target-induced displacement of the antisense displacement probe and the quantification of the formed target-aptamer complex and the displaced antisense displacement probe after the reaction in solution. Although this method has been widely studied [49-52], it still needs methodological improvement since recent studies did not consider the effect of antisense displacement probe on the evaluation ofKdvalue [53]. Moreover,keeping an efficient response to the small molecule induced reaction should be considered.
Herein, we propose a competitive interaction double-equilibrium system (CIDES) for measuring the equilibrium dissociation constant of small molecule-aptamer complex, which is based on the competitive interaction of the quencher-labeled antisense displacement probe(Q-antisense DNA) and the target with the fluorophore-labeled aptamer (F-aptamer), and the equilibrium dissociation constant obtained can is called competitive equilibrium dissociation constant (cKd). The CIDES design is based on two experimental blocks, as follow:
(1) Experiment block 1: Determination ofKd’[54], the dissociation constant between F-aptamer and Q-antisense DNA,in which, the length of Q-antisense DNA is optimized to propose an efficient system for the recognition of small molecules and several competitive curves were obtained at different F-aptamer concentrations. Through these curves, theKd’ values at different F-aptamer concentrations can be obtained.
(2) Experiment block 2: Determination ofcKd, the dissociation constant between the aptamer and the target. In the different duplex system formed by F-aptamer and Q-antisense DNA, several competitive curves were obtained at different target concentrations.Through these curves, the IC50values at different F-aptamer concentrations can be obtained. Finally, each correspondingcKdwas obtained by calculation.
As an example, we mainly have applied this system to measure the binding of ATP aptamer [55], a typical and well-studied small molecule aptamer. We have found that thecKdvalue is close to theKdvalue found in the literature [35,36,55], demonstrating the feasibility of this method. And the universality of this method was verified by aflatoxin B1 (AFB1) and its aptamer (anti-AFB1 aptamer) [56].Our updatedcKdequation may play a significant role in the future development of small molecule-aptamer evaluation, since it offers a more reasonable and accurate nonlinear curve regression model.
2. Experimental section
2.1 Materials and apparatus
All DNA oligonucleotides (Table 1) were synthesized and purified with HPLC by Sangon Biotech (Shanghai) Co., Ltd. (Shanghai,China). An aptamer was labeled with FAM at the 3’ end (F-aptamer).All the antisense DNAs were labeled with DABCYL at the 5’ end(Q-antisense DNA). ATP was purchased from Thermo Scientific.Fluorescence intensity was scanned using Tecan Infinite®200 PRO(Shanghai, China).

Table 1Nucleic acid sequence and modification used in this paper.
2.2 Derivation of the correlation equation of Kd’, Kd and fluorescence intensity
In experiment block 1, F-aptamer is first hybridized with Q-antisense DNA (Fig. 1). When the concentration of Q-antisense DNA ([Q-antisense-DNA]) is much higher thanKd’, the dissociation constant of F-aptamer and Q-antisense DNA in this system is as follows:

where [F-aptamer]0is the total concentration of the aptamer of all forms, [F-aptamer] is the concentration of unhybridized aptamer,[Q-antisense-DNA] is the concentration of unhybridized Q-antisense DNA, [Duplex] is the concentration of aptamer-antisense DNA duplexes,F0is the total fluorescence intensity when there is only aptamer, andFis the remaining fluorescence intensity after joining antisense DNA. Equation (1) is transformed to obtain the relationship between the fluorescence intensity andKd’ (Equation (2)) as follows:

In experiment block 2, when the target is added to the system of aptamer and antisense DNA, the balance of the original system is destroyed, and a new system with two competitive responses is formed. One is the aptamer hybridizing with antisense DNA to form the duplex, the other is the target binding to the aptamer to form the complex. This involves the Le Chatelier’s principle in reversible reactions. When the target is added to the duplex, the reaction between the target and the aptamer moves positively, and the reaction between the antisense DNA and the aptamer moves in the opposite direction. It makes part of the antisense DNA with quenching group and the aptamer with fluorescence group separated, so that part of the fluorescence is recovered in the solution(Fig. 1). The dissociation constant of the aptamer-target complex in this system is as follows:
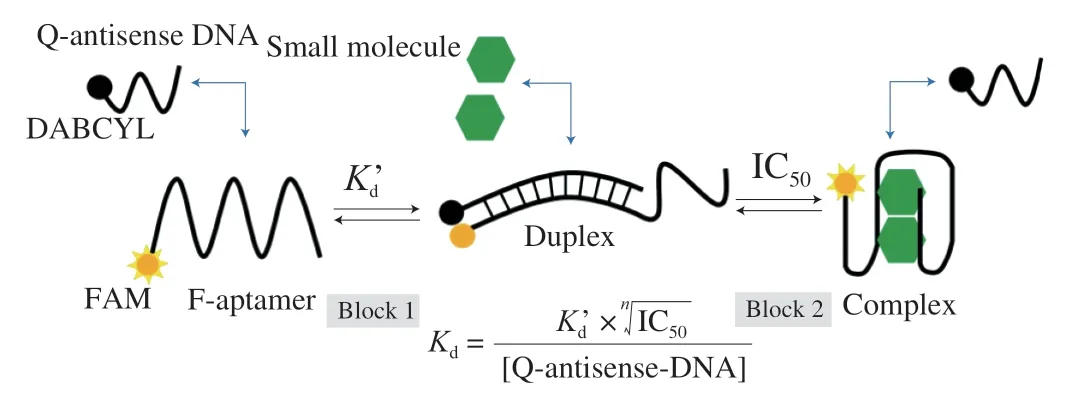
Fig. 1 Hybridizing between F-aptamer and Q-antisense DNA, and binding between the target and F-aptamer causes the release of Q-antisense DNA.
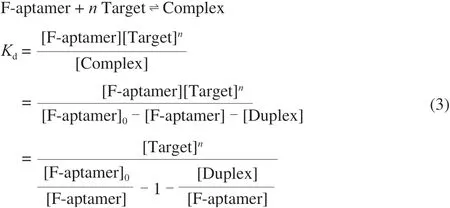
where [F-aptamer]0is the total concentration of the aptamer of all forms, [F-aptamer] is the concentration of unhybridized aptamer,[Target] is the concentration of unhybridized target, [Complex]is the concentration of aptamer-target complexes, [Duplex] is the concentration of aptamer-antisense DNA duplexes.nis the number of targets that an aptamer can bind. Equation (3) is transformed into Equation (4) as follows:

This approximation holds when [Target]n/Kd≫ 1,[Duplex]/[F-aptamer] = [Q-antisense-DNA]/Kd’ ≫ 1. Thus,Equation (4) is transformed into Equation (5) as follows:

where IC50=Kd[Q-antisense-DNA]/Kd’ is the effective dissociation constant of the target for the existence of the antisense DNA [38]. We can know from the relationship between the fluorescence intensity and the concentration of each substance in the system as follows:

whereF0is the total fluorescence intensity when there is only aptamer, andFis the remaining fluorescence intensity after the joining of antisense DNA. Equation (5) and Equation (6) are combined as follows:

Considering that the binding ratio of some aptamers to the target is not 1 to 1, but 1 ton, we use Equation (8) instead of IC50=Kd[Q-antisense-DNA]/Kd’. The competitive equilibrium dissociation constant is as follows:
2.3 General scheme of experiments
The following experiments can be summarized in the scheme
shown in Fig. 2 (flow chart).

Fig. 2 Experimental block diagram for determining the dissociation constant of the aptamer-target complex.
2.4 Experiment block 1
Pre-experiments were performed using the following procedure.0.5 µmol/L F-aptamer, 5 µmol/L Q-ATP-nand 1× PBSMT buffer(137 mmol/L NaCl, 2.68 mmol/L KCl, 8.1 mmol/L Na2HPO4,1.76 mmol/L KH2PO4, 1 mmol/L MgCl2, and 0.025% Tween-20) were mixed in 20 µL, and incubated at 95 °C for 5 min and then cooled on ice for 20 min. Subsequently, 1 µL of ATP (100 mmol/L) was added to reaction mixture, followed by incubation at room temperature for 30 min. The fluorescence was observed through the blue light transmission.
Through this pre-experiment, we chose Q-ATP-11 in the following experiments. 18.18, 27.27 and 36.36 nmol/L F-aptamer were mixed with different concentrations of Q-ATP-11 respectively in 110 µL 1× PBSMT buffer, and incubated at 95 °C for 5 min.The mixture was then cooled on ice for 20 min and left at room temperature for 20 min. A 100 µL amount of the mixture was loaded into the wells of a 96-well plate. Fluorescence emission spectra were recorded at 525 nm using a Tecan microplate reader with a 485 nm excitation wavelength. TheKd’ values of the antisense DNA binding to the aptamer were fitted by Origin 9.0 at the different concentration of the aptamer.
2.5 Experiment block 2
The 18.18, 27.27 and 36.36 nmol/L F-aptamer were mixed with different concentrations Q-ATP-11 respectively in 108 µL 1× PBSMT,and incubated at 95 °C for 5 min. The mixture was then cooled on ice for 20 min and left at room temperature for 20 min. Subsequently,2 µL of ATP at different concentrations were added to reaction mixture, followed by incubation at room temperature for 30 min.A 100 µL amount of the mixture was loaded into the wells of a 96-well plate. Fluorescence emission spectra were recorded at 525 nm emission with a 485 nm excitation wavelength using a Tecan microplate reader. The IC50values of the target binding to the aptamer-antisense DNA duplexes at the different concentrations of the aptamer were fitted. Then, thecKdvalues of the target binding to the aptamer were calculated.
2.6 Verification of results of hybridization at 5’ end of aptamer
In the above mentioned work, the antisense DNA was hybrid with aptamer at the 3’ end of the aptamer. Further experiments were carried out to verify whether similar results could be obtained when the 5’ end of aptamer were hybridized. We chose F-aptamer’ at 18.18 nmol/L and Q-ATP-11’ to carry out the experiment block 1 and block 2. The sequences of F-aptamer’ and Q-ATP-11’ are shown in Table 1.
2.7 Experiment on anti-AFB1 aptamer
To demonstrate the universality of this strategy, we tested another small molecule and its aptamer, AFB1 and anti-AFB1 aptamer. We chose F-anti-AFB1 aptamer at 18.18 nmol/L and Q-AFB1 to carry out the experiment block 1 and block 2. The sequences of F-anti-AFB1 aptamer and Q-AFB1 are shown in Table 1.

Table 2Mean IC50 and ? when n is different.
3. Results and discussion
3.1 Selection of the Q-antisense DNA
ATP binding aptamer is one of the most commonly used small molecule aptamer, so we selected the ATP binding aptamer with aKdof ~10 µmol/L to perform the experiment [35,36,55]. First,we performed pre-experiments by adding a certain proportion of F-aptamer, Q-antisense DNA (Q-ATP-n) and ATP (Fig. 3). Under our experimental conditions, when the length of Q-ATP-nwas more than 11 bases, the fluorescence was not visible after ATP was added.And when it’s Q-ATP-nof 11 bases (Q-ATP-11), the solution would just show visible fluorescence. This phenomenon could be well explained. With the increase of the length of the antisense DNA, the binding force between the antisense DNA and the aptamer became stronger, which made it increasingly difficult for the target to bind to the aptamer [46]. In comparison to other antisense DNAs, the results showed that, when Q-ATP-11 is selected, the target could be easily combined with the aptamer. Therefore, we would use Q-ATP-11 for experiments in the following operations.
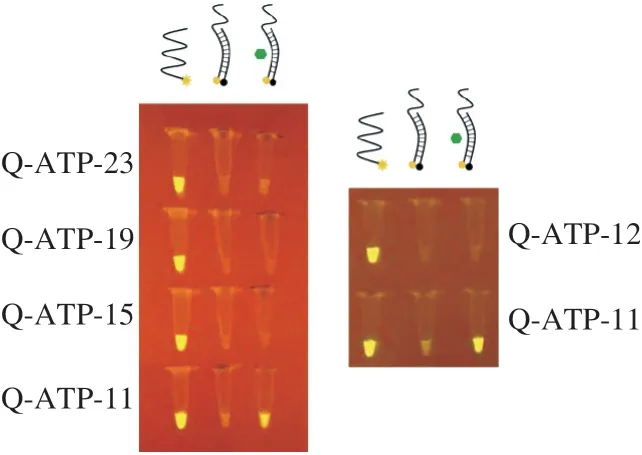
Fig. 3 Selection of Q-antisense DNA.
3.2 Determination of Kd’ between the aptamer and the antisense DNA
By changing the concentrations of F-aptamer and Q-ATP-11,we drew the relationship curve between the fluorescence intensity of this system and different concentrations of Q-ATP-11. TheKd’at different concentrations of the aptamer was obtained by Hill 1 of nonlinear curve fit using Origin 9.0 (Figs. 4A-C). The results showed that when the concentrations of F-aptamer are 18.18, 27.27, and 36.36 nmol/L,Kd’ are (56.59 ± 11.46), (65.87 ± 5.10), and(73.20 ± 2.86) nmol/L, respectively. Moreover, we further discussed the relationship betweenKd’ and the different concentrations of F-aptamer (Fig. 4D). We found that although there were differences inKd’ at different aptamer concentrations, the values were similar and in the same order of magnitude. In the next experiment, we chose theKd’ corresponding to the aptamer concentration to calculate thecKdbetween the aptamer and the target.
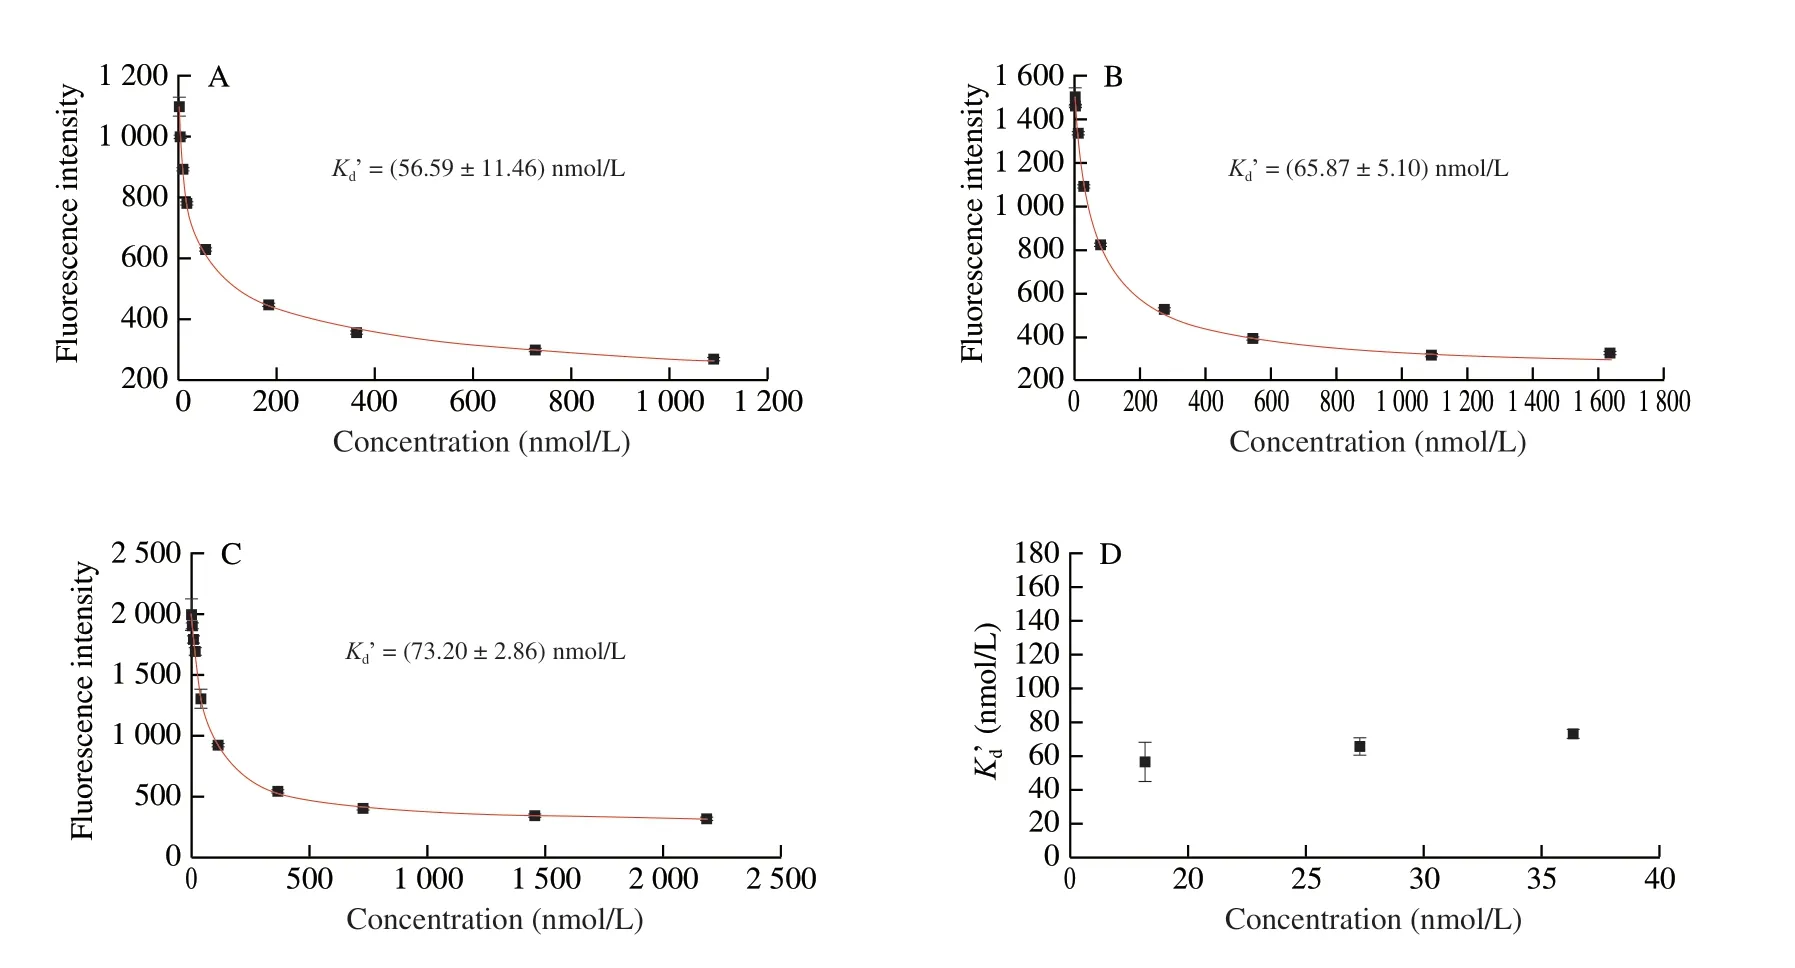
Fig. 4 Determination of Kd’ between F-aptamer and Q-antisense DNA using (A) 18.18 nmol/L F-aptamer, (B) 27.27 nmol/L F-aptamer, (C) 36.36 nmol/L F-aptamer. (D) The relationship between different F-aptamer concentrations and Kd’ values. Each experiment was performed in twice, and error bars represent the standard deviation of two measurements.
3.3 Determination of the IC50 between the aptamer-antisense complex and the target
We first used different proportions of Q-ATP-11 and F-aptamer([Q-ATP-11]0/[F-aptamer]0) to form the aptamer-antisense duplex,and then added a series of ATP to carry out experiments. We drew a series of points that correlated the fluorescence intensity with the concentration of ATP and obtained the IC50in these cases by Hill 1 of nonlinear curve fit using Origin 9.0, as shown in the Figs. 5A-C.We discovered that, under the same concentration of F-aptamer([F-aptamer]0), the IC50increased gradually with the increase of[Q-ATP-11]0/[F-aptamer]0(Fig. 5D). It can most likely be the reason that the binding between the target and the aptamer would be inhibited with increasing [Q-ATP-11]0in the system. To fill the need for more binding between the target and aptamer, it was necessary to add more targets, so that the obtained IC50was larger [46].This indicated that it is not reliable to treat IC50as the equilibrium dissociation constant directly. Therefore, we must consider the effect of the addition of the antisense DNA on the equilibrium dissociation constant. Similarly, when [Q-ATP-11]0/[F-aptamer]0was fixed and [F-aptamer]0was different, the phenomenon that IC50increased gradually with increasing [F-aptamer]0could also be explained by the same idea (Fig. 5D).

Fig. 5 Determination of IC50 between F-aptamer and the target using (A) 18.18 nmol/L F-aptamer, (B) 27.27 nmol/L F-aptamer (the R2 of the red line fitted in Fig. 4B is 0.99), (C) 36.36 nmol/L F-aptamer. (D) The relationship curve between [Q-ATP-11]0/[F-aptamer]0 and IC50 values. Each experiment was performed in twice, and error bars represent the standard deviation of two measurements.
For ATP aptamers, one aptamer binds to two molecules (n= 2).In order to determine whether our method can also be used for another aptamer (nis unknown), we fit the data withn= 1, 2, 5 and 10, respectively. The results obtained are shown in Table 2. The data show that when n takes different values, the IC50obtained are similar.This shows that even ifnis unknown, it will not affect our application of this set of formulas. We can directly usen= 1 to calculatecKdthrough our formulas.
3.4 Calculation of the cKd between the aptamer and the target
Finally, we calculated thecKdof ATP binding to F-aptamer by formula at different [F-aptamer]0and different [Q-ATP-11]0/[F-aptamer]0,and drew the relationship curves between [Q-ATP-11]0/[F-aptamer]0andcKd(Fig. 6). We found that under the same conditions of[Q-ATP-11]0/[F-aptamer]0, thecKdof different aptamer concentrations were similar. This clearly stated that we could choose a certain concentration of the aptamer to calculate thecKddirectly. At the same aptamer concentration, thecKdgradually decreased and tended to be flat with increasing [Q-ATP-11]0/[F-aptamer]0. And at higher[Q-ATP-11]0/[F-aptamer]0, thecKdobtained was close toKdmeasured by MST [35,36] and analytical ultrafiltration [55]. This indicated that as the concentration of the antisense DNA gradually increases,cKdbecomes closer and closer to the realKd. Moreover, the concentration of the antisense DNA could not be increased indefinitely, because as the concentration of the antisense DNA increases, the obtainedcKdgradually tends to a platform. Consequently, we could use this concentration of the antisense DNA when the fluorescence intensity of the system tended to flatten during the experiment of theKd’ determination, and we also could use this concentration of the antisense DNA to determine thecKd.
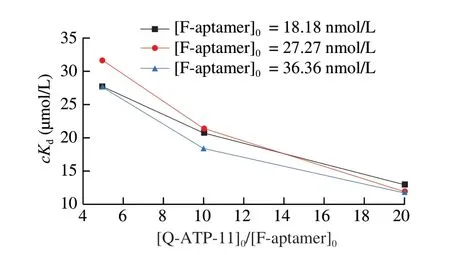
Fig. 6 Calculation of cKd value between the F-aptamer and the target.
3.5 Verification of results of hybridization at 5’ end of aptamer
Here, we chose F-aptamer’ at 18.18 nmol/L to carry out this experiment. The results showed that theKd’ was (114.38 ± 3.60) nmol/L and the IC50was (20 359.47 ± 814.60) (µmol/L)2(Fig. 7). The final calculatedcKdis 11.37 µmol/L. Obviously, it is consistent with our former results. Thus, we believe that this method can be used,whether at the 3’ end of the aptamer or at the 5’ end of the aptamer.In addition, it is worth noting that the antisense DNA needs to bind to the core domain of the aptamer when using our method.
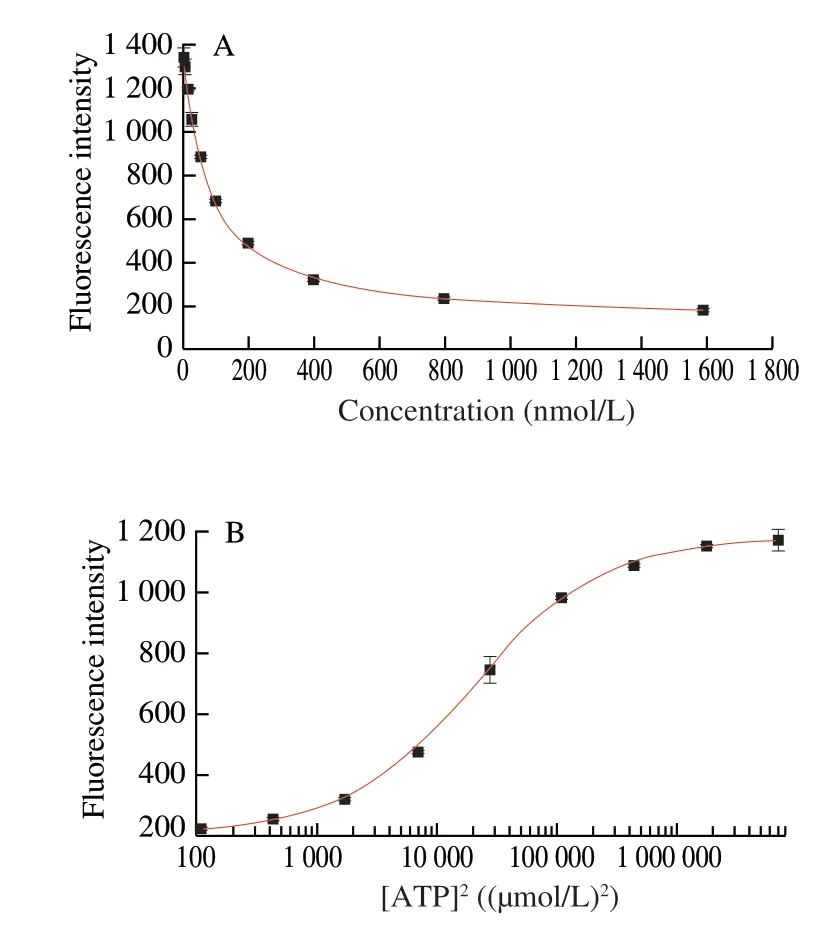
Fig. 7 Verification of results by the hybridization at 5’ end of aptamer.(A) Determination of Kd’ between F-aptamer’ and Q-ATP-11’;(B) Determination of IC50 between F-aptamer’ and ATP.
3.6 Experiment on anti-AFB1 aptamer
We chose AFB1 and anti-AFB1 aptamer to carry out a similar experiment. TheKdof this aptamer was 12 nmol/L by dialysis [56].The corresponding aptamer and antisense DNA sequences are shown in the following Table 1. We chose F-anti-AFB1 aptamer at 18.18 nmol/L to carry out this experiment. The results showed that theKd’ was(30.49 ± 1.18) nmol/L and the IC50was (506.22 ± 129.97) nmol/L (Fig. 8).The final calculatedcKdis 21.22 nmol/L, which is close to theKdobtained by dialysis. The result indicates that this method is a generality method.
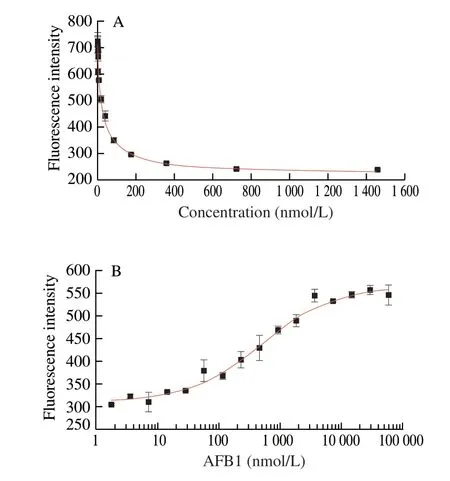
Fig. 8 Experiment on anti-AFB1 aptamer. (A) Determination of Kd’ between F-anti-AFB1 aptamer and Q-AFB1; (B) Determination of IC50 between F-anti-AFB1 aptamer and AFB1.
4. Conclusion
In conclusion, we report a simple method which uses the F-aptamer and the Q-antisense DNA to effectively obtain the equilibrium dissociation constant of the aptamer-small molecule complex. In order to verify the feasibility of this method, we successfully implemented it to obtain the competitive equilibrium dissociation constant values of ATP binding aptamer and anti-AFB1 aptamer. Specifically, we first use the aptamer to obtain the binding affinity between the appropriate antisense DNA. Then, IC50was obtained by adding a series of concentration of targets into a relatively stable system consisting of aptamers and antisense DNA. Finally, the affinity value of the aptamer was obtained by calculation. This strategy was performed in a free state without the immobilization of the aptamer or the target,avoiding the conformational rearrangements during immobilization and the diffusion limitations of interactions between aptamer and the target. Moreover, the present method had advantageous characteristics such as an easy operation, low cost and excellent specificity. Thus,Therefore, we believe that our method is of great significance for the screening and application of small molecular aptamers.
Conflict of interest
The authors declare that they have no conflicts of interest.
Acknowledgements
This work was supported by the National Key R&D Program of China (2017YFC1600603) and the Funds for Huangshan Professorship of Hefei University of Technology (407-037019).
杂志排行
食品科学与人类健康(英文)的其它文章
- Emerging natural hemp seed proteins and their functions for nutraceutical applications
- A narrative review on inhibitory effects of edible mushrooms against malaria and tuberculosis-the world’s deadliest diseases
- Modulatory effects of Lactiplantibacillus plantarum on chronic metabolic diseases
- The role of f lavonoids in mitigating food originated heterocyclic aromatic amines that concerns human wellness
- The hypoglycemic potential of phenolics from functional foods and their mechanisms
- Insights on the molecular mechanism of neuroprotection exerted by edible bird’s nest and its bioactive constituents
