Differing migration patterns and year-round habitat-use of allopatric nesting Eastern Tundra Bean Geese(Anser fabalis serrirostris)in East Asia
2023-01-03FnjunMngJingZhngChngLiQingshnZhoDinSolovyvHnsooLiingChnLiCoAnthonyDviFox
Fnjun Mng,Jing Zhng,Chng Li,Qingshn Zho,Din Solovyv,Hnsoo L,Liing Chn,**,Li Co,*,Anthony Dvi Fox
a State Key Laboratory of Urban and Regional Ecology,Research Center for Eco-Environmental Sciences,Chinese Academy of Sciences,Beijing,100085,China
b University of Chinese Academy of Sciences,Beijing,100049,China
c Institute of Biological Problems of the North,Far Eastern Branch of the Russian Academy of Sciences,Magadan,685000,Russia
d Korea Institute of Environmental Ecology,Yuseong-gu,Daejeon,South Korea
e Department of Ecoscience,Aarhus University,C.F.Møllers Vej 8,DK-8000,Aarhus,Denmark
Keywords:Cropland feeding Diurnal habitat-use GPS/GSM Telemetry Migration duration Migration stopovers
ABSTRACT Sympatric Chinese-wintering Eastern Tundra Bean Geese(Anser fabalis serrirostris,ETBG)breed in two widely separated Arctic areas(Central Russian Arctic and Anadyr region);South Korean-wintering birds(Chaun-South Korea)breed in a third discrete area between these two.Such winter/summer segregation likely structures the population,potentially resulting in distinct migration patterns and habitat-use throughout the annual cycle.We tracked individuals using GPS-GSM transmitters from all three of these geographically discrete ETBG subpopulations to see whether this was the case,testing for differences in migration patterns,seasonal and diurnal habitat-use using remotely sensed land-cover mapping.Mean migration distance of Central Arctic-China and Chaun-South Korea individuals did not differ significantly,but Anadyr-China birds travelled 15–24% further(mean:1140 km,P<0.001).Despite this,mean spring migration durations were longest among Central Arctic-China ETBG,significantly longer than Anadyr-China geese,due to significantly longer stopovers,which were significantly longer than Chaun-South Korea birds.Autumn migration duration of Central Arctic-China and Chaun-South Korea individuals was significantly shorter than in spring,with fewer,shorter stopovers.Lack of significant differences in migration and stopover duration or numbers of stopovers between spring and autumn among Anadyr-China ETBG confirms this is a plastic trait,differing between subpopulations responding to prevailing conditions.Migration patterns and habitat-use differed significantly between all three ETBG subpopulations,although all tended to use wetlands more at night and croplands more in daytime in winter,suggesting specific adaptations and responses to differing conditions encountered along their different migration routes.Although untestable,we speculate that differences in habitat-use may affect fitness levels and genetic exchange between subpopulations,but based on our observations,conclude clear differences in migration and foraging ecology between these elements of the same subspecies,even in winter sympatry.
1.Introduction
The Bean Goose(Anser fabalis)is widely distributed across Eurasia,divided between taiga and tundra breeding forms and eastern and western types into four subspecies(BirdLife International and Handbook of the Birds of the World,2019).The species had a total estimated global population of 893,000 in 2015,of which the two tundra subspecies accounted for 92% of the total(Fox and Leafloor,2018).The Eastern Tundra Bean Goose(A.f.serrirostris,ETBG)breeds more or less continuously across the Russian Arctic tundra,from the Taimyr Peninsula in the west(maximum 72°30′N)to the Anadyr River in the East(south to 65°30′N).The population winters in China,South Korea and Japan,where monitoring has shown an increase from 96,000 to 310,000 during 2003/04 to 2020(Li et al.,2020a).Extensive tracking studies have recently demonstrated the existence of at least three different subpopulations of ETBG based on discrete breeding and wintering provenances(Li et al.,2020a).ETBG wintering in the middle and lower Yangtze River floodplain,the most important wintering site in China,are known to breed in the extreme west and east of the known nesting range(in the Central Russian Arctic between 85°E and 140°E and eastwards to the Anadyr region from 175°E respectively,Li et al.,2020a,2020b).In contrast,ETBG wintering in South Korea breed in an intermediate part of the Russian Arctic between 142°E and 170°E(Li et al.,2020a),which means that these three subpopulations show a degree of nesting allopatry,raising the intriguing prospect that such winter/summer segregation could potentially lead to some structuring of the population.If this is the case,we hypothesise that ETBG belonging to each of the three subpopulations would show development of distinct migration patterns and potentially habitat-use throughout the annual cycle.Here,we use individual high-precision GPS-GSM tracking data from samples of all three subpopulations of ETBG to investigate whether this is the case.
2.Methods
2.1.Capture methods and telemetry devices
Seventy ETBG(12 adults and 58 juveniles)were captured in the Chaun River delta(68°53′N 170°58′E),one of the important summering sites of ETBG located in West Chukotka(Diana Solovyeva,unpublished data)in the Russia Arctic in summer 2017 during round ups of flightless moulting flocks using boats to drive them from the safety of water into movable funnel nets and pens established on the shore(Li et al.,2020a).A sample was fitted with solar-powered neck-collar GPS-GSM loggers(Ornitela-N35-3G,Lithuania,35 g).Forty-eight adult ETBG were captured at Poyang Lake(29°7′N,116°16′E;n=6)and Anhui Lakes(30°54′N,117°40′E;n=42)combined during November 2016 to January 2017,the main wintering sites in Yangtze River floodplain in China.Geese were caught in the beams of powerful lamps and captured in hand nets using boats at night,or in heavy-duty mist-nets(designed for catching large birds)set at their roosts,and a sample was fitted were fitted with neck-collar GSM-GPS loggers(Druid,China,35 g).Another 10 adult Bean Geese were captured using cannon nets in January 2017 in Jianghua Bay in Paju,South Korea(37°44′N,126°39′E)at the main wintering site for ETBG there(2000–3000 wintering birds annually)and a sample of these fitted with backpack GSM-GPS loggers(WT-300,KoEco,South Korea,72 g).The weight of these devices varied between 0.94%and 2.23%of the body mass(Appendix Table S1),light enough to avoid having significant effects on normal activities(Lameris and Kleyheeg,2017).All recorded devices recorded date-and time-stamped Global Positioning System(GPS)positions,transmitted via the Global System for Mobile Communications(GSM)mobile networks to download for analysis,with a positional accuracy of<10 m.The frequency of data acquisition was set to 10 min to 2 h depending upon battery charge levels,generating 4–144 GPS positions per day(Li et al.,2020a).
To avoid any potential effects of age,we only used data from the 26 tracked adult individuals,which completed annual migration at the first capture year.We assigned individuals to the defined subpopulations recognized using the different migration corridors.First,geese from the Anadyr-China subpopulation(n=4),summering in the SE Chukotka,and specifically in Anadyr River region,and wintering in Yangtze River floodplain in China.Second,Central Arctic-China geese(n=11 in spring,n=12 in autumn,due to missing spring data for individual bg11),summering in Central Russia tundra areas and on the Taimyr Peninsula,and wintering in Yangtze River floodplain in China.Thirdly,Chaun-South Korea geese(n=8 in spring,n=10 in autumn;another 3 individuals caught in Jianghua Bay in South Korea used this corridor but were not included in data analysis due to incomplete data during migration),summering in Chaun Delta and Heroma Bay,wintering along the west coast of South Korea(Appendix Table S1).
2.2.Data extraction and migration parameters definition
We identified departure and arrival date during each sequential migration bout(for full details of the methods,see Wang et al.,2018),identifying breeding period and breeding area,wintering period and wintering area,autumn and spring migration period and critical stopover sites.In this way,we distinguished the four main periods of their annual life cycle(summer,spring and autumn migration and winter;Deng et al.,2019).The departure date was defined as the date of the first position when a bird left the wintering/moulting/breeding site,judged as the first position acquired from the logger assigned to“flight”status using the segmentation method of Wang et al.(2018).The arrival date was defined as the date of the first position when a bird arrived at the wintering/moulting/breeding site,judged as the first position acquired from the logger assigned to“non-flight”status after a protracted period of flight.We defined critical stopover sites as where birds stayed within a radius less than 50 km and rested/fed for more than 48 h during migration.Based on the above definitions,and using the“dplyr”and“Geosphere”software packages(RStudio,Inc.,Boston,MA,Hijmans et al.,2016),for the 26 tracked ETBG which had complete migration data,we defined 7 migration parameters:departure date,arrival date,migration distance(km),migration duration(days),stopover duration(days),number of stopover sites,and step length(km)as follows.
(1)Departure date:The date of the first position when a bird left the wintering/moulting/breeding site,judged as the first position acquired from the logger assigned to“flight”status using the segmentation method above(Wang et al.,2018).
(2)Arrival date:The date of the first position when a bird arrived at the wintering/moulting/breeding site,judged as the first position acquired from the logger assigned to“non-flight”status after a protracted period of flight(Wang et al.,2018).
(3)Migration duration(days):The number of days a bird took to travel(including stopovers)between the last summering site and first wintering site(autumn migration)or between the last wintering and the first summering site(spring migration)(Deng et al.,2019).
(4)Migration distance(km):The cumulative travel distance between all pairs of adjacent GPS locations which were assigned to“flight”status during migration when moving between wintering/moulting/stopover/breeding sites(K¨olzsch et al.,2016;Deng et al.,2019).
(5)Number of stopover sites:The number of sites the bird used for resting and foraging(i.e.,energy supplement)for more than 48 h during migration(K¨olzsch et al.,2016).
(6)Stopover duration(days):The sum of days spent at all stopover sites during each migration season(Chen and Dobra,2018).
(7)Step length(km):The migration distance divided by the number of flight legs during each migration season(Chen and Dobra,2018).
2.3.Seasonal and diel habitat-use
We used the Brownian Bridge Movement Models(BBMM)to calculate the home ranges of the tracked individuals in the four periods(Spring,Summer,Autumn,and Winter),which combine the animal's core activity areas and movement tracks,effectively excluding the area between individual activity patches to derive more representative home ranges(Bullard,1991;Horne et al.,2007).Compared with Minimum Convex Polygon(MCP)and Kernel Density Estimation(KDE),BBMM is more effective in dealing with spatial autocorrelation and uneven distribution of sites.In addition,the parameters in BBMM have more ecological significance,taking account of movement speed and the positional error of the devices(Bullard,1991;Powell,2000).In order to extract and compare the core areas used by ETBG during day and night,we chose 50% of the utilization range respectively to obtain the main habitat-use in day and night in the four annual seasonal life periods(Zhang et al.,2018;Deng et al.,2021).Furthermore,considering the differences in stopover duration of ETBG in different life cycle stages,we weighted the habitat area used by individuals by the proportion of each stopover duration in one life cycle(the sum of Spring,Autumn migration,Summering and Wintering periods).We applied BBMM to these data by using the“adehabitatHR”software package in R(Calenge and Dufour,2006;R Studio,Inc.,Boston,MA).We used“maptools”in R to classify the sites located in the area into day and night(Bivand and Lewin-Koh,2017).The daytime was defined as the range from civil dawn to civil dusk at the location;while the night was from the civil dusk to civil dawn of the next day.Because the sun is above the horizon in the Arctic summering area of Bean Geese from March 21 to September 22,habitat-use can only be assigned to daylight during this period.
To assess the habitat-use of ETBG,we used the FROM-GLC 2017v1 global land cover data set(with an accuracy of 10 m×10 m)provided by the Department of Earth System Science at Tsinghua University(Gong et al.,2019).This comprises 10 land-cover classification types:shrub,forest,grassland,cropland,bare land,artificial surfaces,water,wetland,tundra and permanent snow/ice.For convenience,we combined“water”and“wetland”into“wetland”,and“forest”,“shrub”,“bare land”,“artificial surfaces”and“permanent snow/ice”into“others”.Because the FROM-GLC 2017v1 global land cover data set was collected in winter,some seasonal wetlands were incorrectly classified as cropland area.We corrected this by reference to the 2015 China Ecological Remote Sensing Survey and Evaluation Data Set(30 cm×30 m accuracy,released by the Chinese Academy of Sciences and the Ministry of Ecology and Environment Department).We assessed the proportion of habitat used by tagged geese by day and night within each of the four seasons by overlaying the goose positions on the mapped coverage of the five land-cover classification types defined above in QGIS 3.0(QGIS Development Team,2017)and ArcGIS 10.6(ESRI,2017).
2.4.Statistical analysis
One-way analysis of variance(ANOVA)was used to test the differences in departure dates and arrival dates during spring and autumn migration of ETBG using each of defined three migration corridors.The results of one-way ANOVA were compared with the differences between two seasons by post-hoc Tukey t-tests.We used linear mixed models(LMMs)to check the effects of fixed factors(season,subpopulation)and random effects(individual)on five migration parameters(migration duration,stopover duration,migration distance,number of stopover sites,and step length),and the effects of each fixed factor were tested by likelihood ratio test.For the differences between subpopulations within seasons,Tukey-HSD tested were applied as post pairwise comparisons.Chi-square tests were used to test the difference in use of habitat types between subpopulations in the day and night and in the same season.Statistical analysis was carried out in R studio v4.1.1(RStudio,Inc.,Boston,MA)and SPSS 21.0.The statistical significance standard was set as P<0.05,and data are presented as means±SD.
3.Results
3.1.Migration routes and critical stopover sites
Data were returned on the spring and autumn migration routes from 29 individuals from the three geographically discrete subpopulations divided between the two wintering areas.These included 16 Chinese wintering birds(7 from Poyang Lake and 9 from Anhui Lakes in the Yangtze River)and 13 from South Korea(including the three individuals tracked in Jianghua Bay,South Korea with incomplete migration data)(Appendix Fig.S1).We found that the breeding range of the three subpopulations showed obvious differentiation in the Arctic from 85°E to 175°E.Interestingly,some of these birds changed their wintering sites between the first and second years after tagging.This included four of twelve Yangtze River tagged geese from the Central Arctic-China subpopulation,all wintered in Anhui Lakes in 2016 but changed in 2017.Specifically,bg010 subsequently wintered at Baitan Lake in Huanggang,Hubei Province in 2017,bg013 and bg011 wintered in the Yellow River Delta in 2017,and bg014 wintered in the Huaihe River Basin(Fuyang City Section)in 2017.Two of four Yangtze River tagged birds from the Anadyr-China subpopulation(bg002 and bg005)also shifted from Poyang Lake in 2016 to the Yellow River Delta in the subsequent winter in 2017(Appendix Fig.S1).
Northeast Asia constitutes the main stopover region during the spring and autumn migration of all three subpopulations of ETBG using China,Russia and North Korea(Fig.1,Appendix Fig.S2).The Siramulen River,in the upper reaches of the Liao River Basin,also constitutes a common stopover site used on spring migration by individuals from both the Central Arctic-China and Anadyr-China subpopulations,which continue northwards in their different directions to their separate breeding ranges after departure from this main staging site(Appendix Fig.S2).The Central Arctic-China subpopulation mainly staged in the upper reaches of the Heilongjiang-Amur River basin west of the Hinggan Mountains,in Northeast Inner Mongolia,in the Oriental province in Mongolia and in the Erguna River floodplain.In addition,the middle reaches of the Nen River Basin also constituted the main stopover area used by bg014 from the Central Arctic-China subpopulation.The central Yakut Plain,located in the Vilyui River Basin in Russia was also important(Fig.1;Appendix Figs.S1 and S2).
Most individuals from the Anadyr-China subpopulation staged in Heilongjiang-Amur River Basin,especially in the Heihe-Jiayin County section of the Songliao Plain.Geese from the Chaun-South Korea subpopulation mainly staged in Tumen River Basin and Heilongjiang-Amur River basin(Xingkai Lake and Sanjiang Plain on the borders of China,North Korea and Russia).In addition,Wolong Lake,Santaizi Reservoir,Paoziyan Reservoir and the Baicheng section of Nen River were the main stopover sites of bg19 and bg27(Fig.1;Appendix Figs.S1 and S2).Compared with spring migration,geese in autumn were mainly confined to the Heilongjing-Amur River basin and Liao River basin from all three subpopulations.
3.2.Differences in migration parameters of three subpopulations in spring and autumn
On average,birds from the Central Arctic-China and Anadyr-China subpopulations left wintering sites on 24 February(range 11 February to 8 March 2017)and 28 February(24 February to 2 March)respectively,significantly earlier than those of Chaun-South Korea subpopulation(15 March,9 to 26 March 2018,F2,21=22.81,P<0.001;Fig.2A).However,tagged geese from the Anadyr-China and Chaun-South Korea subpopulations arrived in summering sites on average on 11 May(5–14 May)and 15 May(6–29 May 2017)respectively,about 20 days earlier than those of Central Arctic-China subpopulation,on 2 June(30 May to 18 June 2017)(F2,21=25.57,P<0.001;Fig.2B).The average migration duration of the three subpopulations in spring was around 76 days(60.7–97.6 days).Migration duration of the Central Arctic-China subpopulation was 97.57±9.04 days,significantly longer than that of Anadyr-China and Chaun-South Korea subpopulations(Anadyr:71.7±5.59 days;Chaun:60.7±10.79 days;χ2=46.04,df=2,P<0.001,Fig.3A;Table 2;Appendix Table S2).The stopover duration of the three subpopulations also showed a similar trend(χ2=25.47,df=2,P<0.001),the Central Arctic-China subpopulation had the longest stopover duration(91.7±8.56 days),significantly longer than those of Anadyr-China and Chaun-South Korea subpopulations(Anadyr:56.7±10.15 days;Chaun:65.5±5.11 days;Fig.3B;Table 2,Appendix Table S2).The Anadyr-China subpopulation had the longest migration distance,significantly longer than those of Central Arctic-China and Chaun-South Korea subpopulations(χ2=25.47,df=2,P<0.001;Fig.3C;Table 2).There was no significant difference between the three subpopulations in number of stopover sites and step length(Fig.3D and E;Table 2).
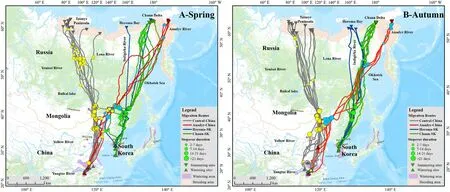
Fig.1.Distribution of migration routes and stopover sites of three subpopulations(Central Arctic-China,Anadyr-China,Chaun-South Korea)of Eastern Tundra Bean Goose(Anser fabalis serrirostris)wintering in the Yangtze River floodplain and west coast of South Korea,and breeding in the Arctic.A:Spring;B:Autumn.Different sizes of circle indicate the distribution and stopover duration of three subpopulations:yellow,green and blue represent Central Arctic-China,Chaun-South Korea,and Anadyr-China,respectively.Inverted triangles indicate summering sites and conventional triangles indicate wintering sites:grey,blue,green and red indicate the summering sites and wintering sites of Central Arctic-China,Anadyr-China,Herma-South Korea(SK)and Chaun-South Korea(SK)birds,respectively.The pale orange shading of the far north indicates the known breeding area of the ETBG,and the mauve shading represents their wintering range(Li et al.,2020b).The map follows the Albers projection with the central longitude of 120°.
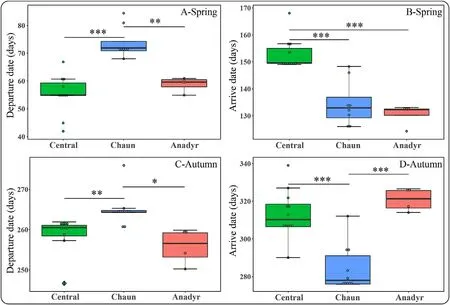
Fig.2.Comparisons of migration departure(A:Spring;C:Autumn)and arrival dates(B:Spring;D:Autumn)among individuals from the three subpopulations(Central Arctic-China,Chaun-South Korea,Anadyr-China)of Eastern Tundra Bean Goose(Anser fabalis serrirostris)in spring and autumn.Spring:Central,n=11;Chaun,n=8;Anadyr,n=4;Autumn:Central,n=12;Chaun,n=10;Anadyr,n=4.The solid lines in the box denote the median value and box edges show the upper and lower quartiles.The maximum and minimum showed the largest and lowest data point excluding any outliers and the solid circles show outliers.“*”means 0.01≤P<0.05;“**”means 0.001≤P<0.01;“***”means P<0.001.
The three subpopulations of ETBG left summering sites after 105–129 days(Central Arctic-China:mean=105 days,range:90–112 days;Chaun-South Korea:mean=129 days,range:112–138 days;Anadyr-China:mean=125 days,range:121–127 days).There was no significant difference in mean autumn migration departure date and arrival date of birds from the Central Arctic-China compared to Anadyr-China subpopulations.Chaun-South Korea subpopulation geese left the summering sites significantly later(F2,22=7.355,P=0.003;Fig.2C)although they arrived at the wintering sites about 20 days earlier(F2,22=21.97,P<0.001;Table 1,Fig.2C and D).There was no significant difference in mean migration duration and stopover duration of the Central Arctic-China and Anadyr-China subpopulation geese,but both were significantly longer than birds from the Chaun-South Korea subpopulation(Fig.3A and B;Table 2).The Anadyr-China subpopulation had the longest migration distance,significantly longer than those of Central Arctic-China and Chaun-South Korea subpopulations(Fig.3C;Table 2),being consistent with that in spring migration.There was no significant difference in migration duration and stopover duration among the three subpopulations,(Fig.3D and E;Table 2).

Table 1 The differences in migration departure and arrival dates(mean±SD)between individuals from the three subpopulations(Central Arctic-China,Chaun-South Korea,Anadyr-China)of Eastern Tundra Bean Goose(Anser fabalis serrirostris)in spring and autumn.
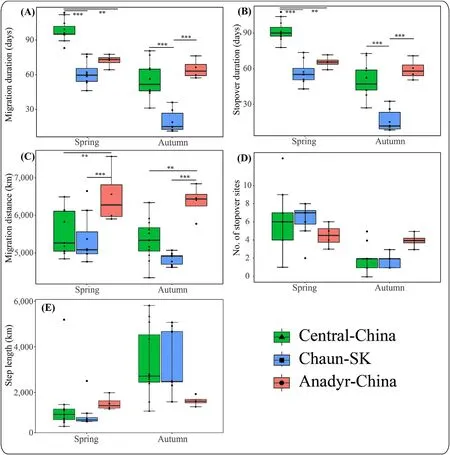
Fig.3.Comparison between migration duration(A),stopover duration(B),migration distances(C),number of stopover sites(D)and step length(E)of individuals from the three subpopulations(Central Arctic-China,Chaun-South Korea,Anadyr-China)of Eastern Tundra Bean Goose(Anser fabalis serrirostris)in spring and autumn.Spring:Central,n=11;Chaun,n=8;Anadyr,n=4;Autumn:Central,n=12;Chaun,n=10,Anadyr,n=4.The solid lines in the box denote the median value and box edges show the upper and lower quartiles.The maximum and minimum show the largest and lowest data point excluding any outliers and the solid circles show outliers.“*”indicates 0.01≤P<0.05;“**”indicates 0.001≤P<0.01;“***”indicates P<0.001.
Migration duration and stopover duration of Central Arctic-China and Chaun-South Korea subpopulations in spring were significantly longer than those in autumn(P<0.001;Table 2),but there was no significant difference between those of the Anadyr-China subpopulation(P>0.05).For the three subpopulations,there was no significant difference in migration distance between seasons,but ETBG used significantly more stopovers in spring than that in autumn(χ2=31.30,df=1,P<0.001),and the mean step lengths in spring were significantly shorter than those in autumn(χ2=21.69,df=1,P<0.001;Table 2).
3.3.Differences in habitat-use of subpopulations by day and night
In summer,geese from all three populations almost exclusively used tundra(86–89%)and wetland(5%–10%)habitats throughout 24 h of daylight in the arctic(Fig.4),whereas diurnal differences in habitat-use of subpopulations was very evident in all three other seasons.In spring and autumn,birds from the Central Arctic-China subpopulation mainly used grassland(in spring:day vs.night:56%vs.62%;in autumn:day vs.night:55%vs.51%)and cropland(in spring:day vs.night:25%vs.22%;in autumn:day vs.night:34%vs.19%;all P>0.05);wetlands were used rarely(2–3%).In winter,Central Arctic-China birds used cropland more for foraging in daytime(day vs.night:62% vs.19%;χ2=22.827,P<0.001),but more frequently used wetlands for roosting at night(day vs.night:26%vs.76%;χ2=24.51,P<0.001).Birds from the Chaun-South Korea subpopulation showed short stopover duration times in autumn(n=10).They showed similar proportional use of the four habitat types,with no significant differences between day and night,except for greater use of wetland during daytime(day vs.night:22%vs.10%;χ2=4.5,P=0.034).In spring and winter,the same birds mainly used cropland and wetland,the latter more frequently by night(in spring:day vs.night:18% vs.33%;χ2=4.412,P=0.036;in winter:day vs.night:24% vs.47%;χ2=7.451,P=0.006;Fig.5;Table 3).During spring and autumn migration,birds from the Anadyr-China subpopulation mainly used cropland(in spring:day vs.night:55%vs.38%;in autumn:day vs.night:25% vs.16%)and grassland(in spring:day vs.night:31% vs.38%;in autumn:day vs.night:35%vs.30%).With the exception of greater use of wetland by night(χ2=12.6,P<0.001),these geese showed no significant differences between day and night.In winter,the same birds used more cropland by day(day vs.night:37%vs.6%;χ2=19.6,P<0.001),but more wetland at night(day vs.night:62%vs.92%;χ2=5.844,P=0.016),similar to the behaviour of the Central Arctic-China subpopulation geese.

Table 2 Estimated regression parameters,standard errors,profile confidence intervals(2.5% PCL and 97.5% PCL),χ2 values,df and P values for each predictor variable to investigate the effects of season and subpopulation(as fixed effects)on the migration duration,stopover duration,migration distance,number of stopover sites and step length of Eastern Tundra Bean Goose(Anser fabalis serrirostris).
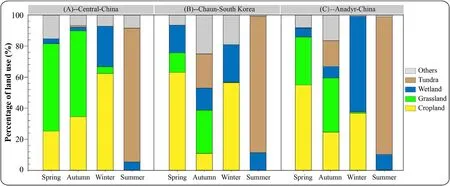
Fig.4.Comparison between the land use classification types at sites used by individuals from the three subpopulations of Eastern Tundra Bean Goose(Anser fabalis serrirostris)during daytime tracked in spring,summer,autumn,and winter.A presents results from the Central Arctic-China subpopulation,B from the Chaun-South Korea subpopulation and C from the Anadyr-China subpopulation.
The three subpopulations of ETBG also showed differences in their use of habitat types at the same periods of their life cycle.By day,birds from the Central Arctic-China subpopulation used grassland more in spring(χ2=27.98,df=2,P<0.001),when geese from the Chaun-South Korea and the Anadyr-China subpopulations used cropland more(χ2=16.839,df=2,P<0.001).In autumn,geese from all three subpopulations tended to use all four habitat types during daylight without dominant preferences.In winter,geese from both the Central Arctic-China and Chaun-South Korea subpopulations used cropland more than Anadyr-China geese(χ2=8.579,df=2,P=0.014),but wetlands significantly less(χ2=24.5,df=2,P<0.001;Fig.4).At night,the Central Arctic-China subpopulation used more grassland and cropland in spring and autumn,but used more wetland in winter.Geese from the Chaun-South Korea subpopulation used all four habitat types equally in autumn,but used cropland and wetland more in spring and winter.Anadyr-China subpopulation geese used all four habitat types without dominant preferences in autumn,but used more grassland and cropland in spring,and significantly more wetland in winter(χ2=14.521,df=2,P=0.001;Figs.4 and 5;Table 4).

Table 3 The diurnal differences in land use classification types used by individuals from each of the three subpopulations(Central Arctic–China,Anadyr–China,Chaun–South Korea)of Eastern Tundra Bean Goose(Anser fabalis serrirostris)in three seasons(spring,autumn,and winter).The P value<0.05 and its χ2 value were bolded.
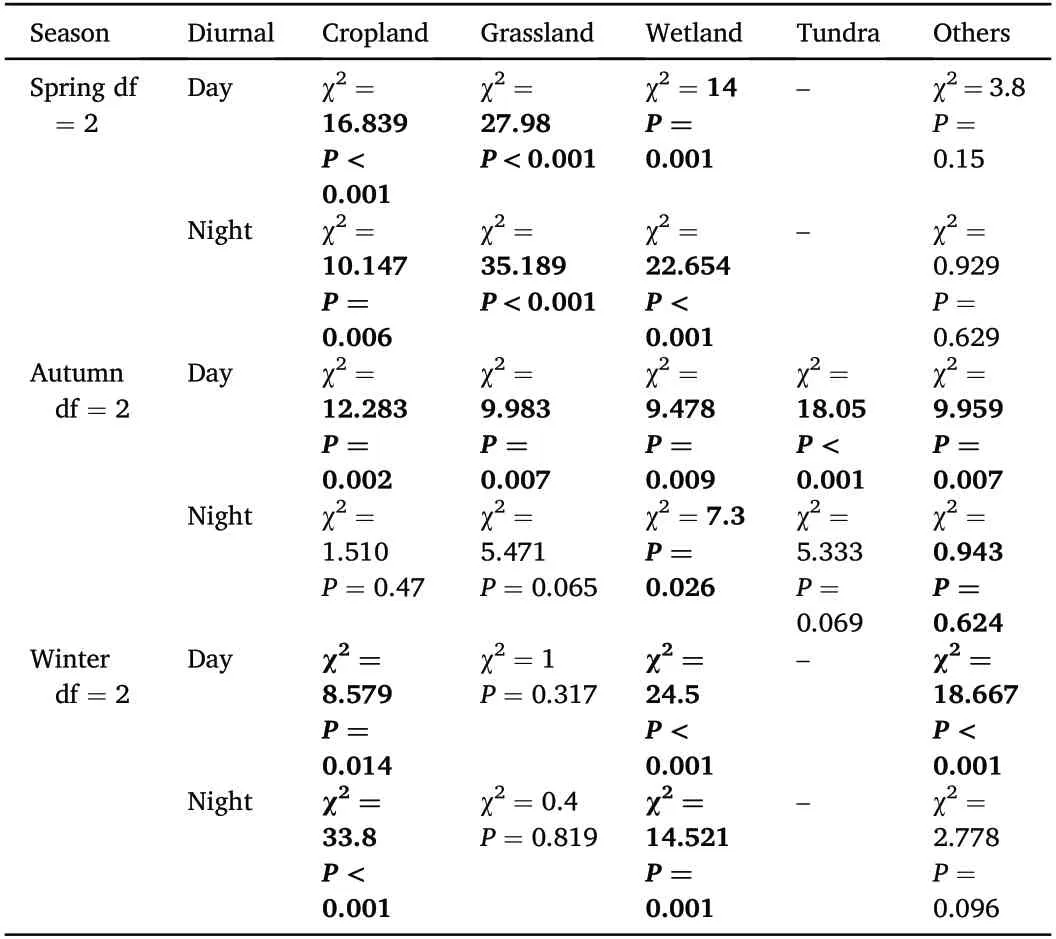
Table 4 The seasonal differences in land use classification types used by individuals from the three subpopulations(Central Arctic–China,Anadyr–China,Chaun–South Korea)of Eastern Tundra Bean Goose(Anser fabalis serrirostris)during day and night.The P value<0.05 and its χ2 value were bolded.
4.Discussion
Results from this tracking study confirmed our predictions that geese from the three subpopulations of the Eastern Tundra Bean Geese,defined by their allopatric breeding ranges,show significant differences in their patterns of migration and habitat-use throughout the annual cycle away from the breeding grounds.The mean migration distance of Central Arctic-China and Chaun-South Korea individuals did not differ significantly,but that of Anadyr-China birds was 15–24%longer.Despite this,mean spring and autumn migration durations were longest in Central Arctic-China birds,significantly longer than Anadyr-China birds,which were significantly longer than Chaun-South Korea birds,due to differences in stopover duration.Autumn migration duration of Central Arctic-China and Chaun-South Korea individuals was significantly shorter than in spring,with fewer,shorter stopovers,contrasting no significant difference in migration and stopover duration or numbers of stopovers between spring and autumn among Anadyr-China ETBG,showing this is a plastic trait within subpopulations,a likely response to prevailing conditions.The very long average step length(>3200 km)of Central Arctic-China and Chaun-South Korea subpopulations in autumn showed the ability of these birds to fly very long distances in a single leg.This contrasted with the significantly shorter step length(<1500 km)and more stopovers of the two subpopulations in spring.These strands of evidence are further potential support that the spring migration of largebodied Arctic-breeding species,accumulating extra energy at successive stopover sites along each of the migration corridors is restricted by thaw conditions that constrain their progress towards their respective breeding areas(Lameris et al.,2018;Wang et al.,2018;Li et al.,2020b).This is despite the fact that the autumn migration shows the birds theoretically able to complete much of the migration in far longer uninterrupted legs,undoubtedly due to the need of spring-migrating females to accumulate nutrients and energy for investment in egg-laying,incubation and self-maintenance until hatching.However,this was not the case for the Anadyr-China subpopulation,which showed very modest differences in migration duration,stopover duration and numbers of stopovers between the two migration episodes.However,we should be cautious of concluding too much from a relatively limited sample size and urge for the tracking of more individuals to add power to further analysis in future research.

Fig.5.Comparison between the land use classification types at sites used by individuals from the three subpopulations of Eastern Tundra Bean Goose(Anser fabalis serrirostris)during night-time tracked in spring,summer,autumn,and winter.A presents the results from individuals of the Central Arctic-China subpopulation,B from the Chaun-South Korea subpopulation and C from the Anadyr-China subpopulation.
All three subpopulations showed significant seasonal and diurnal differences in habitat-use,but in winter,all were consistent in using wetlands more at night and cropland during daytime.Central Arctic-China and Chaun-South Korea ETBG used grassland and croplands combined>50% and wetlands<35%,whereas despite sympatry with Central Arctic-China,Anadyr-China mainly used wetlands>50% and only 35% grassland and croplands.The rapid increases in European,North American,Korea and Japanese goose populations have been related to their shifts to feeding on agricultural land(Fox and Abraham,2017;Fox et al.,2017).It is interesting that ETBG is one of the few geese wintering in China that are showing rapid recent increases and they were among the first geese there to shift to farmland feeding,despite being limited by human pressure(Zhao et al.,2018).Earlier studies of ETBG distribution and diet at their important wintering sites in the Yangtze River floodplain(Cheng et al.,2009)showed that,besides their dominant natural wetland habitat,ETBG showed diverse habitat-use and diet(Zhao et al.,2010).The species were observed foraging in croplands adjacent to the lake in winter(including at night)in response to challenges such as food depletion,confirmed by analysis of goose feces collected fromwinter wheat fields that contained 67%wheat compared to 33%natural grass species and others(Zhao et al.,2010,2015).Furthermore,by overlaying wintering ETBG GPS tracking data during 2014–2017 upon official China land use maps,ETBG were confirmed to use farmland around Poyang Lake(4.3%at night and 13.2%by days,Yu et al.,2017).This differed from the other tracked goose species in that study,which almost entirely used natural wetlands at the same site,such as Swan Goose(A.cygnoides),Greater White-fronted Goose(A.albifrons),Lesser White-fronted Goose(A.erythropus,Yu et al.,2017).In contrast,despite showing considerable overlap in spatial distribution and diet with ETBG,studies of Greater White-fronted Geese showed them to be diurnal sedge meadow specialists relying on natural wetlands,almost never feeding in other habitats(Zhao et al.,2015;Yu et al.,2017).Thie Greater White-fronted Goose has shown long-term declines since the 1990s in numbers wintering in China,but wintering numbers have increased in Japan and South Korea(Deng et al.,2020),where birds have benefitted from the increase in availability of rice paddies to which they commonly resort to feed(Kim et al.,2016;Fujioka et al.,2011).The fact that the Anadyr-China ETBG still use wetlands more frequently than farmland would make it a perfect test of the hypothesis that they suffer poorer fitness measures(survival and young production)than other ETBG subpopulations using farmland to a greater degree.Alas,because both subpopulations return in sympatry to China at the same time,we can monitor neither the abundance nor the annual breeding success of these three subpopulations separately in any meaningful way that can identify these annual parameters among geese purely from the China-Anadyr and other subpopulations to compare between them.
Migration patterns differed between the three ETBG subpopulations,suggesting adaptations and responses to differing conditions prevailing along their migration routes.The significantly longest spring migration duration(c.98 days)of the Central Arctic-China subpopulation,was more than 30 days greater than that of the other two subpopulations.This difference can be explained by the generally later spring snow-melt related to the extremely high breeding latitude of the central Russian Arctic although The Chaun-South Korea birds also breed on Russia's far north coast.Alternatively,their significantly prolonged stopover duration at stopover sites(c.92 days),which exceeded those in the other two subpopulations by more than 30 days,may simply be imposed on the geese by the slow progression of melt and additional energetic expenditure along their spring migration route.This may especially be because these geese almost entirely feed on natural habitats at the stopovers of high latitude within Russia(Li et al.,2022).
5.Conclusions
High-precision GPS-GSM telemetry results from 29 East Asian ETBG confirmed predicted differences in migration patterns and habitat-use between individuals from three different subpopulations.Telemetry data also demonstrated that the subpopulations of ETBG showed a variety of different habitat-use patterns according to season and by day/night,indicating a high level of adaptability to the availability of nutritional and energetic resources in the environment along their respective migration corridors.We would like to infer that the increases in the population size of both Tundra subspecies of the Bean Goose wintering in Europe and East Asia are therefore showing behavioral flexibility by responding to the increasingly profitable feeding opportunities provided by agricultural surpluses on the wintering and spring/autumn staging areas.However,we require far more evidence to support this hypothesis.For this reason,we urge continued tracking of greater numbers of ETBG individuals,which might hopefully provide evidence of temporal or spatial segregation(e.g.on staging areas)in the future,which might aid us to separate individuals from these subpopulations at other points in the annual cycle.We also recommend testing for further evidence of subpopulation isolation by looking for genetic differences between individuals from the respective subpopulations(confirmed from tracking data post collection of DNA material).
From a conservation perspective,this study confirmed the discrete nature of the three flyways,underlining the need for separate research and conservation management strategies for the discrete biogeographical subpopulations.The results also confirmed the outstanding importance of Northeast Asia as the most important area of energy refueling sites and stopovers for ETBG during spring and autumn migration.Under the implementation of China's future Northeast Revitalization Strategy and Northeast Asia regional coordinated development strategy and the continuous improvement of per capita living standards(https://www.ndrc.gov.cn/fggz/fzzlgh/gjfzgh/202112/t20211225_1309709.html?
code=&state=123),the potential risk of habitat loss and degradation might increase with new local development,such as the building of new roads and tourist scenic development,and we are concerned for the future of the remaining natural habitats of this region.Clearly,if some ETBG are better able to adapt to feeding on agricultural landscapes than birds of other subpopulations,this may have conservation management implications for the different subpopulations.For this reason,we urge continued monitoring of these subpopulations to follow their population dynamics and changes in population size.Such research should be combined with more telemetry and ground studies to better understand their changing relationships with the temporal and spatial changes in quality and availability(and goose usage)of wetlands and agricultural landscapes in Northeast Asia,as well as the effects of increasing human disturbance there.
Authors’contribution
LDC,LC,FJM,JZ,CL,QSZ,HL,DS,and ADF conceived the ideas and designed methodology;JZ,QSZ,HL,and DS collected the data;and JZ,CL and FJM analyzed the data.FJM led the writing of the manuscript,with contributions from ADF.All authors contributed critically to the drafts,read and approved the final manuscript.
Availability of data and materials
The data generated or analyzed during this study are included in this published article and its supplementary information files.
Ethics statement
This study was examined and approved by the Animal Ethics Committee,Research for Eco-Environmental Sciences,Chinese Academy of Sciences,and was conducted under permission No.rcees-ddll-001.Approval for bird capture and transmitter deployment was obtained from China(Jiangxi Forestry Bureau,reference numbers:Ganlinban 201647),Korea(Gimpo City,Gyunggi Province,reference number:160111-0101967),Russia(Federal Service for Technical and Export Control,reference number:No.229).
Funding
The study was supported by the National Natural Science Foundation of China(Grant No.31970433,and No.31870369),China Biodiversity Observation Networks(Sino BON),and Joint CAS-MPG Research Project(Grant No.HZXM20225001Mi).
Declaration of competing interest
The authors declare they have no competing interests.
Acknowledgements
We gratefully acknowledge the enormous contributions of the fieldwork teams in China(Xin Wang,Qin Zhu,Lei Fang,Dehai Gu,Xianghuang Li,Peiru Ao),Korea,and Russia(Chaun Delta team:Georgiy Pavluykov,Daria Barykina,Harald Ris,Gleb Danilov,Sergey Vartanyan and Olga Prokopenko).The Chaun catching team is grateful to the Chukotka Mining Co.of Kinross Gold Corporation for logistic and transportation support.
Appendix A.Supplementary data
Supplementary data to this article can be found online at https://do i.org/10.1016/j.avrs.2022.100062.
杂志排行
Avian Research的其它文章
- Use of 3D-printed animal models as a standard method to test avian behavioral responses toward nest intruders in the studies of avian brood parasitism
- Context dependent song-flight performance and timing in the Black-headed Bunting(Emberiza melanocephala)
- Habitat selection and food choice of White-naped Cranes(Grus vipio)at stopover sites based on satellite tracking and stable isotope analysis
- Year-round multi-scale habitat selection by Crested Tit(Lophophanes cristatus)in lowland mixed forests(northern Italy)
- Definition of spatial positions within foraging Greater White-fronted Geese flocks from an individual's perspective:Cost-benefit dynamics change with the distance to flock edge
- Urban avifauna distribution explained by road noise in an Eastern European city