Identifying Summer/Autumn Habitat Hotspots of Jumbo Flying Squid (Dosidicus gigas)off Chile
2022-12-27YUWeiFENGZhipingLINanCHENBingjianandCHENXinjun
YU Wei , FENG Zhiping LI Nan CHEN Bingjian , and CHEN Xinjun
1)Shandong Marine Resources and Environment Research Institute, Yantai 264006, China
2)College of Marine Sciences, Shanghai Ocean University, Shanghai 201306, China
3)National Engineering Research Center for Oceanic Fisheries, Shanghai Ocean University, Shanghai 201306, China
4)Key Laboratory of Sustainable Exploitation of Oceanic Fisheries Resources, Ministry of Education, Shanghai Ocean University, Shanghai 201306, China
5)National Ocean Satellite Shandong Data Application Center, Yantai 264006, China
Abstract Abundance and distribution of jumbo flying squid (Dosidicus gigas)are evidently influenced by the changes of marine environment. In this study, the maximum entropy (MaxEnt)model was applied to examine the impacts of marine environmental variables on its potential distribution, and identified habitat hotspots of D. gigas in summer and autumn along the coast of Chile. The MaxEnt model was constructed by using the fisheries data of D. gigas from summer to autumn during 2011 – 2017 combined with critical environmental factors including mixed layer depth (MLD), sea surface salinity (SSS), sea surface height (SSH)and water temperature at depths of 0 m, 25 m, 50 m, 100 m, 150 m, 200 m, 300 m, 400 m and 500 m. Results showed that the actual fishing efforts of D. gigas in summer and autumn were mostly distributed in the suitable habitat, indicating that the MaxEnt model can well predict the habitat hotspots of D. gigas off Chile. The key environmental factors and their suitable ranges for D. gigas showed significant intermonthly changes from December to May. The critical environmental factors of D. gigas off Chile were MLD, SSH, water temperature at different depths in summer (Temp_25 m in December, Temp_300 m in January and Temp_400 m in February)and SSH, SSS,Temp_400 m in autumn. Our findings suggest that selecting the key environmental factors is vital to study the potential distribution of D.gigas off Chile in each month to explore its habitat hotspots.
Key words Dosidicus gigas; MaxEnt model; environmental effects; habitat hotspots; key environmental factors; off Chile
1 Introduction
The low-velocity eastern boundary California Current and Humboldt Current flow northward and southward, respectively, constituting a complex surface oceanographic region in the eastern Pacific Ocean (Waluda et al., 2006).Humboldt Current System is one of the high productivity ocean currents in the eastern Pacific Ocean, including many economically important pelagic species such as anchoveta(Engraulis ringens)and jumbo flying squid Dosidicus gigas with high annual catch in the Southeast Pacific Ocean(Alheit and Bakun, 2010; Bertrand et al., 2016; Ramos et al.,2017; Yu et al., 2019, 2021). Due to the influences of environmental conditions, the abundance and spatio-temporal distribution of marine species have changed dramatically (Barange et al., 2009). For example, with the influences of moderate or strong-intensity El Niño events, extensive Trachurus murphyi juvenile migrated into the southern waters off Chile, while the adult T. murphyi moved southwestward; however, this phenomenon hardly occurred in the weak-intensity El Niño events (Arcos et al., 2001). Engraulis ringens preferred to live in cold water and Sardinops sagsx was opposite to it (Oozeki et al., 2019). Therefore, understanding the impacts of environmental conditions on the distribution of marine species is helpful to understand how the species seek stable environment for obtaining longer survival time and extensive growth space (Chen et al., 2016; Yu et al., 2019, 2021).
D. gigas is a commercial cephalopod with a short lifecycle. It is extensively distributed in the eastern Pacific Ocean and extremely sensitive to the environmental conditions (Markaida et al., 2004; Yu et al., 2019, 2021). D. gigas occupies the middle position of the food chain and plays a vital role in marine ecosystem, acting as a top predator for low-trophic organisms such as Hemigrammus ocellifer,anchovy, sardine, while as a pivotal prey for high-trophic organisms such as Physeter catodon and shark (Uchikawa et al., 2009; Bazzino et al., 2010; Yu et al., 2019, 2021).Now the fishing ground of D. gigas is mainly distributed in the water off Peru, Equator and Chile. Main fishing countries include eastern Pacific coastal states and Asia-Pacific countries such as Peru, Chile, Japan, China, South Korea. Chilean fishing ground is one of the most important fishing grounds for catching D. gigas (Liu et al., 2015; Morales-Bojórquez and Pacheco-Bedoya, 2016; Yu et al., 2019).China began fishing D. gigas in the high sea of Chile in 2004, while annual catch of D. gigas in China changed significantly (Fang et al., 2014; Feng et al., 2017; Yu et al.,2019, 2021). At present, the catch of D. gigas off Chile has occupied an vital position in cephalopod production in China and even in the world (Chen et al., 2019; Yu et al., 2019).
Due to the extremely sensitivity of D. gigas to environment, the varieties of habitat conditions can induce rapid responses of its stock, resource abundance and spatial location in a short time, resulting in fluctuant catches of D. gigas with significant differences between years and months (Waluda et al., 2006; Li et al., 2017; Yu and Chen, 2018; Feng et al., 2020a). In fact, the impacts of environmental factors on D. gigas were different from month to month. There might be key environmental factors with high impacts and nonkey environmental factors with low impacts in different time scales. The impacts from different environmental factors should be differed for different time scales. At present, some existing methods and models have been used to explore the response of resource abundance and the distribution of fishing ground of marine species to environmental changes(Tian et al., 2009; Li et al., 2016; Yu et al., 2019). However, these methods or models ignored the environmental impacts on species, which made their accuracy for detecting fishing grounds not reliable. Therefore, it is essential to establish a relationship model for selecting the key environmental factors and evaluating or predicting the fishing ground of D. gigas off Chile, which is vital to the D. gigas fishing industry in the Southeast Pacific Ocean off Chile.
Maximum entropy (MaxEnt)model is based on the regional environmental and species existence data of its distribution. It is a machine-learning-method based on ‘current existence’ to predict ‘unknown distribution’ by selecting the distribution with the largest probability of species existence as its optimal potential distribution (Alabia et al.,2015a; Siregar et al., 2019). At present, MaxEnt model has been largely applied to management services, conservation and identification of places suitable for the cultivation of crops (Zhu et al., 2013). It also has been successfully used in a broad range of terrestrial and marine applications. For example, Alabia et al. (2015b)used MaxEnt model constructed in 2001 to predict the potential habitat distribution of the neon flying squid (Ommastrephes bartramii)in 2002 –2004. The results showed that the prediction effect in winter was better than that in summer, which may be due to the strong migration activity of O. bartramii in summer, resulting in large sampling range deviation of sample data. Feng et al. (2020b)constructed the MaxEnt model to simulate and predict the seasonal variation of the habitat distribution of T. murphyi, and found that there were monthly differences in environmental factors affecting the potential distribution of T. murphyi.
In this study, the MaxEnt model was constructed to assess the effects of marine environment on the potential distribution and detect habitat hotspots of D. gigas off Chile according to the combination of the fisheries data and environmental variables including mixed layer depth (MLD),sea surface salinity (SSS), sea surface height (SSH)and water temperature at different depths (including 0 m, 25 m,50 m, 100 m, 150 m, 200 m, 300 m, 400 m and 500 m)from December to May during 2011 – 2017. The main purposes of this study were to 1)assess the impacts of environmental conditions on monthly habitat changes; 2)select the key environmental factors affecting the distribution of D. gigas;3)explore the fishing ground of D. gigas off Chile.
2 Materials and Methods
2.1 Fisheries and Environmental Data
Fisheries data of D. gigas were originated from the National Data Center of Distant-water Fisheries of China,Shanghai Ocean University. Data were grouped by 0.5˚ ×0.5˚ grid cell and by month, covering the main fishing months from December to June in 2011 – 2017. Data information mainly includes fishing longitude and latitude, fishing date(year and month), fishing effort (in days)and catch (unit:ton). The study region covered the range between 20˚ –47˚S and 70˚ – 97˚W, which was the main colony area of D.gigas in Chilean waters in summer and autumn (Fig.1)(Qian et al., 2008; Yu et al., 2019).
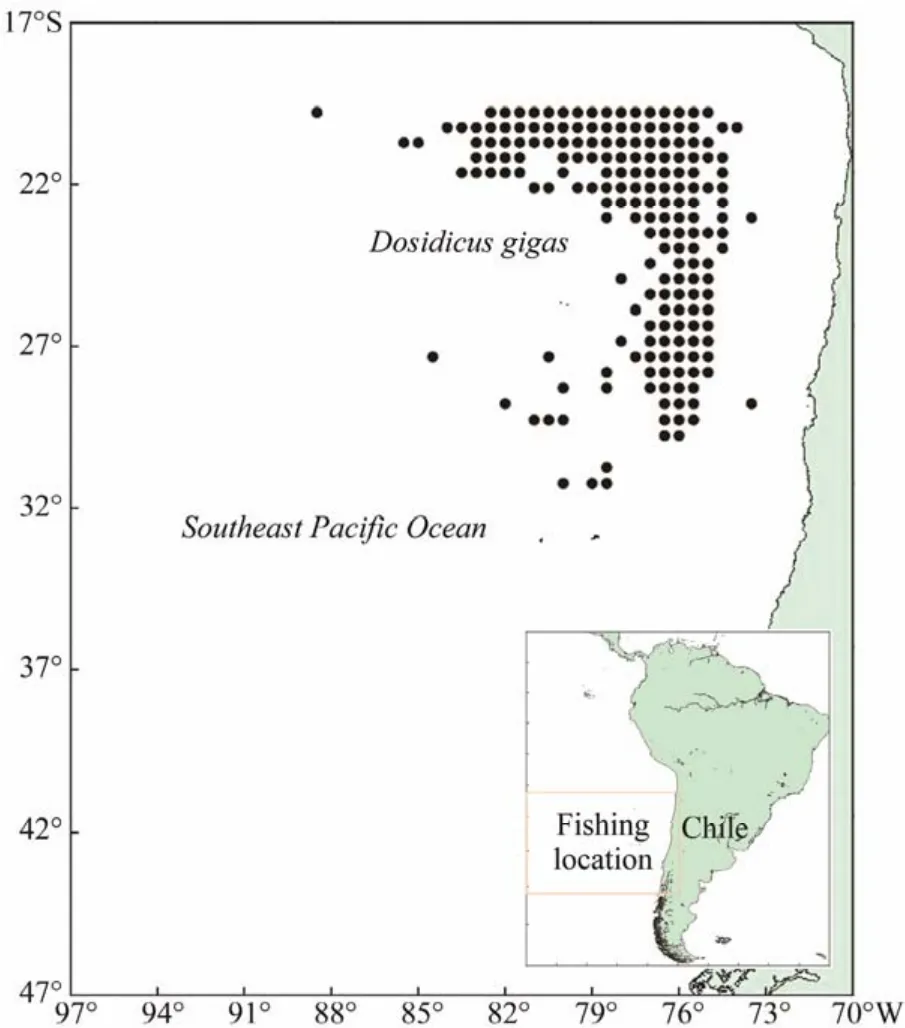
Fig.1 Fishing locations of Chinese squid-jigging fishing fleets in the Southeast Pacific Ocean off Chile.
There was a notion of consistency from the previous studies that sea surface temperature (SST), sea surface height(SSH), sea surface salinity (SSS)and mixed layer depth(MLD)were the potential environmental factors that contributed the variability in the abundance and distribution of D. gigas (Arkhipkin et al., 2015; Medina et al., 2017). At the same time, due to the strong vertical movement of this squid species, SSH, SSS, MLD, SST together with water temperature at different depths (including Temp_0 m, Temp_25 m, Temp_50 m, Temp_100 m, Temp_150 m, Temp_200 m,Temp_300 m, Temp_400 m and Temp_500 m)were selected to construct the MaxEnt model in this study. All environmental data were obtained from the website http://apdrc.soest.hawaii.edu/las_ofes/v6/dataset?catitem=71 and covered the study area between 20 – 47˚S and 70 – 97˚W during the period from December to June over 2011 – 2017. The temporal and spatial resolution of environmental data were matched with the fisheries data.
2.2 MaxEnt Model Construction and Validation
MaxEnt model is a maximum entropy species model which combines environmental layers with species occurrence data to identify the optimal distribution of the target species in the whole study area (Phillips and Dudik, 2008).In this study, MaxEnt model analyses were performed using MaxEnt software version 3.4.1k (http://biodiversityinformatics.amnh.org/open_source/maxent/)(Phillips et al.,2013). The fishing samples assimilated in the D. gigas existence data was the fishing position of each fishing vessel in each fishing month. The species existence data input form was ‘species name, longitude, latitude’, then stored in the format of CSV. The environmental layer data were the mean values for each environmental factor in each fishing month.All environmental data were converted from ArcGis 10.2 software to ASCII format for storage. Before the operation of MaxEnt model, 75% of the species distribution data were used as the training data, and the remaining 25% data were the test data. In order to eliminate the randomness and repetition number, the repeated operation times of the model was set to 10, which made the 10 equal sample data run in the way of cross-validation in the operation process. Regularization multiplier and iteration times were soft by default, and the results were output in the form of logistic.
Generally, receiver operating characteristic curve (ROC)generated automatically by MaxEnt model was used to evaluate the experimental performance of the model (Khanum et al., 2013). The ROC curve was drawn with the false positive rate as the abscissa and the true positive rate as the ordinate. The area under curve (AUC)enclosed by the ROC curve and the abscissa and ordinate was used as a measure of model accuracy. The value ranges from 0 to 1, that is,when the potential distribution of the simulated species is completely inconsistent with the actual distribution, the AUC value is 0; when the two completely match, the AUC value is 1 (Yackulic et al., 2013). For the model results, values of 0.5 ≤ AUC < 0.6, 0.6 ≤ AUC < 0.7, 0.7 ≤ AUC < 0.8,0.8 ≤ AUC < 0.9, 0.9 ≤ AUC < 1.0 were defined as failure,poor, average, good and excellent, respectively (Wang et al.,2015).
The existing probability results of D. gigas in ASCII format were analyzed by ArcGis 10.2 software and defined as habitat suitability index (HSI). The HSI value range was 0– 1, and ‘0’ indicated the most unfavorable habitat, while‘1’ indicated the most suitable habitat for D. gigas. The areas with HSI ≤ 0.2 and HSI ≥ 0.6 were defined as poor habitat and suitable habitat for D. gigas stock, respectively (Chen et al., 2010; Yu et al., 2019, 2021). The actual fishing data of D. gigas off Chile were superimposed with the simulation probability distribution to verify the simulation effect of the model.
2.3 Analysis of the Gravity Center of Fishing Ground and Suitable Habitat
The longitudinal and latitudinal gravity centers of fishing ground and suitable habitat can be used to reflect spatiotemporal changes of fishing grounds and distribution shift of species preferred habitat environment (Fang et al., 2014;Feng et al., 2020b). To examine the varieties of latitudinal and longitudinal location of suitable habitat and fishing ground with the change of environmental factors, the calculation formulas of LONG, LATG, LATGHSI, LONGHSIwere as follows (Yu et al., 2019; Feng et al., 2020b):
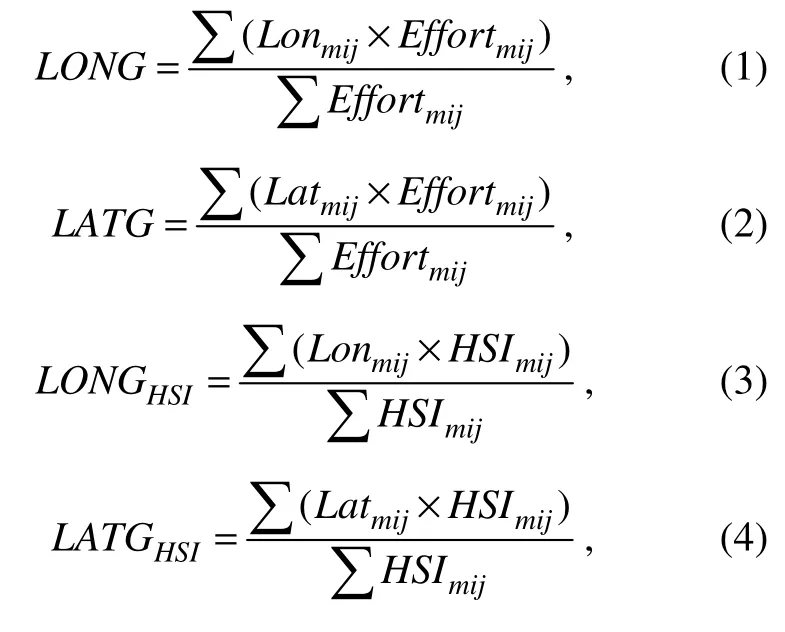
where Effortmijis the fishing effort of different fishing location in different months; Lonmij, Latmijare the longitude and latitude of fishing ground in different months; HSImijis the HSI value at different spatial positions in suitable habitat of fishing ground in different months.
2.4 Selection and Analysis of Key Environmental Factors in Each Month
The model gain was increased by changing the characteristic coefficient of a certain environmental variable, then the increment of model gain was assigned to this environmental variable in the model operation process. Finally, the gain increment was converted into a percentage, thus the contribution rate of each environmental variable in each month can be obtained (Urbani et al., 2015). The contribution rates of each environmental factor were ranked from high to low in each month. The top three variables with higher contribution rate were regarded as the key environmental factors in this month.
The data of the key environmental factors were matched with fisheries data in each month. The frequency distribution figures with key environmental variables as abscissa and fishing effort as ordinate were drawn by frequency statistics method, which was applied to estimate the suitable range of key environmental variables for D. gigas. Then,the response curve was drawn with the critical environmental variables as abscissa and the survival probability of D.gigas as ordinate when modeling with a single key environmental variable. The suitable range of key environmental variables in each month was obtained using the response curves and compared with the results from the frequency distribution figures to verify the rationality of the selection of key environmental factors. The temporal and spatial distribution of key environmental factors in each month was drawn and superimposed with actual fishing effort to analyze the spatial characteristics of suitable environment for D. gigas.
2.5 Spatial Patterns of Habitat Hotspots of D. gigas
In order to examine the prediction performance of the MaxEnt model for D. gigas off Chile using key environmental factors, the habitat hotspots of D. gigas offshore Chile in each month were predicted based on both the selected key environmental factors and the fisheries data from December to May in 2011.
3 Results
3.1 MaxEnt Model Performance and Habitat Characteristics of D. gigas
The results of MaxEnt model showed that all the monthly regional models performed significantly well with AUC higher than 0.9 from December to May in 2011 – 2017. Potential distribution of D. gigas habitat simulated by the monthly model was in good agreement with the actual fishing locations, implying that the model outputs were reliable (Table 1 and Fig.2). Potential habitat of D. gigas exhibited significantly monthly variations. It was observed that most fishing efforts were concentrated in the suitable habitats with higher HSI values. Except for the extensive distribution of D. gigas from north to south off Chile in January,the area of suitable habitats in other months was relatively stable bounded by 20˚ – 30˚S and 75˚ – 85˚W.
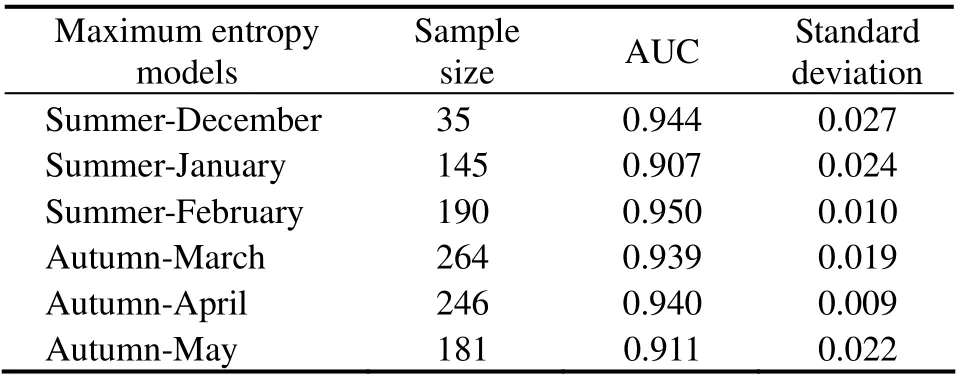
Table 1 Summary of simulation of Dosidicus gigas in summer (December, January and February)and autumn (March, April and May)
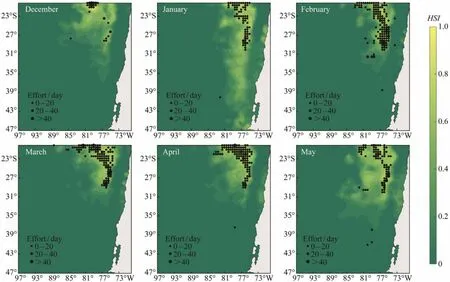
Fig.2 Spatial distribution of the probability (e.g., habitat suitability index)of Dosidicus gigas off Chile overlaid with actual fishing locations from December to May in 2011 – 2017.
3.2 Spatial Variation of Gravity Center of Fishing Ground and Suitable Habitat
Fig.3 showed the change trend of the gravity centers of the suitable habitat and fishing ground off Chile from December to May in 2011 – 2017. It was found that LONG and LATG were basically consistent with LONGHSIand LATGHSI.In the longitudinal direction, the gravity center of fishing ground and suitable HSI moved eastward from December to January and then was stable between 76.5˚W and 77.5˚W in other fishing months. In the latitudinal direction, the gravity center of fishing ground and suitable HSI obviously moved southward in December and May, in other months it was mainly located in the central and northern waters off Chile.

Fig.3 Longitudinal and latitudinal gravity center of fishing effort (LONG and LATG)and optimal habitat suitability index(LONGHSI and LATGHSI)of Dosidicus gigas off Chile from December to May in 2011 – 2017.
3.3 Selection of Key Environmental Factors and Their Temporal Distribution
The results of contribution rate of environmental factors in each month showed that the key environmental factors had clearly monthly differences (Table 2). In summer, MLD and SSH were included in the key environmental factors in December, January and February, but the preferred water temperature at different depths for D. gigas were diverse in each month (Temp_25 m in December, Temp_300 m in January and Temp_400m in February). In autumn, the key environmental factors of each month were same, which were SSH, SSS and Temp_400 m. The cumulative contribution rate of key environmental factors was 84.2%, 80.9%, 71.4%,81.9%, 83.4% and 78.6% in each month from summer to autumn in 2011 – 2017, respectively, indicating that these key environmental factors played an important role in the spatial-temporal distribution of the fishing ground of D.gigas off Chile.
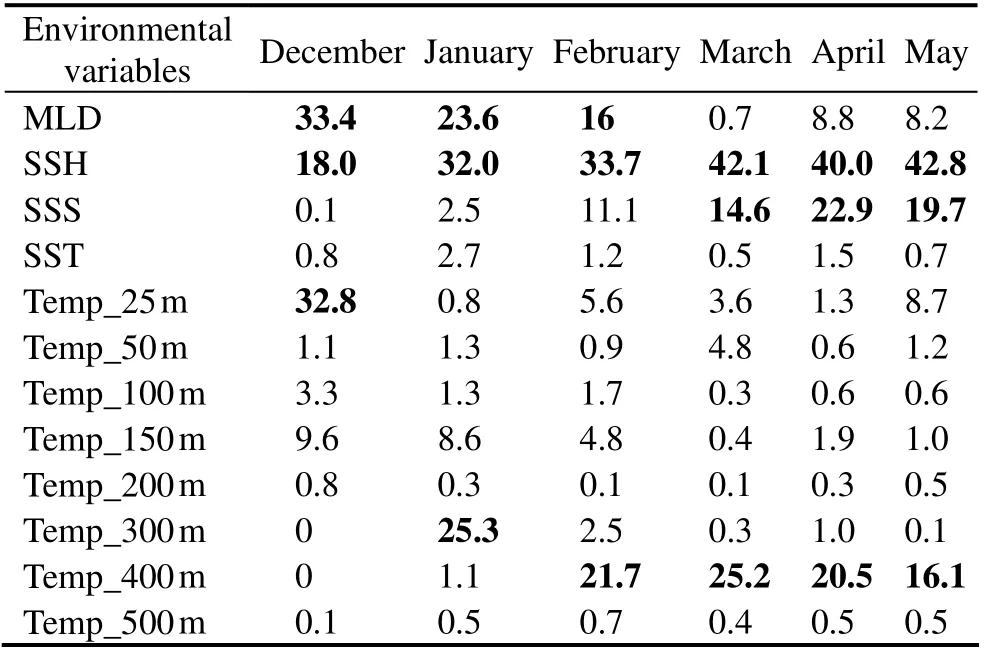
Table 2 Contribution rates of environmental factors of the fishing ground of Dosidicus gigas off Chile from December to May in 2011 – 2017
Variability trend of the mean SSH, SSS and Temp_25 m was basically similar, with a lower mean value and an upward trend in summer and a higher mean value and a downward trend in autumn (Fig.4). Variability trends of the mean MLD and Temp_300 m were contrary. MLD was the lowest in January and then increased in the following months,while Temp_300 m showed an increasing trend in January and then decreased in the next four months. For Temp_400 m,it first decreased from December to April and reached the minimum value in April, then slightly increased in May.
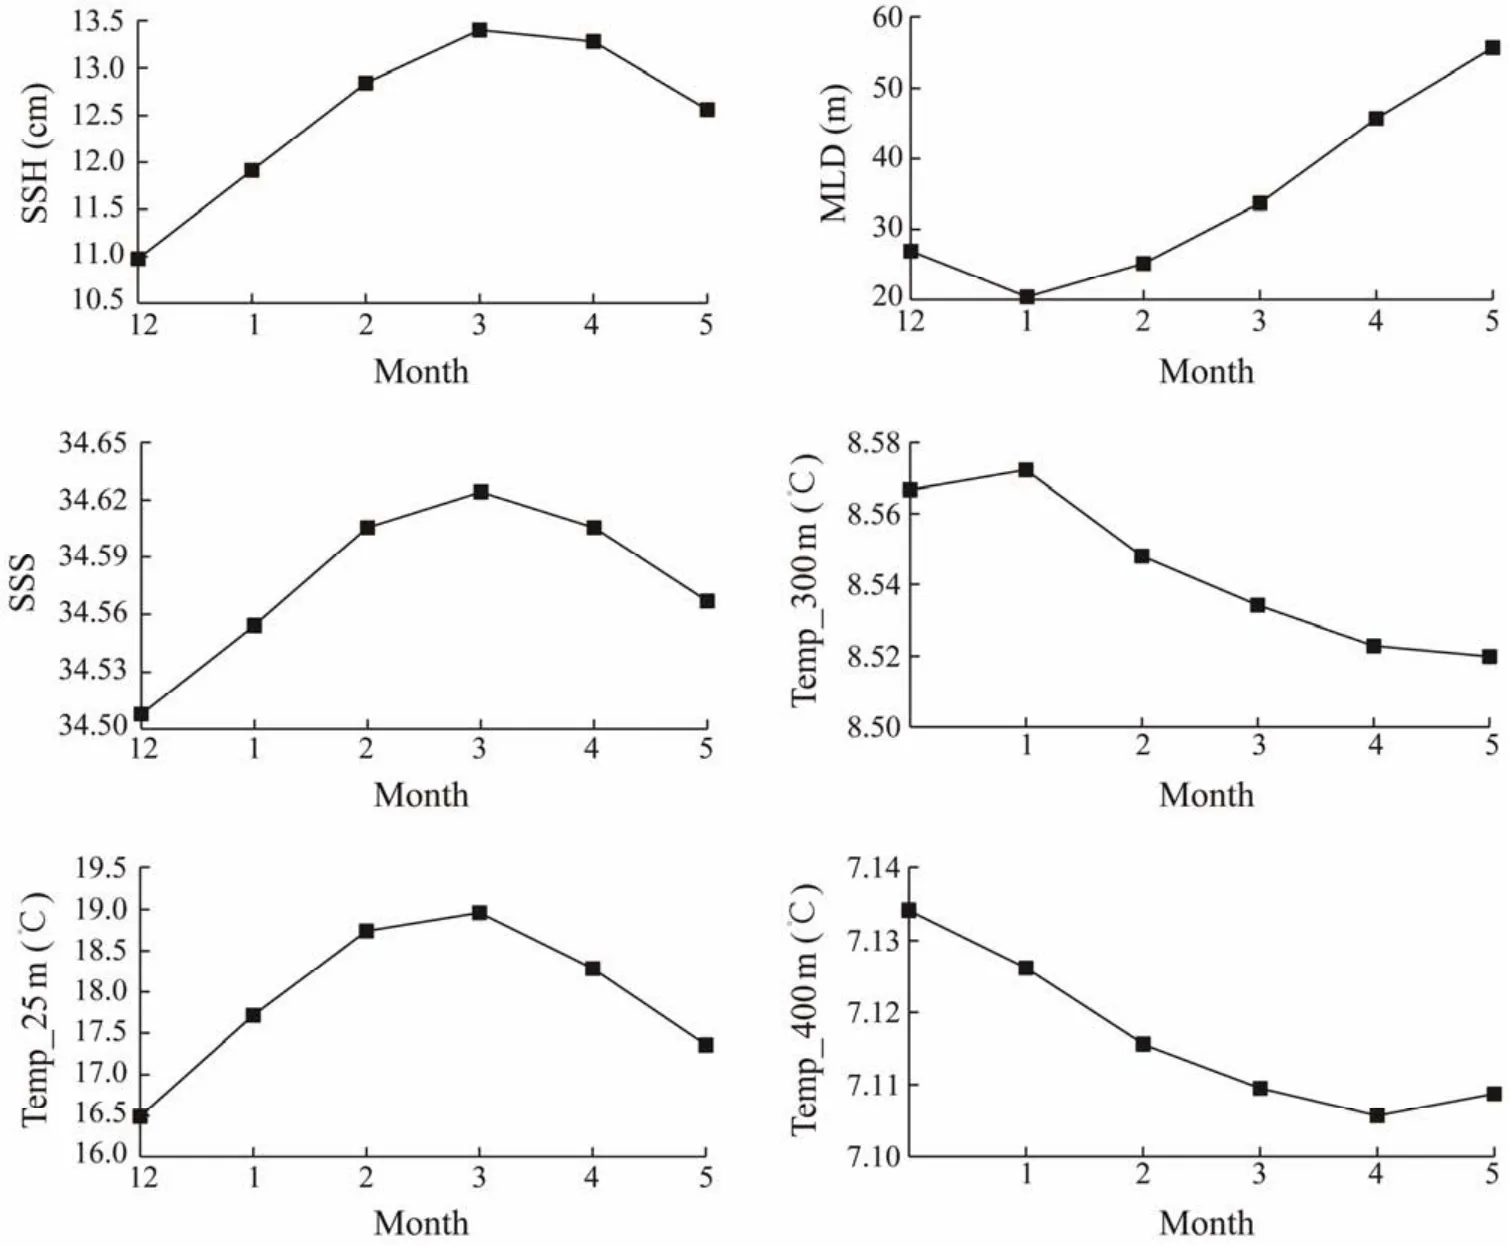
Fig.4 Monthly average value of the key environmental factors from December to May in 2011 – 2017.
3.4 Relationship Between Key Environmental Factors and D. gigas Stock
Probability of fitness and frequency distributions of fishing effort of D. gigas in relation to environmental parameters in summer and autumn during 2011 – 2017 were shown in Figs.5 and 6. Results showed that the suitable ranges of the key environmental factors affecting the distribution of D.gigas were basically the same based on the two methods (Table 3). Moreover, Figs.7a and 7b showed that the actual distribution of D. gigas in each month was basically located within the suitable range of key environmental factors.
3.5 Prediction Results of Habitat Hotspots Based on Key Environmental Factors
Based on the key environmental factors selected from 2011 – 2017 to predict the habitat hotspots of D. gigas in 2011, the forecast results suggested that the fishing effort from December to May in 2011 were mostly located in the predicted suitable habitats of D. gigas and more fishing effort correspond to higher HSI value (Fig.8), implying that the key environmental factors selected by the MaxEnt model can better evaluate and predict the spatial location of the D. gigas fishing ground off Chile.
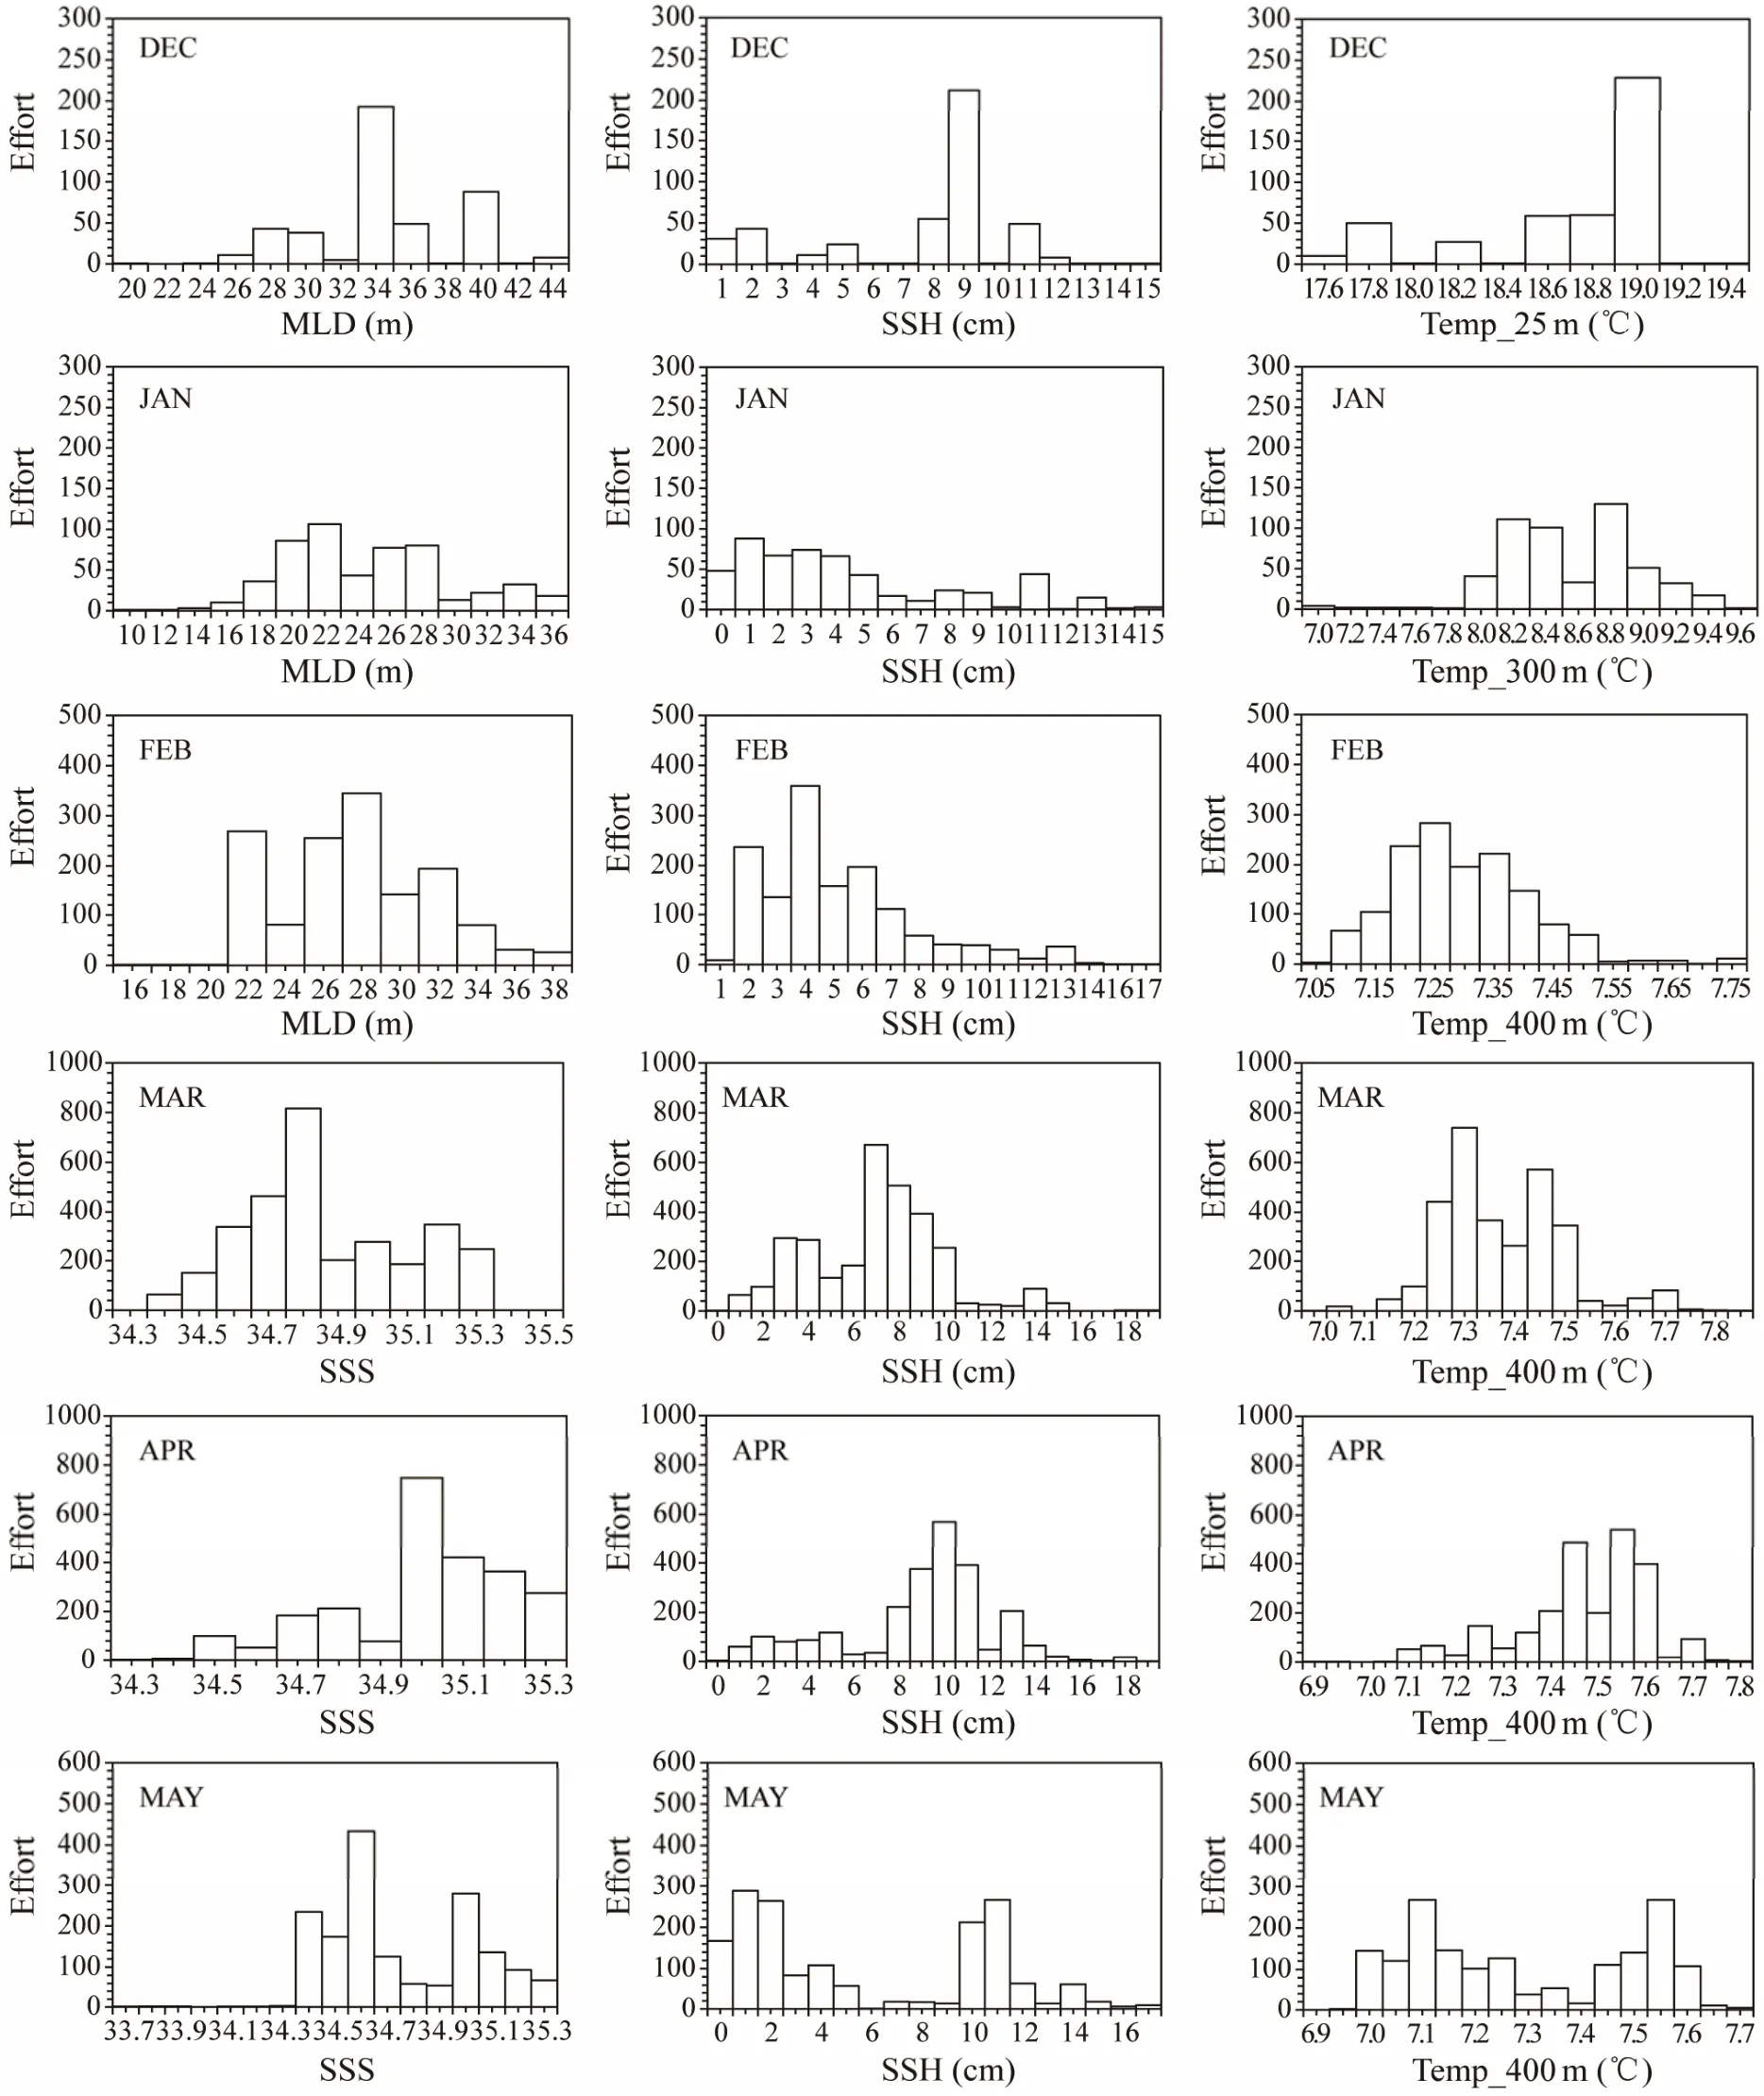
Fig.5 Frequency distribution of fishing effort of Dosidicus gigas in relation to key environmental factors from December to May in 2011 – 2017.
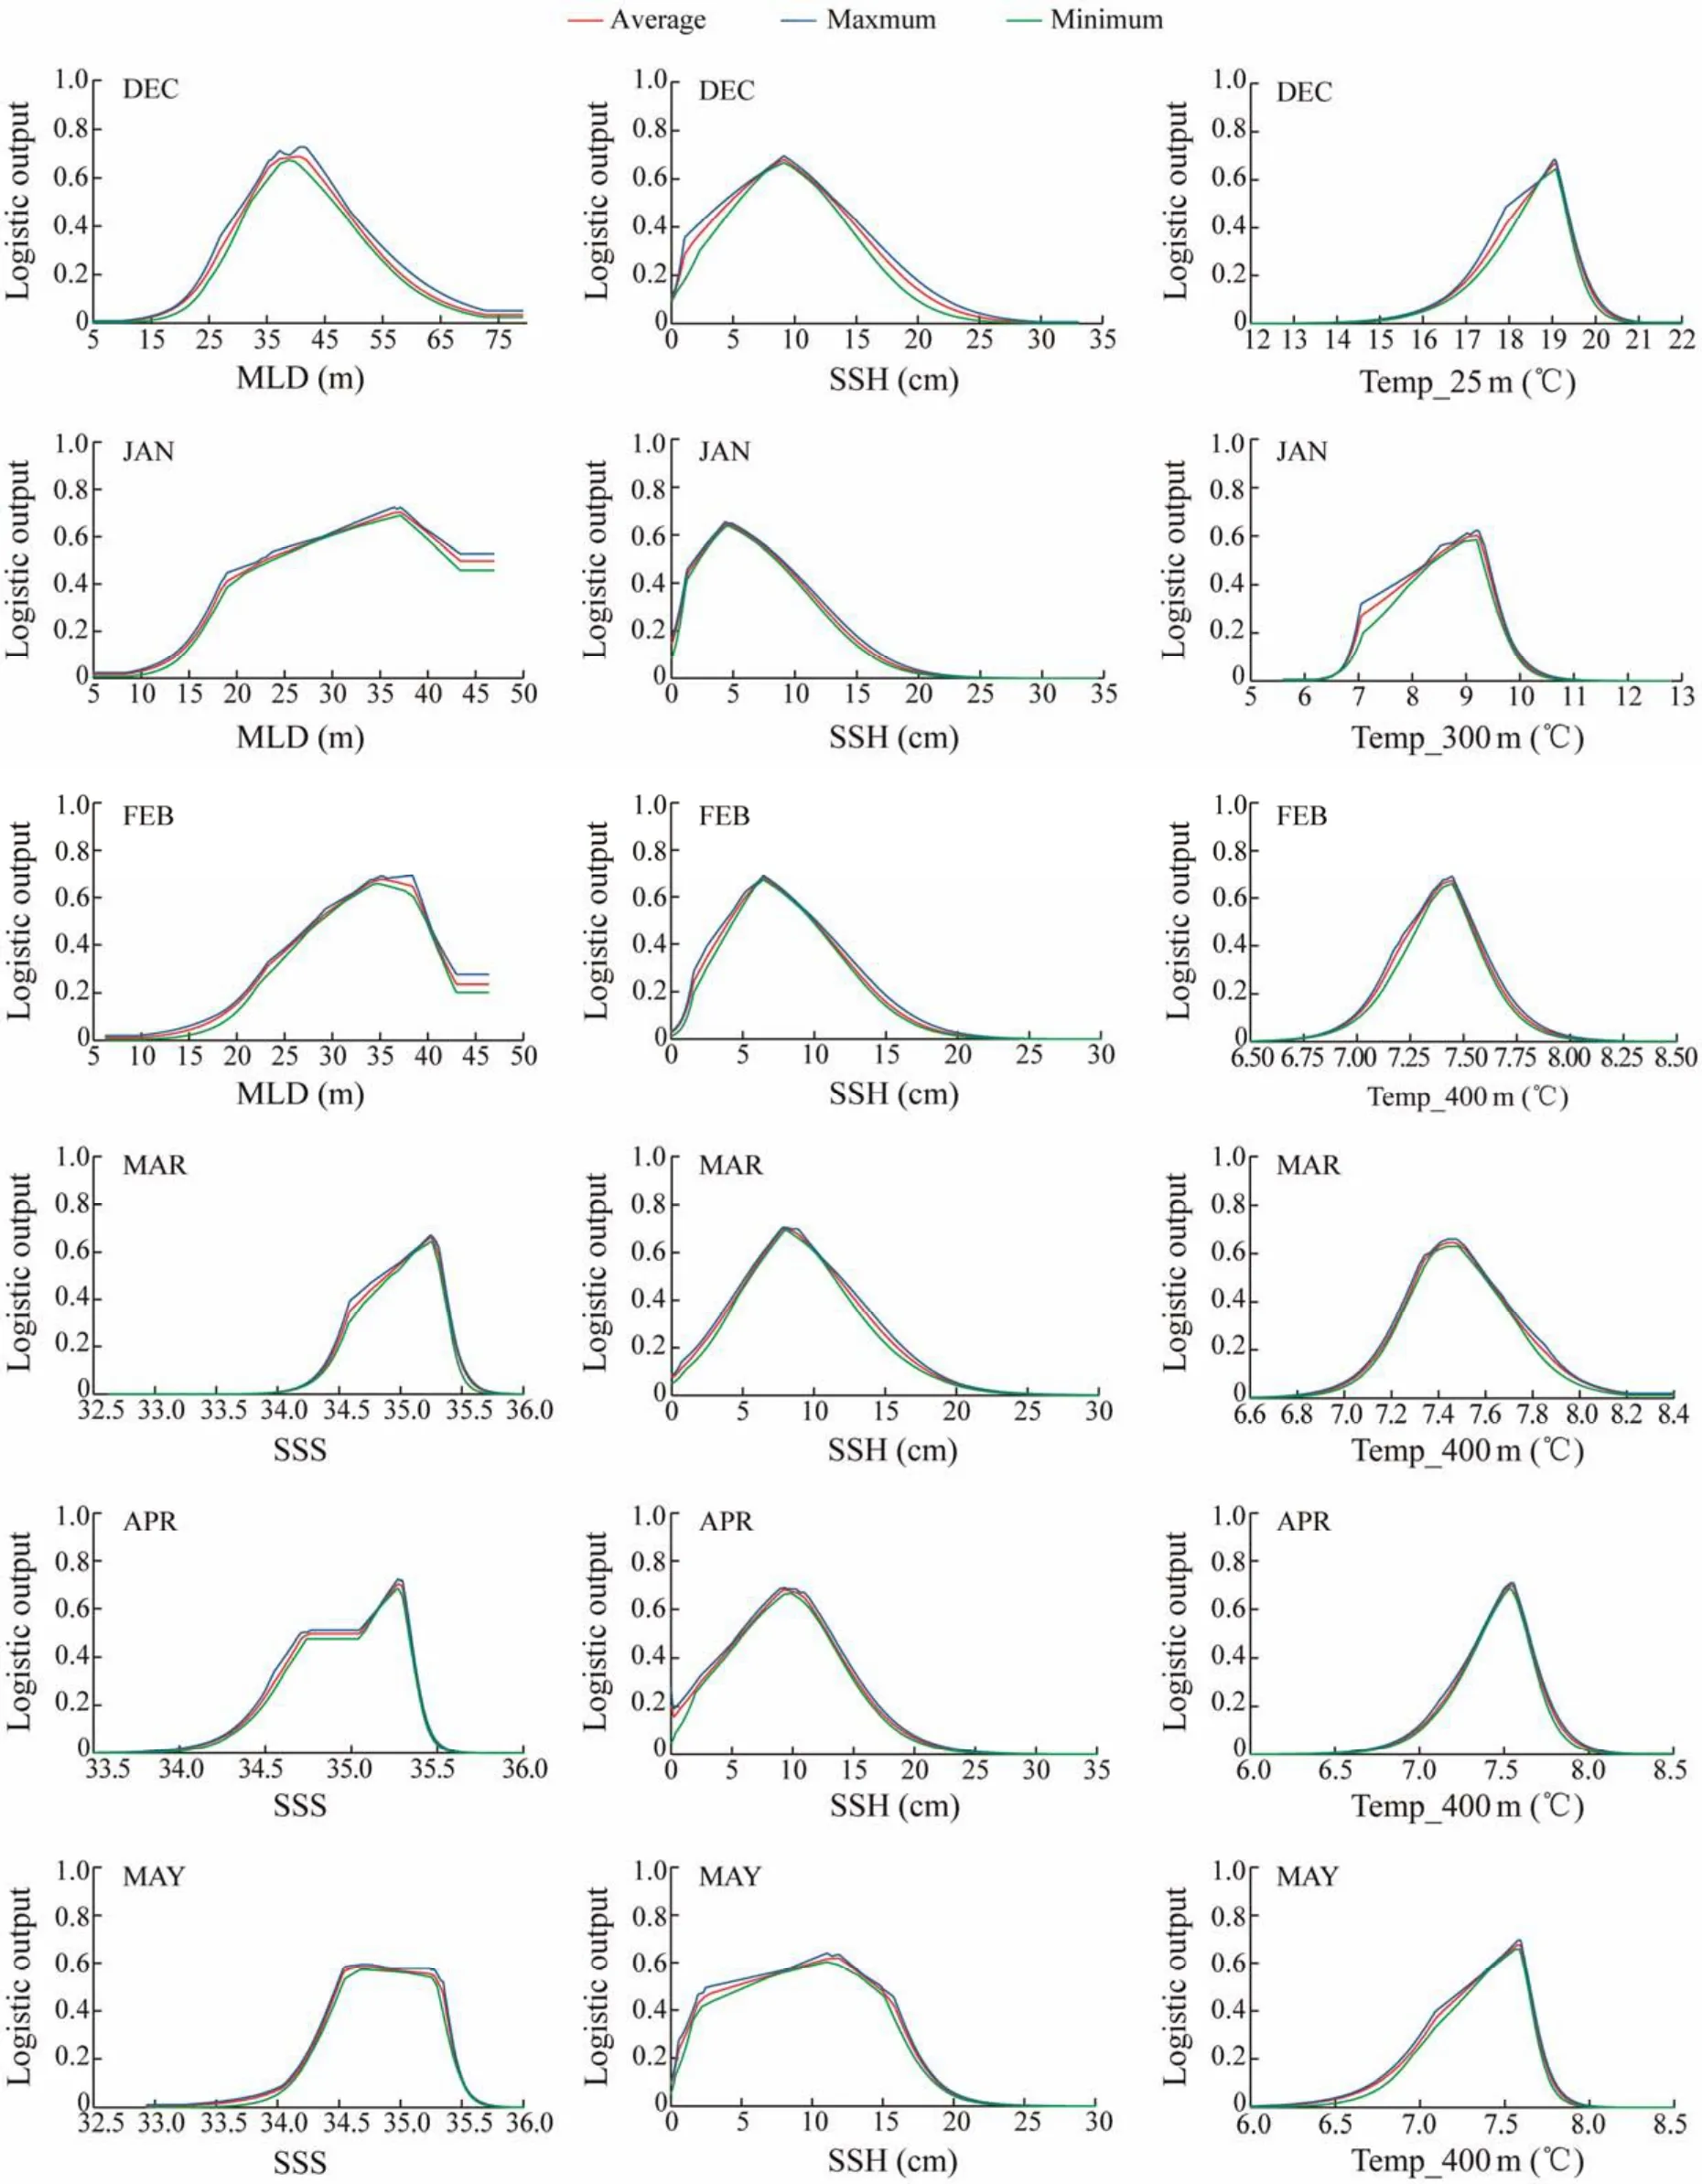
Fig.6 Response curves for the key environmental factors from December to May in 2011 – 2017 of all regional models.
4 Discussion
4.1 Results of Maximum Entropy Model and the Advantages
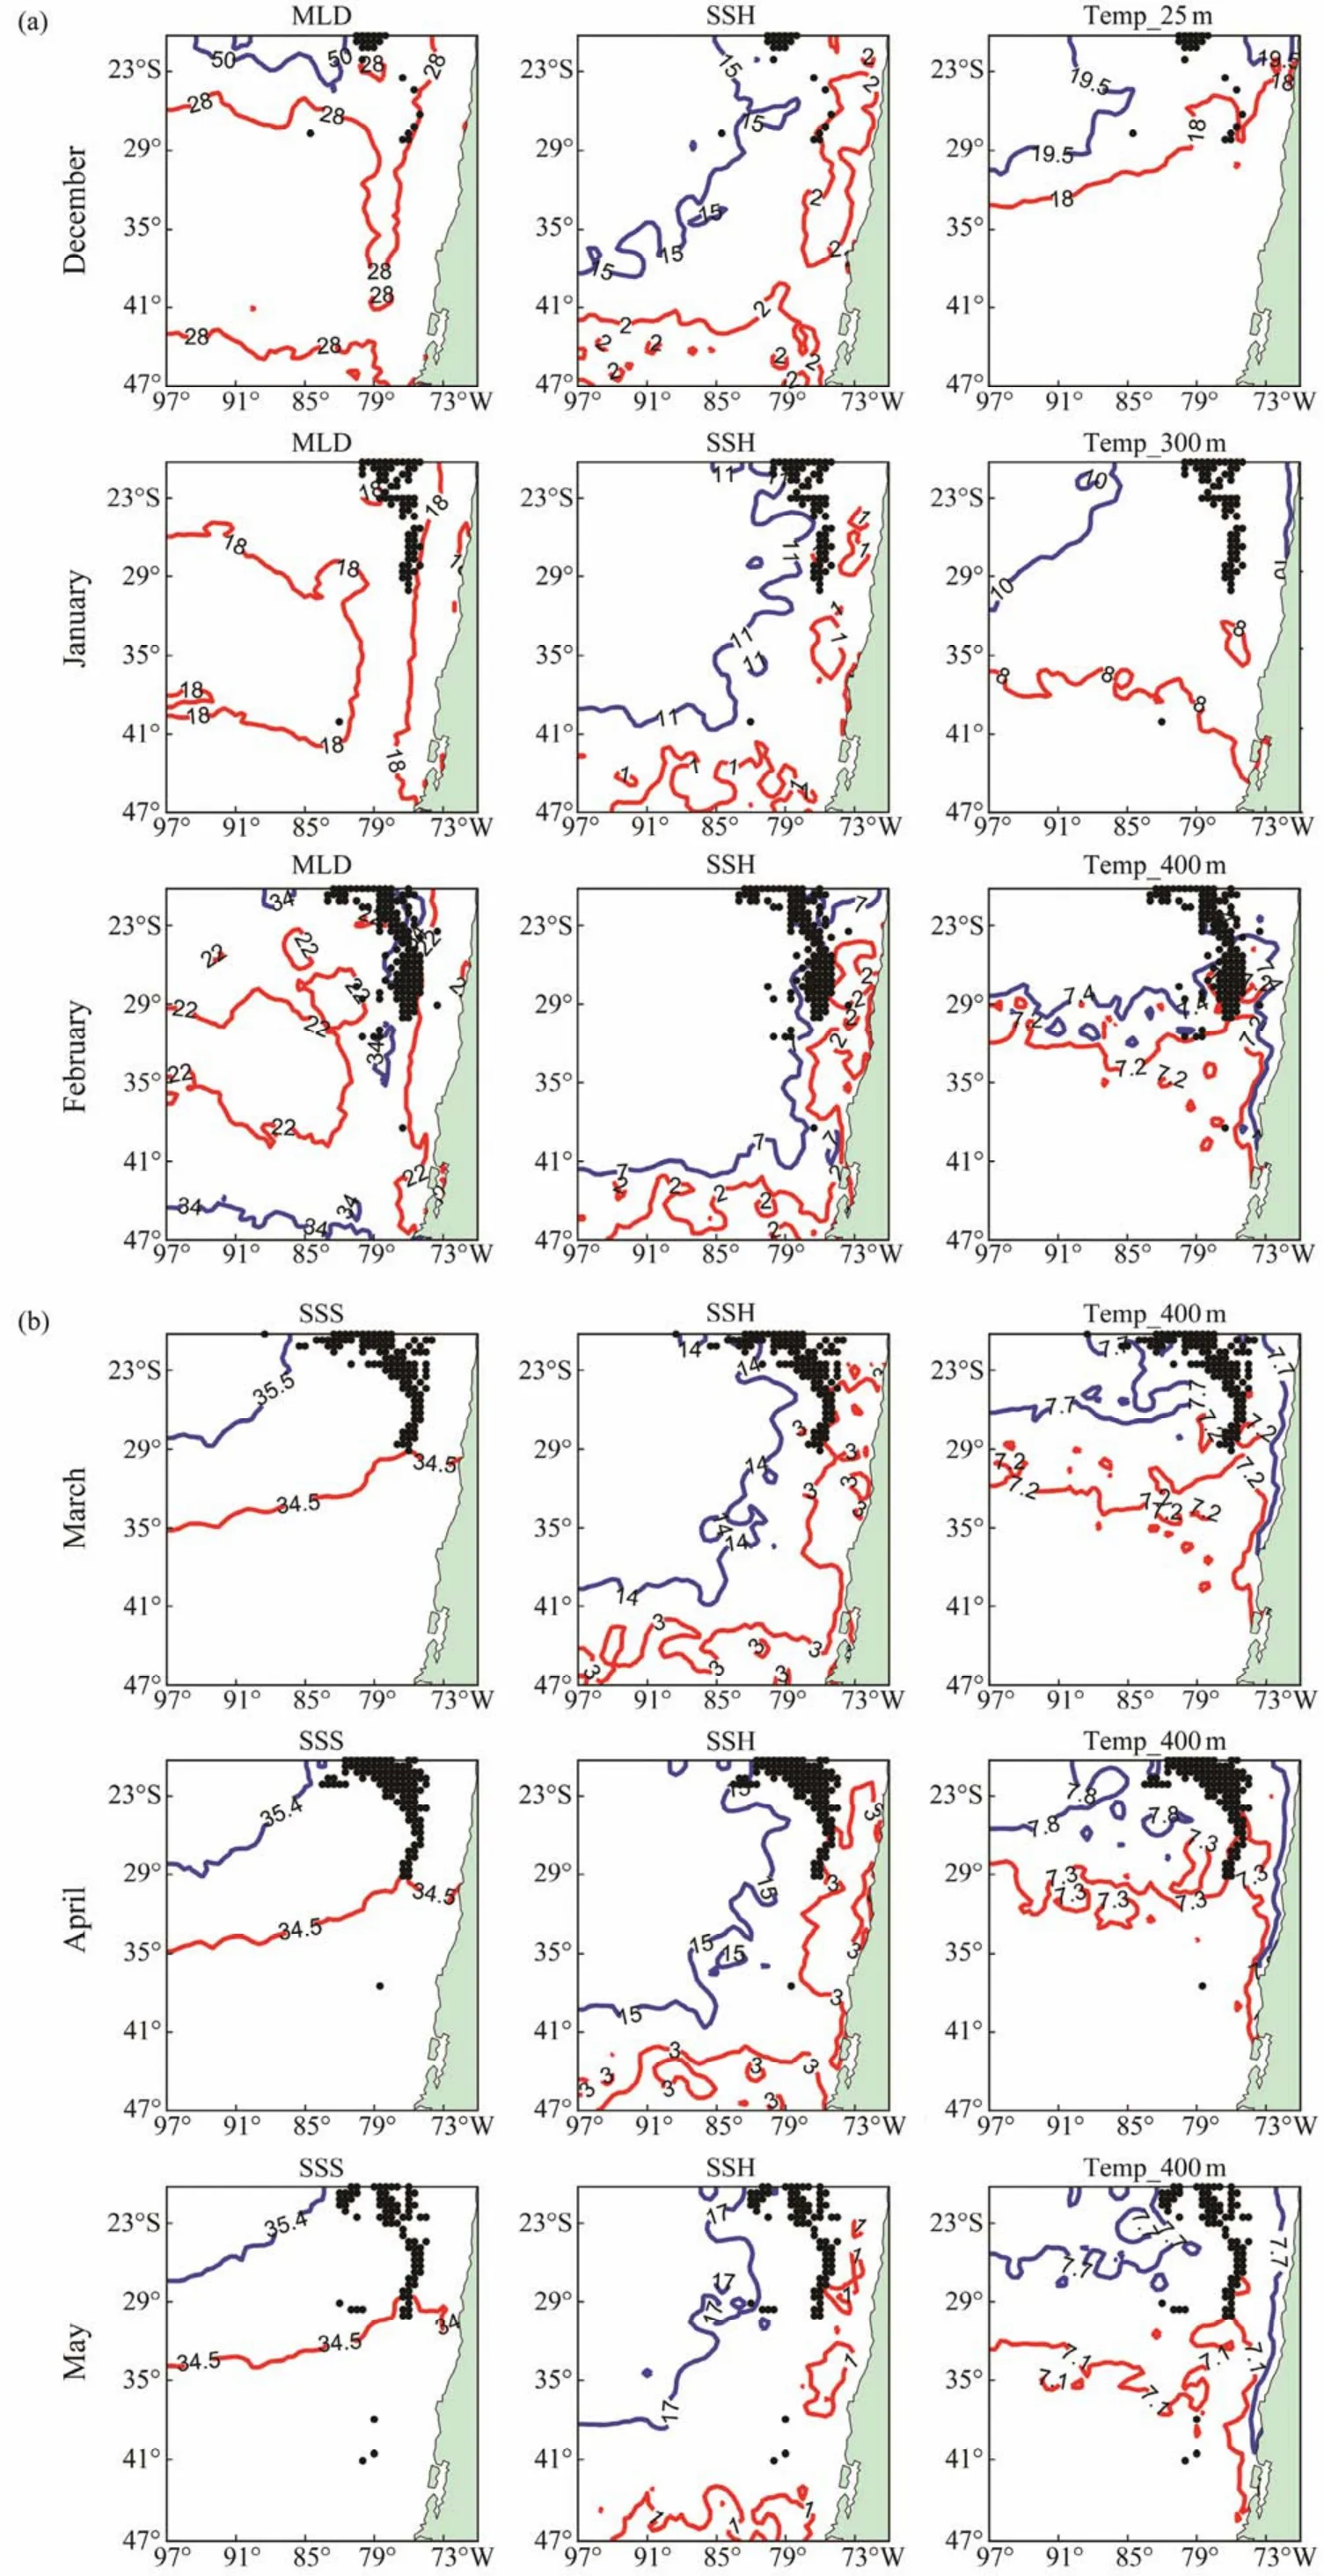
Fig.7 Suitable range of key environmental factors and overlay with actual fishing locations in summer (a)and autumn (b).
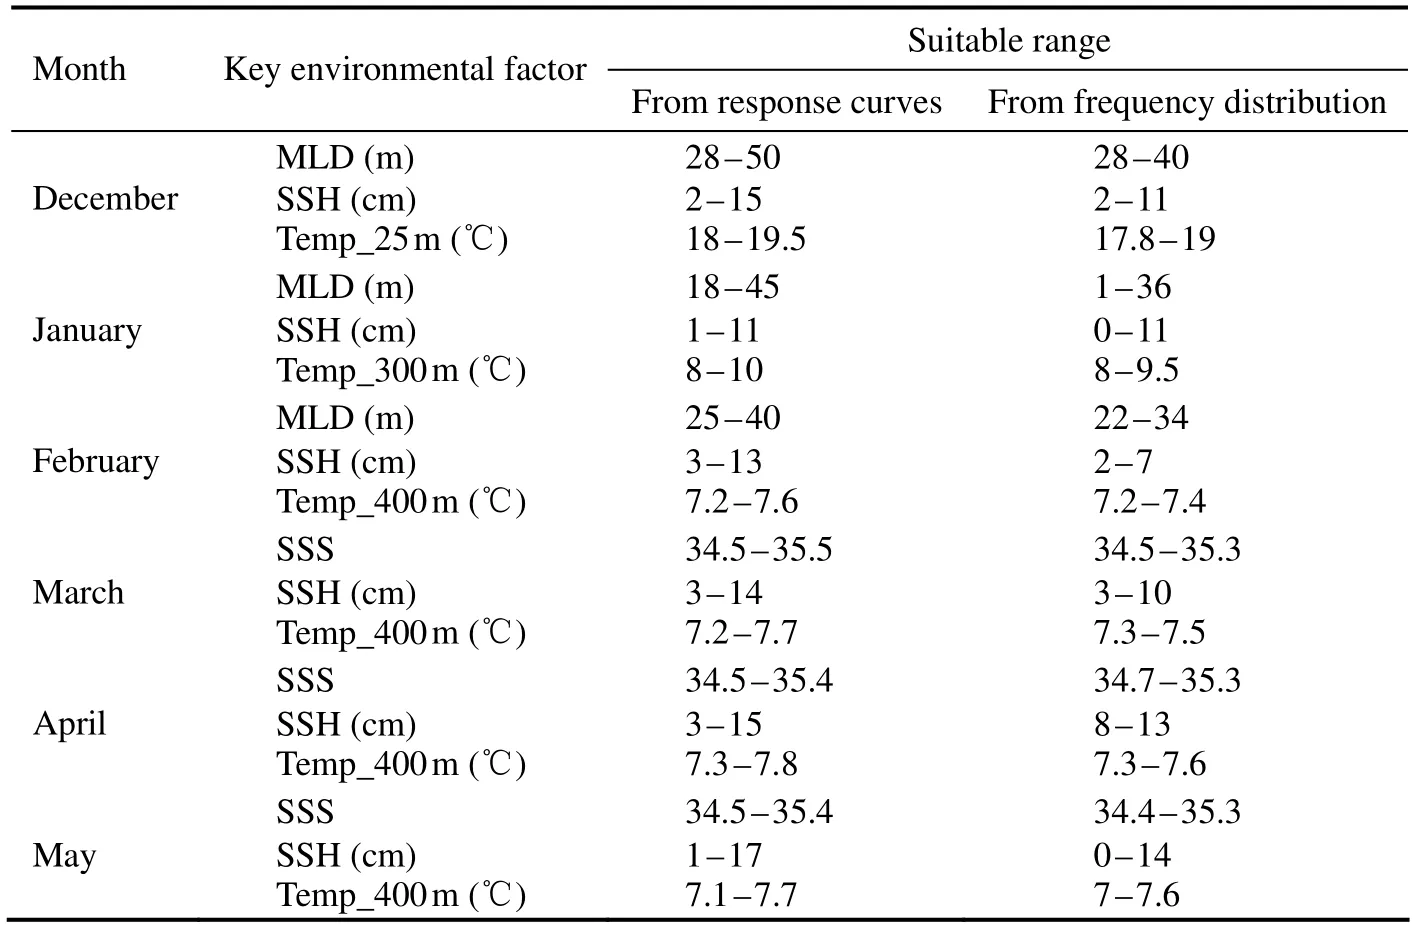
Table 3 Suitable range of key environmental factors for Dosidicus gigas off Chile from December to May based on two methods
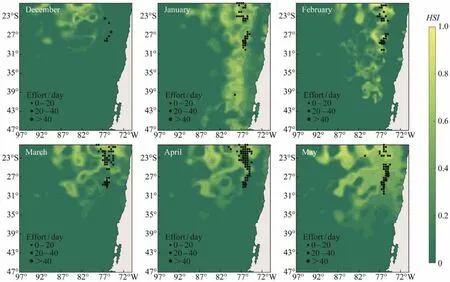
Fig.8 Spatial distribution of the predicted habitat suitability index of Dosidicus gigas off Chile overlapped with its actual fishing locations from December to May in 2011.
The potential habitat hotspots of D. gigas off Chile in the Southeast Pacific Ocean were explored and identified by combining available environmental variables and fisheries information as inputs to the MaxEnt models. Monthly Max-Ent model showed the potential distribution of D. gigas were basically consistent with the change trend of actual fishing location (Fig.2). AUCs higher than 0.9 for regional base models in each month showed minimal variability in statistical performance in modeling domain and the favorable consistence between the MaxEnt models and testing data(Table 1). There were many other models to identify the potential distribution of marine species such as habitat suitability index model (HSI)(Chen et al., 2010; Yu et al.,2019), BP (Back Propagation)neural network model (Wang et al., 2014), generalized linear model (GLM)and generalized additive model (GAM)(Venablse et al., 2004; Chang et al., 2011). Although these models had good analysis capability and reliable results, their application often required accumulated data that should be collected from the actual fisheries logbook with large sampling size for many years.Thus, there are many constraints to the data, especially for the time and distribution range of these models. On the contrary, the MaxEnt model has huge advantages for limited samples and prevented over fitting of the results. It is only based on the occurrence data and environmental background data. It breaks the limit that requires a lot of fisheries statistical data in time and space. In addition, the MaxEnt model can use both continuous and categorical data with efficient deterministic algorithms. At the same time, it does not need to require or even incorporate absence points within the theoretical framework (Phillips et al., 2008; Sharma et al., 2018).
The impacts of environmental factors on marine species varied over time. For example, Yu et al. (2019)used the arithmetic mean method-based HSI model to evaluate the correlation between the D. gigas habitats and marine environmental factors off Peru. The D. gigas habitat varied seasonally and the most critical environmental factors affecting this species distribution was different in each season. Many studies on the spatial-temporal distribution of D.gigas fishing grounds were based on two or three environmental factors that artificially selected exclusive the consideration of various impacts from biotic and the abiotic factors (Feng et al., 2020b; Wen et al., 2020). In this study,the differences and contribution rates of 12 different environmental variables to the distribution of D. gigas fishery were fully considered in summer and autumn. With the MaxEnt model effectively dealing with the complex interactions among environmental variables, the response rules of D. gigas habitat to different environmental factors were explored. Based on the contribution rate, the factors with little influences on D. gigas were not included into the analysis, while the selected key environmental factors affecting the distribution of D. gigas fishing ground were used for modeling and predicting, and determined the preferred ranges. In the present study, the biological characteristics of D. gigas and its environmental sensitivity were fully considered, making the selection of environmental variables more reasonable, and enhancing the reliability of the prediction model.
4.2 Key Environmental Factors Affecting the Distribution of D. gigas
Marine environmental variables are the critical elements in regulating the distribution of pelagic species (Du et al.,2020). For example, shallow MLD can obtain stronger illumination and yield more plankton through physical and biological processes, creating better food conditions for swordfish (Chang et al., 2013). The influence of SSS on the distribution of T. murphyi was different for each month. In the peak fishing season, the surface salinity strongly affected spatial-temporal fishing ground of T. murphyi (Jin et al.,2012). SST directly influenced the growth process, preferred habitat and the response to the unsuitable sea temperature of D. gigas (Paulino et al., 2016). Although these sea surface environmental variables were considered as important environmental factors to identify habitat hotspots and explore fishing ground for pelagic fishes or cephalopods,however, many species were also affected by the vertical structure of water temperature due to their vertical movement (Li et al., 2016; Xu et al., 2016). For example, the habitat suitability index model based on the vertical structure of water temperature can well predict the potential fishing grounds of O. bartramii in the Northwest Pacific Ocean and bigeye tuna (Thunnus obesus)in the Indian Ocean (Song and Zhou, 2010; Chen et al., 2012). T. murphyi also inhabits different water layers at different seasons. In autumn,the depth of the water layer that T. murphyi distributes is relatively stable and changes greatly in winter (Zhang et al.,2000; Ruan et al., 2016). Because of feeding and reproductive behaviors and environmental conditions, D. gigas performs both vertical and horizontal migrations (Gilly et al.,2006). Vertical migrations can range from the surface to more than 500 m deep, while latitudinal migration is up to several hundred miles (Nigmatullin et al., 2001; Chavez et al., 2008). This study used water temperature at different layers (including 0 m, 25 m, 50 m, 100 m, 150 m, 200 m,300 m, 400 m and 500 m)except the SSH, SSS, and MLD,and then selected the relatively critical vertical water temperature at certain depths for each fishing month (Table 2).Based on our results, the critical vertical water temperature of each month can be considered as one of possible abiotic indicators affecting D. gigas habitat and was consistent with its biological characteristics. These findings were similar to the conclusions by Qian et al. (2008), in which the water layer of D. gigas inhabited was different in distinct regions and months.
In this study, the SSH was also a critical environmental factor and contributed the highest to the formation of D.gigas habitat in summer and autumn. This finding was similar to the finding by Arkhipkin et al. (2015)with a conclusion that the SSH was an essential factor in determining squid habitat. SSH was an indicator of seawater dynamics. It reflects the dynamic cumulative results of thermodynamics, land, ocean and atmosphere processes in the Max-Ent model, while it also can drive the local food concentration into different spatial patterns (Chen et al., 2010;Long et al., 2012; Li et al., 2016). The seasonal and interannual variations of the surface flow field are obvious in the Southeast Pacific (Montes et al., 2011). The surface currents in the northern part of Chile mainly include the Southern Equatorial Current and the Peruvian Current, and are also affected by the upwelling. Under the influences of sea surface wind field, the surface currents significantly varied monthly or seasonally (Lin et al., 2006). For example, in the Humboldt Current, Trade Winds, the upwelling-favorable wind for the Humboldt Current, is intensified during the austral winter, inducing vertical advection of cold, nutrientrich waters which support high levels of biological productivity (Strub et al., 2013). Variations of the Southern Equatorial current are mainly reflected in the seasonal variations of current velocity, while the circulation axis of Peru Current changes significantly in the low latitude (Lin et al.,2006). Climate variability at different scales also have significant effects on current. During the El Niño years, the circulation axis of the Southern Equatorial Current and Peru Current deflect, the current fields and the upwelling are weakened; during the La Niña years, the flow field is strengthened again and the upwelling is enhanced (Montes et al.,2011; Mogollón et al., 2017). Therefore, with more frequent current changes, the convergence and upwelling of sea water become obvious, and the influences of SSH on the potential distribution of D. gigas is more critical.
In addition to the impacts of SSH and vertical water temperature on D. gigas stock, the results indicated that MLD played an important role in summer, while SSS was critical in autumn. These phenomena may be related to the influences of current and sea surface wind field on the D.gigas habitats. Sea surface wind is one of the main reasons causing the current velocity variation, consequently resulted in fish stock dynamics (Pickett et al., 2006). For example, previous studies showed that the higher the wind speed,the higher the mortality rate of the juvenile fish of Engraulis mordax (Peterman et al., 1987). In summer, due to the slow sea surface wind speed, the velocity of the South Equatorial current was relatively slow, which was favorable for the accumulation of plankton, and promoted the increase of population richness through the food chain transmission and accumulation (Lin et al., 2006; Bakun et al., 2014). The monthly SSS and MLD off Chile were lower in summer than those in autumn (Fig.4). On the contrary, the shallow MLD indicated that the water temperature at certain depth where the species inhabits was relatively stable, and it also promoted the photosynthesis for phytoplankton, which was indirectly favorable for D. gigas concentration (Change et al., 2013; Bakun et al., 2015). Therefore, MLD rather than SSS was the key environmental factor affecting the distribution of D. gigas in summer. The situation was opposite in autumn (Fig.4). Furthermore, the significant intermonthly variations of key environmental factors and suitable living ranges may be caused by the variation of ocean current in different seasons. The southeast Pacific is a westerly drifting cold-water mass and the north is an inverse equatorial warm current warm-water mass (Feng et al.,2020a). Therefore, the Dosidicus gigas fishing ground was mainly affected by the intersection of cold and warm water masses in the south and north, which made SSH and MLD show the increasing trend as a whole. In summer and autumn, the northern warm-water mass was stronger than the southern cold-water mass, while the southern cold-water mass dominates in winter and spring. Therefore, in summer and autumn, the temperature and salinity of shallow seawater increase in summer and decrease in autumn, and the deeper water temperature is less affected by this, showing a downward trend as a whole (Niu et al., 2009).
4.3 Future Directions and the Forecast Results
With the rapid growth and high productivity, D. gigas belongs to ecologically important species and plays an important role in the worldwide marine fisheries (Yu et al.,2016). Exploring the habitat hotspots of D. gigas in the Southeast Pacific Ocean can provide scientific basis for expanding the spatial range of pelagic fishing grounds and looking for new economic growth points. Therefore, it is useful to use the species distribution model to predict its potential suitable habitats in the future. The MaxEnt model only needs the distribution data of species and the external environmental variables data. It can calculate the potential distribution probability of species under five different constraint characteristics including linear, product, hinge, quadratic and threshold, which can unbiasedly infer the unknown distribution of species from the limited longitude and latitude distribution information(Li et al., 2019).
In this study, although the MaxEnt model can predict the potential habitat of D. gigas, there are still some biases in the prediction results due to the strong migration characteristics of the D. gigas. Therefore, in the future research,we will avoid the sampling limit to improve the feasibility of MaxEnt model in fisheries application. Furthermore, climate-induced marine environmental changes and habitat variations may have significant influences on the fisheries(Kuczynski et al., 2018). For example, the high-frequency El Niño and La Niña events indirectly led to a large fluctuation in the abundance of the O. bartramii population by affecting the environmental conditions on the spawning and feeding grounds of O. bartramii (Alabia et al., 2015; Igarashi et al., 2017). Therefore, in the future research, the climate variability with different time-scale and intensity should be combined with key environmental factors to develop the species distribution model to accurately assess the relationship between the habitat pattern of marine pelagic species and biotic and abiotic factors.
Acknowledgements
This study was financially supported by the National Key R&D Program of China (No. 2019YFD0901405), the National Natural Science Foundation of China (Nos. 419 06073, 31900333), and the Natural Science Foundation of Shanghai (No. 19ZR1423000).
杂志排行
Journal of Ocean University of China的其它文章
- Comparison of Flavor Substances in Dried Shrimp Products Processed by Litopenaeus Vannamei from Two Aquaculture Patterns
- Allelopathic Interactions Between the Tropical Macrophyte Enhalus acoroides and Epibenthic HAB Dinoflagellate Prorocentrum concavum
- Removal of Arsenic from Chlamys farreri with Different Methods
- Optimal Culture Capacity of White Shrimp (Litopenaeus vannamei)and Razor Clam (Sinonovacula constricta)in a New Series-Connection Culture Model
- Identification of Non-Coding RNAs Based on Alignment-Free Features in Crassostrea gigas (Pacific Oyster)Transcriptome
- Complete Mitochondrial Genome Analysis of Daphniopsis tibetana (Branchiopoda: Diplostraca): New Insights into the Taxonomy of the Genus and Its Phylogenetic Implications for Branchiopoda
