Optimal Culture Capacity of White Shrimp (Litopenaeus vannamei)and Razor Clam (Sinonovacula constricta)in a New Series-Connection Culture Model
2022-12-27HUJiabaoZHAOChunpuBAOGegeLUOYunhuiWANGDanliXUJilinandXUShanliang
HU Jiabao, ZHAO Chunpu, BAO Gege, LUO Yunhui, WANG Danli, XU Jilin,and XU Shanliang
School of Marine Sciences, Ningbo University, Ningbo 315211, China
Abstract To construct an effective circular mix-culture model and investigate its culture capacity, we established one small and one large systems, with white shrimp (Litopenaeus vannamei) and razor clam (Sinonovacula constricta) cultured in separate ponds.The culture water from the L. vannamei was pumped to the S. constricta, and the culture water from the S. constricta overflowed back into the L. vannamei via gravity. In trial I, we tested four culture densities (groups 1 – 4), and monitored water quality, growth indices, and digestive and immune enzyme activities. From the results, the nitrogen and phosphorus levels generally increased then declined after 56 days, and were lower in groups 1 and 2. The specific growth rate of group 2 was the highest. After 56 days, activities of four digestive enzymes were increased in group 2, and lysozyme activity was significantly decreased in S. constricta in groups 1 – 4;Alkaline phosphatase activity of L. vannamei was increased in group 3, but decreased in S. constricta in groups 2 – 4; Acid phosphatase activity was significantly higher in groups 1 – 3 (P < 0.05), while SOD and CAT activities were significantly elevated in group 2 (P <0.05). Thus, we applied group 2 density for trial II. In trial II, nitrogen and phosphorus concentrations declined significantly during the latter stages, and growth indices were higher than the control (P < 0.05). The yields of L. vannamei and S. constricta were significantly higher than the control (P < 0.05). The results revealed a good circular mix-culture system with the optimal culture capacity for L. vannamei (40 ind m-2)and S. constricta (300 ind m-2), which provided a reference for the future culture of them.
Key words Litopenaeus vannamei; Sinonovacula constricta; culture capacity; series connection culture model; water quality
1 Introduction
White shrimp (Litopenaeus vannamei)has desirable characteristics including fast growth, strong disease resistance,convenient transportation, a large suitable culture area, and a high yield (Rodríguezet al., 2007). Similarly, razor clam(Sinonovacula constricta)benefits from fast growth and high economic value, and is cultivated widely in coastal areas of China (Liu, 2014). Nutrients transformed from artificial feeding residues andL. vannameifaeces in shrimp culture ponds can be fully utilized by phytoplankton, which helps to accelerate phytoplankton growth. In turn,S. constrictacan feed on phytoplankton, organic debris, dissolved organic matter and bacteria in water from shrimp ponds,hence mix-culture of shrimp and shellfishis very popular in China.
For traditional mix-culture models, culture capacity is an important factor, which can decline with disease, and further affect yields (Donget al., 1998). If the density of shrimps is too high, this can result in a significant increase in uneaten feed remnants and faeces, which decreases the water quality. If the density of shellfish is too high, there may be a significant decline in phytoplankton, which may decrease the growth and health of shrimps (Kaiet al., 2015;Zhaoet al., 2018). In addition, in the case of long-term overcast weather and rain, shellfish may consume most of the phytoplankton, and these microorganisms can struggle to recover when it is sunny again. To solve these problems,some new culture-independent models have been developed to maintain the amount of phytoplankton and the quality of the water, and thereby avoid disease outbreaks (Huang,2001; Liu, 2014). However, effective circular mix-culture models and optimal culture capacities have not been reported.
To construct an effective circular mix-culture model and investigate its culture capacity, we developed a small culture system with a series of connection including four different culture densities ofL. vannameiandS. constricta, and monitored the water quality (nitrogen and phosphorus concentrations), growth indices, and digestive and lipid-soluble antioxidant system (LSAS)enzymes activities. Based on these indices, we identified the optimal culture density,and then established a larger system using the optimal culture density, and monitored water quality, growth indices and yields. The results revealed good growth indices and yields with the optimal culture capacity, providing a reference for future mix-culture models of shrimp and shellfish.
2 Materials and Methods
2.1 Culture Density Selection for the Circular Mix-Culture Model (Trial I)
L. vannameiandS. constrictawere reared in Ningbo, China. All experiments were conducted in accordance with the recommendations of the National Institutes of Health Guide for the Care and Use of Laboratory Animals. The Animal Care and Use Committee of Ningbo University approved the protocols.
We first constructed a small culture system with a series of connection.L. vannameiandS. constrictawere cultured in two independent small plastic tanks (total volume = 10 t,base area = 10 m2; Fig.1)containing 9 tons of filtered seawater in each tank (23℃ ± 1℃, pH 7.89 ± 0.23, dissolved oxygen 6.67 mg L-1± 0.33 mg L-1).S. constrictawere cultured at the bottom of a substrate sludge tank (about 10 cm height, base area 2.5 m2)which was sunk in the small plastic tank. The water from theL. vannameitank was delivered to theS. constrictatank by a pump (power 100 W), and the water in theS. constrictatank overflowed back into theL. vannameitank through a central tube, forming a series of connection between the two independent tanks. There was an air-stone in each tank to supply oxygen, and the water in theS. constrictatank was exchanged completely with water from theL. vannameitank once a day. We tested four culture densities in the experimental groups (Table 1), and each group included three parallel replicates. The four groups were cultured for 8 weeks (total 56 days).L. vannameiwere fed commercial feed (Yuehai, Guangdong, China), and the total amount of feed provided was about 6% of shrimp body weight per day.S. constrictain each tankwere fed 2 L of inspissatedChlorella aeruginosainwater(bacterial cell density(8 – 10)× 1010ind mL-1)twice a day.
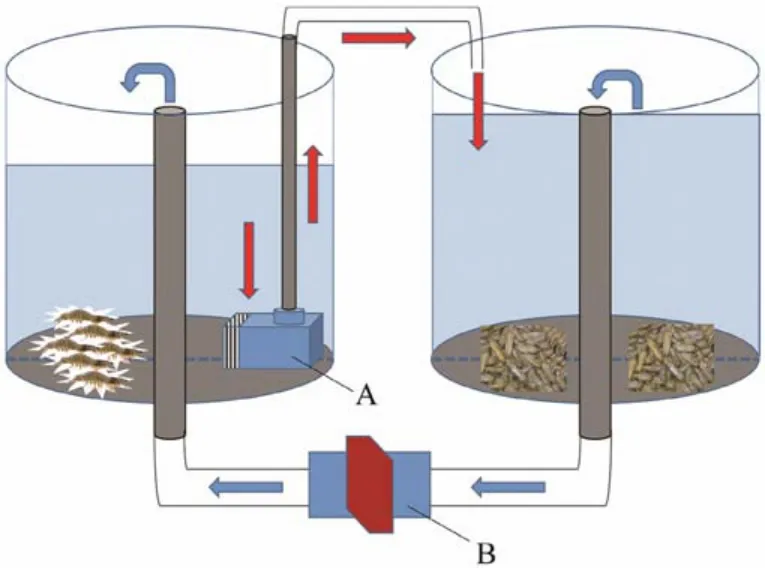
Fig.1 Small culture system with a series of connection for L. vannamei and S. constricta. A, pump (power = 100 W);B, valve controlling water flow between the two tanks. The red arrow represents water flow from L. vannamei to S. constricta. The blue arrow represents water flow from S. constricta back to L. vannamei.

Table 1 Culture density of the four experimental groups
2.2 Analysis of Water Quality, Growth Indices, and Digestive and Immune Enzymes Activities for L. vannamei and S. constricta in Trial I
Water quality factors (total nitrogen, total phosphorus, ammonium nitrogen, nitrate nitrogen, nitrite nitrogen and active phosphorus)were determined every week according to the marine monitoring standard (GB 12763.4-2007).
For growth indices, we recorded the initial/final weight(IW/FW), and calculated the specific growth rate per day(%)based on the formula:

Four digestive and five LSAS enzymes’ activitieswere measured on the first and final days of trial I using commercial assay kits (Jiancheng Biotechnology Research Institute, Nanjing, China)according to the manufacturer’s instructions. The four digestive enzymes were trypsin, pepsin,lipase and amylase; the five LSAS enzymes were lysozyme,alkaline phosphatase, acid phosphatase, catalase (CAT)and superoxide dismutase (SOD).
2.3 Construction of the Culture Model with a Series of Connection Using Large Culture Ponds (Trial II)
We constructed a similar model using large culture ponds(Fig.2). The effective culturing area of theL. vannameipond was about 12000 m2with nanotube oxygenation, and the effective culturing area of theS. constrictapond was about 3000 m2with a water wheel aerator. The depth of culturing water (23℃ ± 6℃, pH 8.26 ± 1.24, dissolved oxygen 7.24 mg L-1± 1.33 mg L-1)was about 1.5 m in theL. vannameipond and about 0.5 m in theS. constrictapond (earthen bottom). The water in theS. constrictapond was exchanged completely with water fromL. vannameionce a day. Based on the results from trial I, we selected the optimal culture density for trial II (averaged from three replicates). Two periods forL. vannamei(about 2 months for both)and one period forS. constrictawere tested in the model from June to November (about 4 months). In addition,we included a control involvingL. vannameiandS. constrictaculturedtogetherin the same pond (about 12000 m2)with the same cell density as that in the model system(trial II).

Fig.2 Culture model with a series of connection for culturing L. vannamei and S. constricta in large ponds. A, pump(power = 1000 W); B, valve controlling water flow between the two ponds. The red arrow represents water flow from L. vannamei to S. constricta. The blue arrow represents water flow from pond with S. constricta back to pond with L.vannamei.
2.4 Water Quality, Growth Indices, and Yields for L. vannamei and S. constricta in Trial II
In trial II of control and experimental groups, water quality factors were determined every 10 days for about 4 months, and initial/final growth indiceswere calculated as above. The yield was recorded for all cultures and periods.
2.5 Statistical Analysis
Statistical analysis was performed using one-way analysis of variance (ANOVA)and Tukey’s multiple comparison test(SPSS, version 16.0). The difference was considered significant whenP< 0.05.
3 Results
3.1 Culture Density Selection Based on Water Quality, Growth Indices and Enzyme Activities from Trial I
During the 56 days of trial I, we monitored six water quality factors for bothL. vannamei and S. constrictaculture ponds (Fig.3). Nitrite nitrogen increased in the first 2 weeks,then decreased thereafter. The levels in groups 3 and 4 were much higher than those in groups 1 and 2; however, in the last 2 weeks it was similar in all four groups. Ammonium nitrogen increased in the first week then decreased thereafter. The levels in groups 3 and 4 were much higher than those in groups 1 and 2 in the first 3 weeks; however, in the last 2 weeks it was similar in all four groups. Nitrate nitrogen was increased in the first, fifth and eighth weeks. The level in group 4 was higher than those in the other groups,while it was similar in all four groups in the first 4 weeks.Total nitrogen was increased after 6 weeks then decreased in the last 2 weeks. Active phosphorus was increased in the first 2 weeks then decreased thereafter. The levels in groups 3 and 4 were higher than those in groups 1 and 2 in the first 3 weeks, but after 3 weeks it was similar in all four groups.Total phosphorus was increased after 5 weeks then remained relatively stable thereafter. The levels in groups 3 and 4 were higher than those in groups 1 and 2 after the fifth week,but it was similar in all four groups during the first 4 weeks.
In group 1, the weights ofL. vannameiandS. constrictaincreased from 4.28 g ± 0.20 g to 12.24 g ± 0.64 g and 7.77 g± 0.12 g to 10.56 g ± 0.67 g, respectively. In group 2, the weights ofL. vannameiandS. constrictaincreased from 4.32 g ± 0.15 g to 12.90 g ± 0.97 g and 7.76 g ± 0.04 g to 13.28 g ± 1.75 g, respectively. In group 3, the weight ofL.vannameiandS. constrictaincreased from 4.35 g ± 0.19 g to 11.5 g ± 0.45 g and 7.81 g ± 0.14 g to 11.85 g ± 0.52 g, respectively. In group 4, the weights ofL. vannameiandS.constrictaincreased from 4.27 g ± 0.16 g to 10.08 g ± 0.26 g and 7.91 g ± 0.13 g to 10.59 g ± 0.59 g, respectively. The specific growth rate per daywas the highest in group 2 among the four groups with different culture densities (Fig.4).
Analyses of digestive enzymes’ activities (Fig.5)showed that trypsin activity inL. vannameiwas significantly increased in L1 and L2, whereas trypsin activity inS. constrictawas significantly decreased in S3/S4. Pepsin activity inL. vannameiwas significantly increased in L1, L2 and L3, and pepsin activity inS. constrictawas significantly increased in S1 and S2. Lipase activity inL. vannameiwas significantly decreased in L3 and L4, and lipase activity inS. constrictawas significantly increased in S2. Amylase activity inL. vannameiwas significantly increased in L1 and L2. Amylase activity inS. constrictawas significantly decreased in S3 and S4. Overall, digestive enzymes in L1 and L2 were more active during the 56 days in trial I.
Analysis of immune enzymes (Fig.6)showed that lysozyme activity inL. vannameiwas not significantly different, but lysozyme activity inS. constrictawas significantly decreased in S1 – 4. Alkaline phosphatase inL. vannameiwas significantly increased in L3, while alkaline phosphatase inS. constrictawas significantly decreased in S4.Acid phosphatase activity inL. vannameiwas significantly increased in L2 – 4, while acid phosphatase activity inS.constrictawas significantly decreased in S2 – 4. SOD activity inL. vannameiwas significantly increased in L2, while SOD activity inS. constrictawas significantly decreased in S2. CAT activity inL. vannameiwas significantly increased in L2, and CAT activity inS. constrictawas significantly increased in S1 and S2.
Based on the water quality measurements, growth indices, and enzyme activities, the culture density of group 2 was selected for trial II.
3.2 Water Quality, Growth Indices and Yields for L. vannamei and S. constricta in Trial II
We set the culture density ofL. vannamei and S. constrictain trial II based on group 2 of trial I. During the 120 days of trial II, we monitored six water quality factors in control and trial II groups inL. vannameiandS. constrictaponds (Fig.7). In controls, nitrite nitrogen was increased during the first 20 days then decreased hereafter. In the trial II group, it was raised during the first 2 months then decreased thereafter, but similar inL. vannameiandS. constrictaduring the last 40 days. Nitrite nitrogen was much higher in controls than in the trial II group after 60 days.In controls, nitrate nitrogen was elevated during the first 60 days then decreased thereafter. In the trial II group, it was raised during the first 50 days then decreased thereafter,and it was similar inL. vannameiandS. constrictaduring the last 20 days. Nitrate nitrogen was much higher in controls than in the trial II group after 60 days. In controls, ammonium nitrogen was increased during the first 40 days then decreased thereafter. In the trial II group, it was raised during the first 50 days then decreased thereafter. In the last 20 days, it was similar inL. vannameiandS. constricta. Ammonium nitrogen was much higher in controls than in the trial II group after 10 days. In controls, total nitrogen was elevated during the first 50 days then diminished thereafter. In the trial II group, it was raised during the first 50 days, then decreased in subsequent days. In last 40 days,it was similar inL. vannameiandS. constricta. Total nitrogen was much higher in controls than in the trial II group after 20 days. In controls, active phosphorus was raised during the first 10 days then decreased thereafter. In the trial II group, it was raised during the first 50 days then decreased thereafter. In the last 40 days it was similar inL. vannameiandS. constricta. Total nitrogen was much higher in controls than in the trial II group after 70 days. In controls, total phosphorus was elevated during the first 20 days then decreased in subsequent days. In the trial II group, it was raised during the first 40 days then decreased thereafter. In the last month it was similar inL. vannameiandS. constricta. Total phosphorus was higher in controls than the trial II group throughout the experiment.
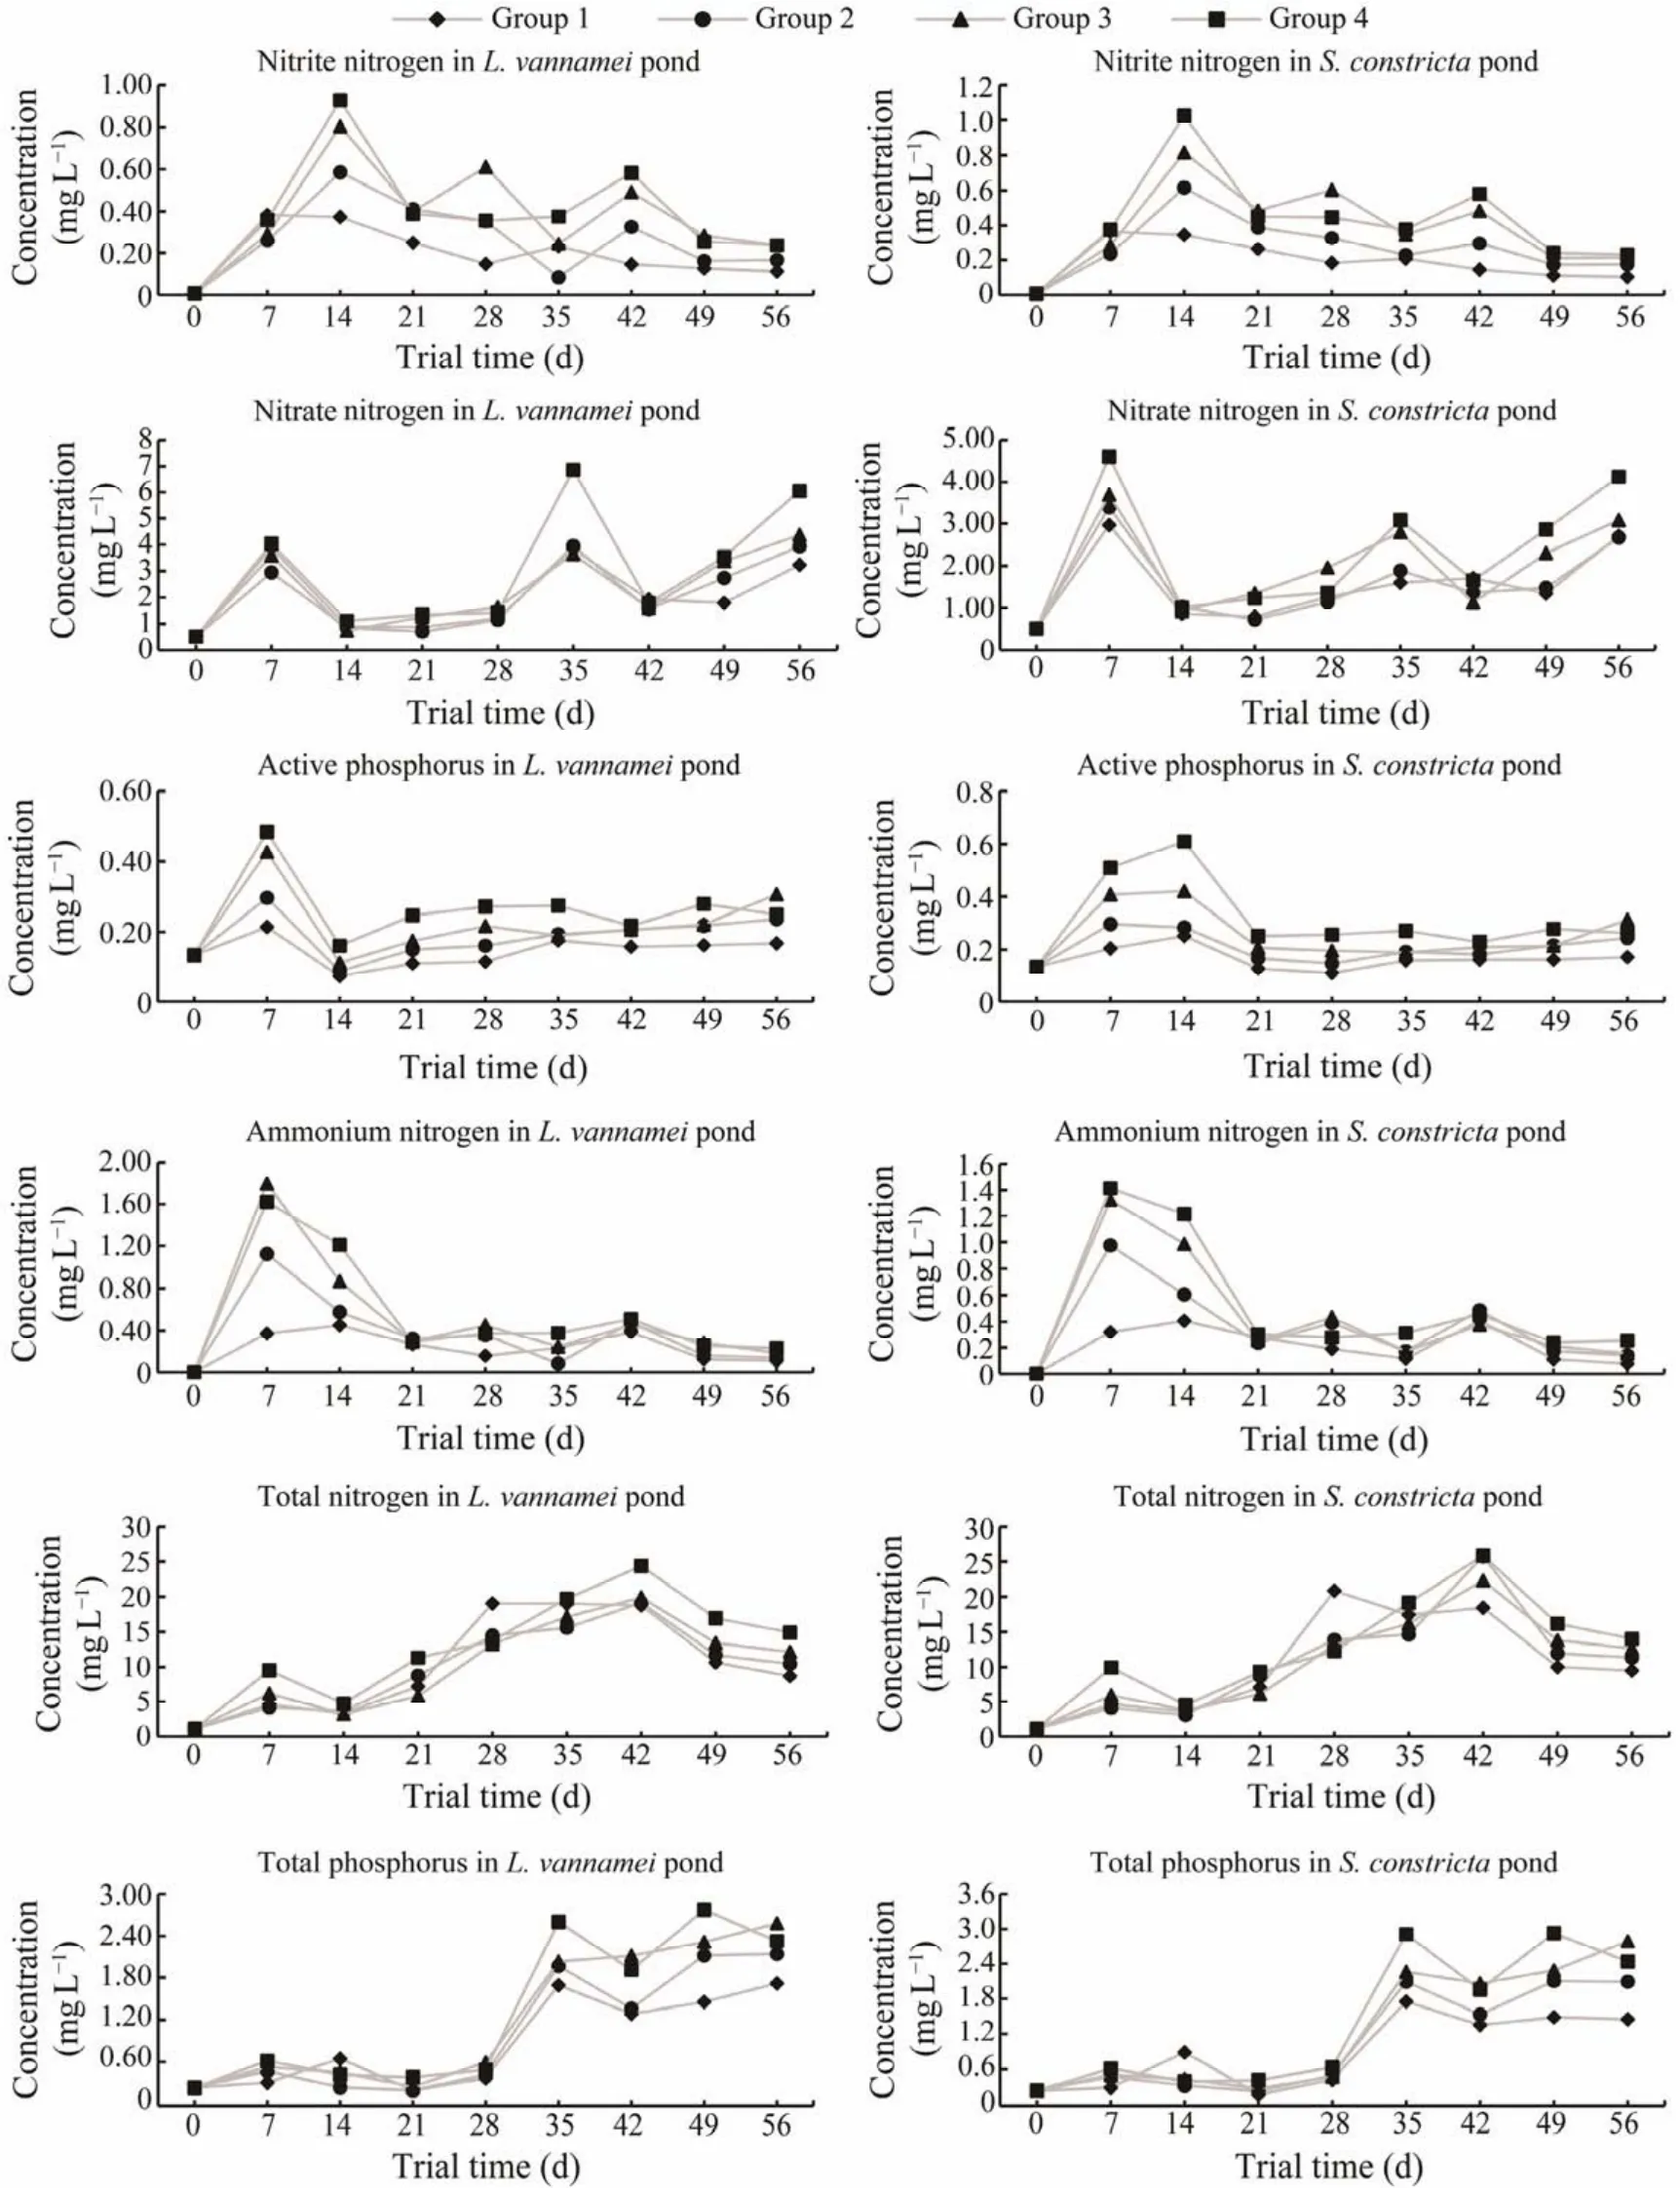
Fig.3 Changes of water quality factors in ponds with L. vannamei and S. constricta. The x-axis represents the days of the trial, and the y-axis represents the levels of water quality factors (mg L-1).

Fig.4 Specific growth rate per day for L. vannamei and S. constricta in the four groups. The y-axis is the specific growth rate (%)per day (P < 0.05).
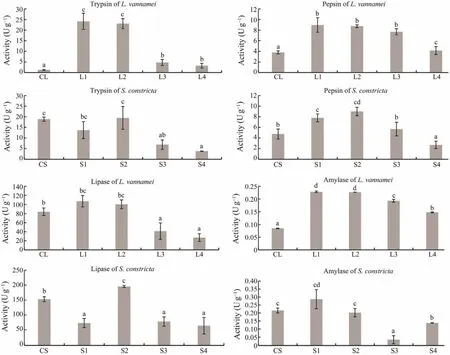
Fig.5 Changes in the activities of digestive enzymes in L. vannamei and S. constricta. CL, initial L. vannamei values; L1 – 4,final L. vannamei values for groups 1 – 4; CS, initial S. constricta values; S1 – 4, final values for S. constricta in groups 1 – 4(P < 0.05).
For controls, the specific growth rate per day during the first period forL. vannameiwas 7.01% (0.19 g ± 0.01 g to 12.8 g ±1.78 g); the specific growth rate per day during the second period forL. vannameiwas 6.34% (0.31 g ± 0.024 g to 13.88 g ± 1.73 g); the specific growth rate per day forS. constrictawas 2.41% (0.19 g ± 0.26 g to 3.41 g ± 0.81 g).The average yield ofL. vannameiwas 524 g m-2in one period, and the average yield ofS. constrictawas 2216 g m-2.In the trial II group, the specific growth rate per day during the first period forL. vannameiwas 7.37% (from 0.19 g± 0.01 g to 15.8 g ± 1.23 g); the specific growth rate per day during the second period forL. vannameiwas 6.78% (from 0.31 g ± 0.024 g to 18.1 g ± 2.11 g); the specific growth rate per day forS. constrictawas 2.67% (from 0.19 g ± 0.26 g to 4.67 g ± 0.44 g). The average yield ofL. vannameiwas 701 g m-2in one period, and the average yield ofS. constrictawas 6193 g m-2. The growth indices of the trial II group were significantly higher than that of the control (P< 0.05). The yield ofL. vannameiwas 25.25% higher than that of control, and the yield ofS. constrictawas 64.22%higher than that of the control.
4 Discussion
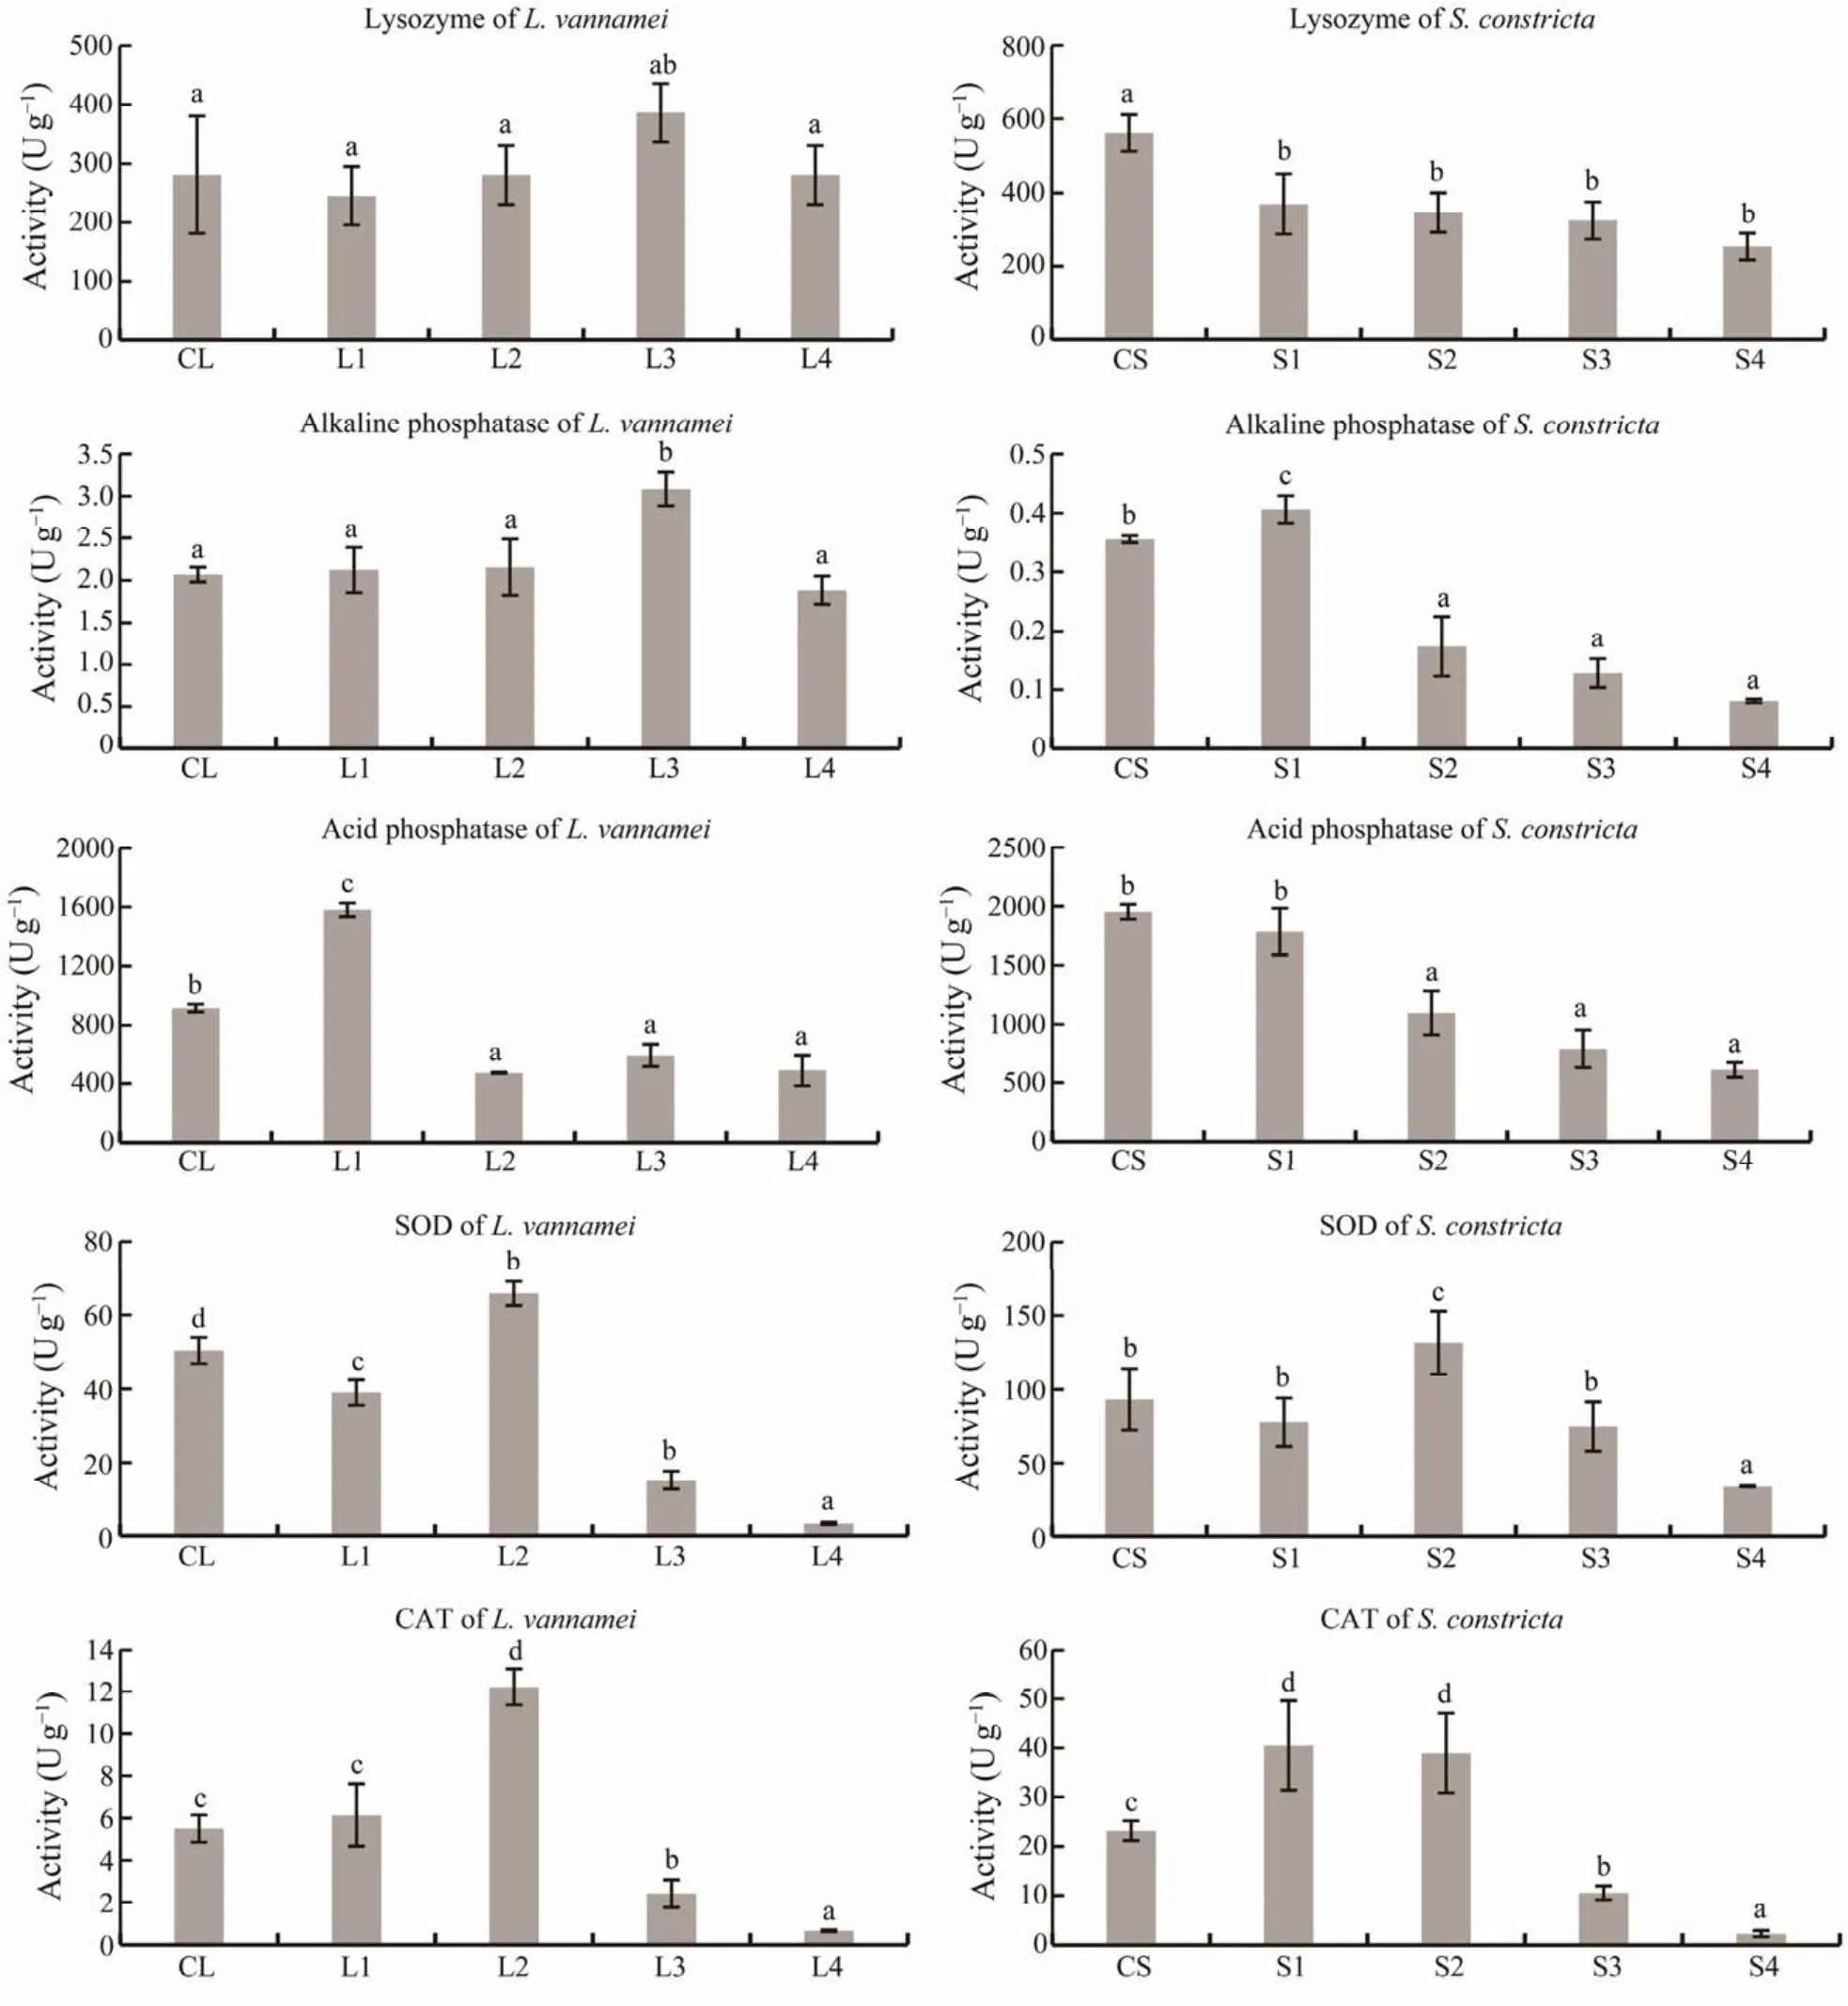
Fig.6 Changes in the activities of immune enzymes in L. vannamei and S. constricta. CL, initial values in L. vannamei; L1– 4, final values in L. vannamei in groups 1 – 4; CS, initial values in S. constricta ; S1 – 4, final values for S. constricta in groups 1 – 4 (P < 0.05).
Nitrogen and phosphorus are important water quality factors for aquaculture that can influence the growth and health of aquatic organisms (Chenet al., 1989; Green and Boyd,1995). In trial I, nitrogen and phosphorus were typically increased and then decreased. The rise might be due to the instability of the culture model with a series of connection betweenL. vannameiandS. constricta, and the decline indicates that the water quality was generally stable in this model, consistent with our previous study (Luoet al., 2020).The water quality factors were not very good during the 56 days in trial I compared to the larger system (Wuet al.,2005). The downward trend indicated that this system might be a useful culture model for larger water bodies and longterm culture. The water quality factors were much higher in the high culture density groups (groups 3 and 4), but the growth indices of high culture density groups were lower than those in the low-density groups, which suggests that the optimal culture capacity of this model might be close to group 2.
To further investigate the conditions ofL. vannameiandS. constrictain the four culture density groups, we measured digestive and LSAS enzymes’ activities. Culture density greatly influenced the digestive enzyme activities of shrimps (Xiaoet al., 2012), and digestive enzyme activities in bothL. vannameiandS. constrictawere higher in the low culture density groups than those in the high-density groups, which suggests that the feed efficiency might be much higher in low culture density groups, facilitating faster growth. Some studies have reported that the levels of several digestive enzymes can vary synchronously, consistent with our results (Franklin, 1950). Among LSAS enzymes, lysozyme hydrolyses bacterial cell walls and acts as a nonspecific innate immunity molecule against the invasion of bacterial pathogen (Bachaliet al., 2002; Hikimaet al., 2003). Many pollutants in aquatic environments such as heavy metals and high ammonia nitrogen can stimulate the activities of alkaline phosphatase and acid phosphatase (Chenet al., 2019), and we found that the activities of these three enzymes were higher in high culture density groups. Thus, we speculated that high culture density might induce immune reactions in response to high nitrogen and phosphorus concentrations.
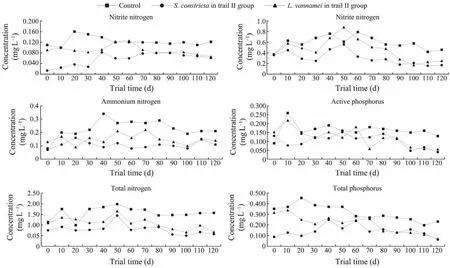
Fig.7 Changes in water quality factors in control and trial II groups. The x-axis represents the trial days and the y-axis represents the level of water quality factors (mg L-1).
We also measured the activities of SOD and CAT, which were higher in low culture density groups. SOD and CAT are LSAS enzymes that remove excessive oxygen free radicals produced in cells, and their activities are related to the immunity of animals and environmental stress (Hernándezet al., 2000), which further indicates that high culture density had a negative effect on the immune systems ofL. vannameiandS. constricta. Based on these results, the culture density of group 2 was selected for the larger water body in trial II.
To examine the feasibility of the series-connection culture model in productive practice, we scaled it up to a larger water body. In the larger culture model, we found that the changing trends for nitrogen and phosphorus in ponds were similar to those in trial I, but the water quality was much lower in the trial II model, which might be due to the larger water body. Compared with controls, the difference of water quality diminished in the latter stages of trial II,which indicated that the larger culture model achieved higher water quality. In our previous study, we found that the growth of Chlorophyta might be related to nitrogen and phosphorus in water (Luoet al., 2020), hence a rise in these two water quality factors during the initial stages of trial I and II might promote the growth of these phytoplankton,thereby stimulating the growth ofS. constricta. The rising trend in trial II might also be due to the higher temperature in July and August, consistent with other studies (Ren and Schiel, 2008), We therefore speculated that the downward trend in these two water quality factors during the latter stages of trial I and II might be due to the rise in phytoplankton in this model.
In addition, phytoplankton in theL. vannameipond may help the recovery of the population in theS. constrictapond,which may help to maintain the normal growth ofS. constrictain sunny days after the overcast weather.Moreover,the growths and yields ofL. vannameiandS. constrictawere higher than controls in the trial II group. Some studies have reported that high levels of nitrogen and phosphorus can trigger various diseases (Xiaoet al., 2012), hence our series-connection culture model could improve water quality and enhance the survival rate and yield of bothL. vannameiandS. constricta.
5 Conclusions
In the present study, we construct a series-connection culture system and found its optimal culture capacity forL. vannamei(40 ind m-2)andS. constricta(300 ind m-2). Our results showed the good growth, health, and high yields when using the optimal culture capacity, providing a reference for future mix-culture models of shrimp and shellfish.
Acknowledgements
This work was supported by the National Key Research and Development Plan (No. 2019YFD0900400), the Earmarked Fund for Modern Agro-Industry Technology Research System, China (No. CARS-47), and sponsored by the K. C. Wong Magna Fund in Ningbo University.
杂志排行
Journal of Ocean University of China的其它文章
- A Theoretical Model for the Microwave Emissivity of Rough Sea Surfaces
- Mechanism of Regional Subseasonal Precipitation in the Strongest and Weakest East Asian Summer Monsoon Subseasonal Variation Years
- Analytical and Experimental Studies on Wave Scattering by a Horizontal Perforated Plate at the Still Water Level
- Theoretical Prediction of the Bending Stiffness of Reinforced Thermoplastic Pipes Using a Homogenization Method
- Penetration Resistance of Composite Bucket Foundation with Eccentric Load for Offshore Wind Turbines
- Application of Converted Displacement for Modal Parameter Identification of Offshore Wind Turbines with High-Pile Foundation
