Identification of Non-Coding RNAs Based on Alignment-Free Features in Crassostrea gigas (Pacific Oyster)Transcriptome
2022-12-27CHAIWenjingandSONGKai
CHAI Wenjing, and SONG Kai
School of Mathematics and Statistics, Qingdao University, Qingdao 266071, China
Abstract Non-coding RNAs (ncRNAs)play important roles in the regulation of many biological processes, such as transcription initiation and epigenetic modifications that occur after transcription and development. Several novel transcripts have been identified via high-throughput sequencing. However, identifying ncRNAs among the transcripts of novel species using alignment-based features is difficult. Thus, developing a fast and accurate method based on alignment-free features to identify ncRNAs among novel transcripts is necessary. In this study, we proposed a new approach, namely, coding potential prediction based on alignment-free features (CPAF), to identify ncRNAs among a large number of candidates. CPAF used four types of features: Fickett score; Hexamer score; composition, transition, and distribution features; and modified k-mer. From the results, CPAF performed better than previous state-of-the-art methods in pred cting ncRNA transcripts, with particular reference to small ncRNAs. Finally, we applied CPAF to identify ncRNAs in Pacific oyster transcripts. Our approach identified more ncRNAs than other previously used methods.
Key words Non-coding RNA; alignment-free; k-mer; transcripts
1 Introduction
Non-coding RNAs (ncRNAs)are RNA molecules that do not encode proteins (Kapranovet al., 2010; Laurentet al.,2015). Although these RNAs do not encode proteins, many studies have shown that they play important roles in the regulation of many biological processes, such as embryonic development, stem cell maintenance, cell differentiation, signal transduction, and immune response (Wiluszet al.,2009; Hung and Chang, 2010; Pauliet al., 2012; Morris and Mattick, 2014).
With recent developments associated with high-throughput sequencing technology, a large amount of RNA sequencing data have been obtained, and several novel transcripts have been identified, including a large number of ncRNA sequences (Nagalakshmiet al., 2008; Ozsolak and Milos,2011). Identifying novel ncRNA transcripts is the first step in comprehensively annotating and studying the biological functions of these RNAs. At present, the methods for identifying ncRNAs rely primarily on extracting features from transcript sequences, training a classification model using these features with variable selections, and making predictions based on the trained model. Different analytic tools have been developed for the classification of coding RNAs and ncRNAs. In previous studies, Konget al. (2007)produced an alignment-based tool, namely, a coding potential calculator (CPC), which evaluates the coding potential of transcripts by extracting six features from the sequences of the transcripts. Based on the open reading frame(ORF), the CPC obtained three ORF features, including ORF quality, coverage, and integrity, and other three features by comparing the sequence with the protein library.These six features were then used to train the support vector machine (SVM)model to obtain the final prediction model. However, CPC relies on known protein libraries to predict ncRNAs. The predictive capability of this approach is insufficient for transcripts analysis, which lack similar protein sequences in existing databases or those obtained from novel species. The CPC2 (Kanget al., 2017)model, an upgraded version of the CPC, is approximately 1000 times faster, and it displays a higher accuracy for predicting ncRNAs. Moreover, CPC2 is species-non-specific. Wanget al. (2013)developed another tool for evaluating the potential of transcripts for encoding proteins, referred to as CPAT, which uses a logistic regression model based on four sequence characteristics: ORF size, ORF coverage, Fickett score, and Hexamer score. Sunet al. (2013)designed CNCI,which distinguishes coding RNAs from ncRNAs using the intrinsic composition of a sequence. CNCI constructed a 64 × 64 score matrix by profiling adjoining nucleotide triplets to evaluate the coding potential of transcripts. Liet al.(2014)developed PLEK, which usesk-mer vectors to distinguish coding RNAs from ncRNAs. Tonget al. (2019)developed CPPred, which uses multiple sequence features to construct an SVM classifier for predicting ncRNAs. Compared with previous approaches, CPPred can remarkably distinguish not only coding RNAs from ncRNAs but also small coding RNAs (ORF length ≤ 303 nt)from ncRNAs.However, its prediction accuracy for small RNAs is not as high as that for long RNAs. In addition, CPPred relies on alignment-based features, such as ORF coverage and integrity. These approaches based on alignment features are not suitable for newly sequenced species without existing databases. Thus, constructing a classification approach that relies solely on alignment-free features for predicting ncRNAs is necessary.
Diploid oyster,Crassostrea gigas(also known as the Pacific oyster), a marine species important for aquaculture,has been used as a model shellfish in genetic and evolutionary analyses (Gagnaireet al., 2018; Guoet al., 2018;Song, 2020b). Research on theC. gigasgenome (Zhanget al., 2012)and many transcriptome resources (Fenget al.,2018; Liet al., 2021)indicates that analysis of its ncRNAs is feasible. Previous studies have identified ncRNAs inC.gigasusing CPC, CPAT, and Pfamscan. Thus, in the current study, we used our proposed method to identify ncRNAs inC. gigas.
In this study, we developed a coding potential prediction based on alignment-free features (CPAF), a classifier that uses logistic regression based on alignment-free features to distinguish coding RNAs from ncRNAs. CPAF showed higher accuracy than other state-of-the-art classification tools for predicting ncRNAs from transcripts, particularly for RNAs with small ORFs. Finally, we applied CPAF to identify ncRNAs among Pacific oyster transcripts. Our approach identified more ncRNAs than other methods.
2 Materials and Methods
2.1 Dataset
Two models were used to evaluate the performance of ncRNA prediction from transcripts. The first model was a human-model, which was trained using human coding RNA and ncRNA sequences and subsequently tested on humans(Homo sapiens), mice (Mus musculus), and zebrafish (Danio rerio)transcripts. The second model was an integrated model trained using integrated species, including humans,mice, zebrafish, fruit flies (Drosophila melanogaster), and nematodes (Caenorhabditis elegans). The integrated model was also tested on the remaining transcripts from these species.
Coding RNAs and ncRNAs of these species were downloaded from the Ensembl database. For the human dataset,90872 and 49829 transcript sequences of coding RNAs and ncRNAs were downloaded, respectively. We randomly selected four-fifths of the data as a training set, including 72697 coding RNAs and 39863 ncRNAs, through Human-Training. The remaining coding RNAs and ncRNAs were used as Human-Testing datasets. We selected the ncRNA with ORF length ≤ 300 nucleotides to construct small ORF(sORF)datasets, resulting in 2077 small coding RNAs and 2077 small ncRNAs as Human-sORF-Testing datasets. The abovementioned processes were repeated 100 times, and the mean and standard deviations for the evaluation index were calculated. For the human-model, we also constructed Mouse-Testing datasets, Mouse-sORF-Testing datasets, Zebrafish-Testing datasets, and Zebrafish-sORF-Testing datasets. The numbers of transcripts in these datasets are shown in Table 1. For mouse and zebrafish datasets, all human coding RNAs and ncRNAs were used to construct the training model.

Table 1 Numbers of transcripts in Mouse- and Zebrafish-Testing sets
Several model species were used to construct an integrated model and address specificity in the training model of a single species. The data for humans, mice, zebrafish,fruit flies, and nematodes were also downloaded from the Ensembl database, including 167841 coding RNAs and 67534 ncRNAs. The fruit fly dataset included 14059 coding RNAs and 2530 ncRNAs. The nematode dataset included 18988 coding RNAs and 1674 ncRNAs. Then, we constructed integrated training datasets by randomly selecting four-fifths of the data, including 134272 coding RNAs and 54027 ncRNAs, in equal proportion to that of their nc-RNAs. Small ORF sequences were used as testing sets,but they were not used in training datasets. The remaining data were used as testing sets. The abovementioned process was repeated 100 times, and the mean and standard deviation were calculated for accuracy.
2.2 CPAF Features
We used three types of features from previously published studies and novel modifiedk-mer features to predict nc-RNAs from transcripts.
Two of the features, the Fickett score and the Hexamer score, were proposed by CPAT (Wanget al., 2013). The Fickett score considers eight transcript features. Four of these are composed of four nucleotides, A, T, C, and G. The other four features are position values. These eight values are converted into coding probabilities using a lookup table.Then, each probability is multiplied by weight to produce the Fickett score. The Hexamer score indicates the bias of adjacent amino acids in proteins. In this study, the log-likelihood ratio was used to measure differential hexamer usage between coding and non-coding sequences. In addition,we used 30 composition, transition, and distribution (CTD)features proposed by CPPred (Tong and Liu, 2019). These features included nucleotide composition, nucleotide transition among adjacent positions, and relative positions along the transcript sequence of each nucleotide.
We also added 64 new features, including modifiedkmers. In particular, we used ak-mer with a length of 3 (3-mer features). Thus, for a sequence from a transcript, we first considered the number of occurrences for each 3-mer.Then, the modified 3-mer was estimated as the number of occurrences minus the expected number of occurrences. For example, for AAG, the modified 3-mer,(AAG), was defined as

whereX(AAG)is the number of occurrences of AAG in the sequence;E(AAG)is the expected number of occurrences of AAG, which can be calculated using

whereNis the total number of occurrences of the 3-mer,andpAandpGare the nucleotide composition of the sequence. We used these 96 features for classification.
2.3 Logistic Regression Classifier with Lasso
Based on the abovementioned features, we used a logistic regression model to construct a binary classifier. Considering that the 96 abovementioned features may have redundant features, we added Lasso regularization to enable feature selection and improve model accuracy. The model was evaluated using 10-fold cross-validation. The area under the ROC curve (AUROC)was calculated using the ROCR package. The optimal score was selected by maximizing the sensitivity and specificity of the CPAF.
2.4 Performance Evaluation for CPAT
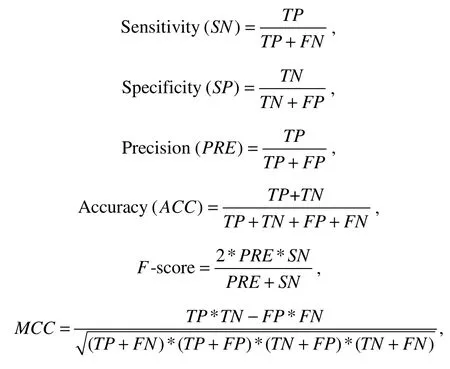
We evaluated the performance of CPAF and other approaches using the following metrics: sensitivity (SN), specificity (SP), accuracy (ACC), precision (PRE),F-score,AUROC, and Matthew’s correlation coefficient (MCC).

whereTPis the true-positive, which is the number of positive samples identified correctly.FN,TN, andFPrepresent false negative, true negative, and false positive, respectively.
2.5 Application to Oyster Transcriptome
RNA-seq datasets ofC. gigasfrom four lines of full-sib families were downloaded from the NCBI website under project number PRJNA381520 (Fenget al., 2018). First,paired-end reads were mapped to the oyster reference genome (GenBank accession no. GCA_000297895.1)using HISAT2 (Kimet al., 2015). Then, the mapped reads were assembledviaStringTie (Perteaet al., 2015)using a reference-based strategy.
The assembled transcripts were filtered using the following criteria: i)short transcripts with lengths lower than 200 bp were removed; ii)single-exon transcripts were filtered out on the basis of the distance to other transcripts lower than 500 bp, which may be annotated to other transcripts;iii)single-exon transcripts with fragments per kilobase per million reads (FPKM)values < 2 and multiple-exon transcripts with FPKM values < 0.5 were removed. Next, the integrated model was used to identify ncRNAs from these filtered transcripts.
3 Results
3.1 CPAF Pipeline
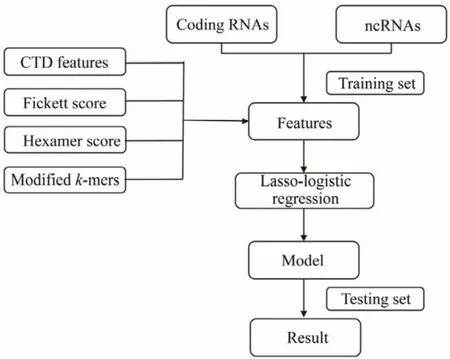
In CPAF, a logistic regression model was designed to calculate the potential of a transcript as an ncRNA using alignment-free features from RNA sequences (Fig.1). First,a training set was constructed using coding RNA and ncRNA sequences. Next, 96 alignment-free features were extracted from each transcript. The logistic regression model with Lasso regularization was used to select features and improve model accuracy. Finally, CPAF was analyzed and evaluated on the testing sets.

Fig.1 Coding potential prediction based on alignment-free features (CPAF)pipeline. Firstly, multiple alignment-free features were extracted from RNA sequences. Next, logistic regression with Lasso regularization was used to build a prediction model. Subsequently, the final model was tested and evaluated using testing sets.
3.2 Performance of CPAF (Human-Model)
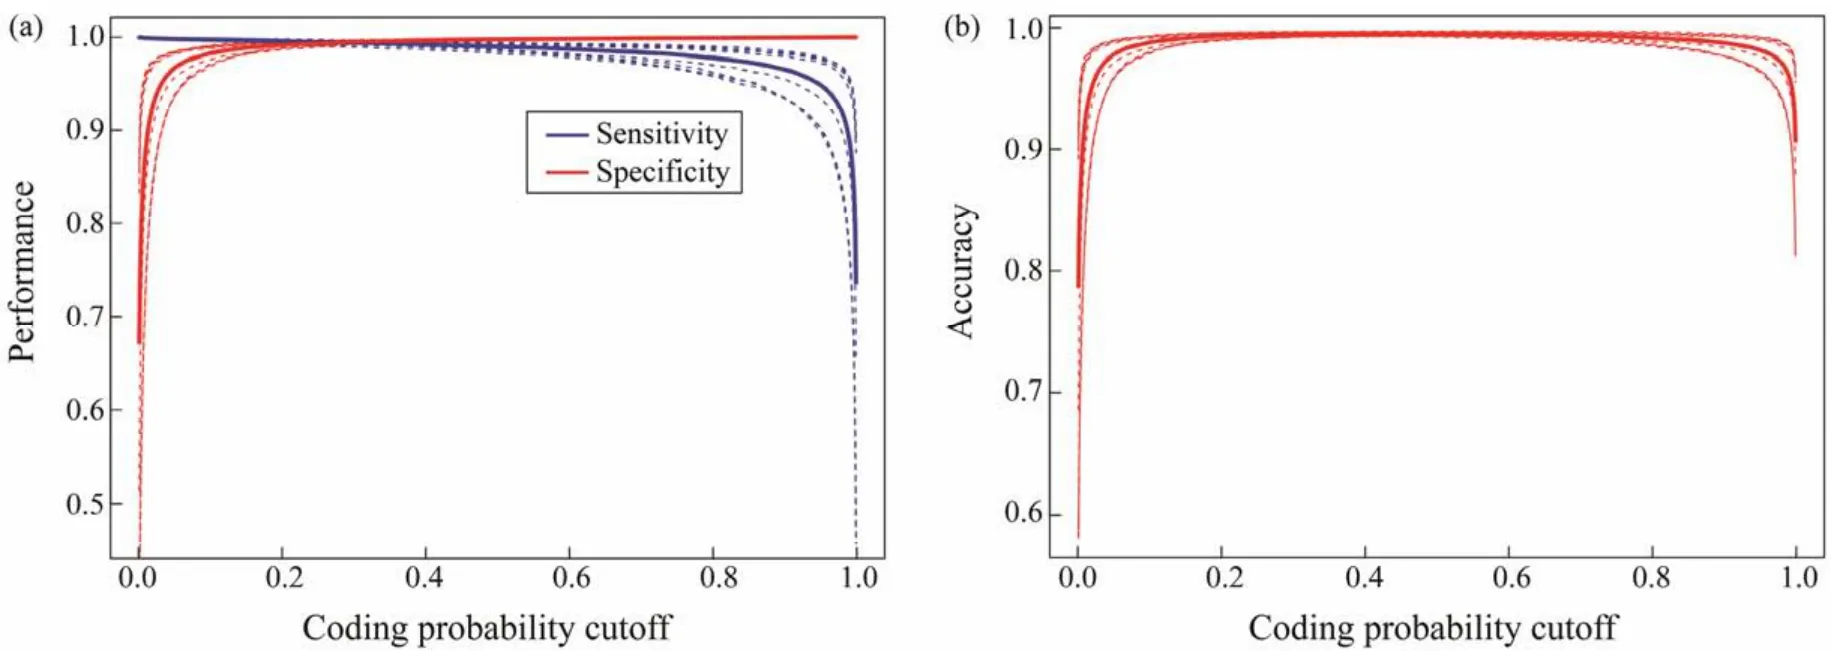
We used the testing transcripts from humans tocompare the performance of our approach with that of other methods(CPPred, CPAT, CPC2, and PLEK)in the human-model.Moreover, sORF testing sets from human transcripts were used for comparison. Nonparametric two-graph ROC curves were used to determine the optimal score threshold that maximized the discriminatory power (Fig.2). The results of Human-Testing and Human-sORF-Testing sets are shown in Tables 2 and 3. These results demonstrated that CPAF performed better than the other approaches. The accuracies of CPAF, CPPred, CPAT, CPC2, and PLEK were 99.39%,94.93%, 92.39%, 91.54%, and 95.52%, respectively. In addition, the AUCs of the abovementioned methods were 0.999, 0.977, 0.978, 0.976, and 0.980, respectively. For Human-sORF-Testing sets, which contained transcripts with small ORFs, the performance of CPAF was better than that of other approaches. The accuracy of the aforementioned methods was 95.14%, 76.81%, 67.72%, 50.95%, and 83.65%,respectively, whereas their AUC values were 0.993, 0.919,0.835, 0.785, and 0.932, respectively.

Fig.2 Selection of the optimum cut-off value using 10-fold cross-validation. (a)Sensitivity and specificity curves were used to determine the optimal cut-off value. (b)Accuracy versus cut-off value.

Table 2 Comparison among CPAF (Human-Model), CPPred, CPAT, CPC, and PLEK on the Human-Testing dataset

Table 3 Comparison among CPAF (Human-Model), CPPred, CPAT, CPC, and PLEK on the Human-sORF-Testing dataset
3.3 Performance of CPAF (Human-Model)in Predicting ncRNAs in Other Species
We trained the model using the abovementioned human transcripts and tested the transcripts from mice and zebrafish. Three methods, CPAF, CPPred, and CPAT, showed similar performances and better performance than the other two methods in the Mouse-Testing set (Table 4). However,for the mouse small ORF testing set, our approach, CPAF,performed better than the other methods (Table 5). The accuracy of CPAF was 91.66%, whereas those of the other methods were 71.75%, 65.85%, 55.04%, and 68.13%. TheAUCvalue of CPAF was 0.983, whereas those of other methods were 0.893, 0.830, 0.773, and 0.775.

Table 4 Comparison among CPAF (Human-Model), CPPred, CPAT, CPC, and PLEK on the Mouse-Testing dataset
The results of the zebrafish test set are shown in Table 6. The performance of CPAF was similar to that of CPPred but better than those of the other three methods. CPAF was inferior to CPPred inSNbut superior to the other indicators. In addition, regarding the Zebrafish-sORF-Testing set,CPAF performed significantly better than the other methods for all indicators (Table 7). The accuracy of CPAF was 93.43%, whereas that of the other methods was below 70%.Moreover, theMCCresult increased by 50%.

Table 5 Comparison among CPAF (Human-Model), CPPred, CPAT, CPC, and PLEK on the Mouse-sORF-Testing dataset

Table 6 Comparison among CPAF (Human-Model), CPPred, CPAT, CPC, and PLEK on the Zebrafish-Testing dataset

Table 7 Comparison among CPAF (Human-Model), CPPred, CPAT, CPC, and PLEK on the Zebrafish-sORF-Testing dataset
The abovementioned results indicated that CPAF improved the prediction accuracy of long transcripts, while for short transcripts, it performed better than the other methods.
3.4 Performance of CPAF (Integrated-Model)
We constructed an integrated model using coding RNAs and ncRNAs from different species to address species specificity of transcript sequences, including humans, mice, zebrafish, fruit flies, and nematodes. Integrated and sORF testing sets were also constructed using transcripts from these species. CPAF performed better than the other methods (Table 8). For Integrated-sORF-Testing sets, CPAF performed better for all indicators, exceptSP(Table 9). The accuracy of CPAF was 93.91%, whereas the accuracies of the other methods were 89.30%, 82.65%, 73.18%, and 63.73%.TheAUCof CPAF was 0.984, whereas that of the other methods was 0.953, 0.926, 0.883, and 0.739.

Table 8 Comparison among CPAF (Integrated-Model), CPPred, CPAT, CPC, and PLEK on Integrated-Testing

Table 9 Comparison among CPAF (Integrated-Model), CPPred, CPAT, CPC, and PLEK on Integrated-sORF-Testing
3.5 Performance of CPAF on Different Features
We built models using all features, except for modifiedk-mers, to highlight the importance of modifiedk-mer features. Then, we compared their performance on Human-Testing and Human-sORF-Testing datasets. The results are shown in Table 10. For Human-sORF-Testing datasets, the use of all feathers performed better than not using modifiedk-mers. For Human-Testing datasets, the results using all feathers were also better, though they were not as good as the results for Human-sORF-Testing datasets. The results showed that modifiedk-mers were important in predicting ncRNAs, particularly for sORF data.
3.6 Sensitivity of CPAF to Mislabeling
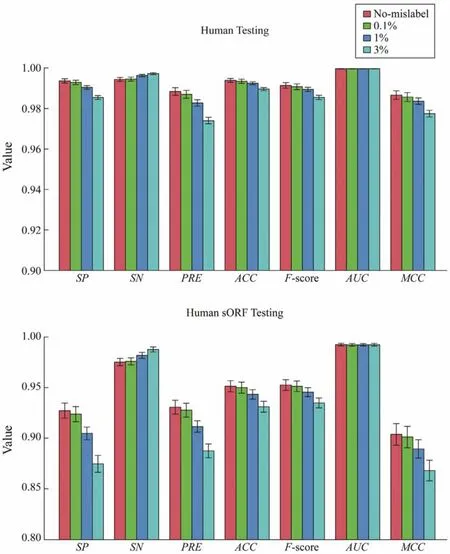
Considering that the construct of prediction models relied on correctly labeled transcript sequences, and a process might contain errors, the sensitivity of CPAF to mislabel-ing was tested. When constructing the human-model, we introduced random mislabeling for ncRNAs and coding RNAs.The fractions of mislabeling were set as 0.1%, 1%, and 3%for ncRNAs and coding RNAs in training models. Then,the prediction models were tested on Human-Testing datasets and Human-sORF-Testing datasets. Fig.3 shows that the performance of the prediction model with 0.1% of mislabeling was not significantly different from that of the prediction model without mislabeling for Human-Testing and Human-sORF-Testing datasets. For prediction models with 1% and 3% mislabeling, the performances were significantly worse than those without mislabeling (ttest,P< 0.01).

Table 10 Performance of CPAF was trained using all the features and non-k-mer features and tested on Human-Testing and Human-sORF-Testing datasets

Fig.3 Sensitivity of CPAF to mislabeling. The Human-Model was constructed using ncRNAs and coding RNAs with random mislabeling. The fractions of mislabeling were set as 0.1%, 1%, and 3% for both ncRNAs and coding RNAs in training models. Then, the prediction models were tested on Human-Testing datasets and Human-sORF-Testing datasets.
3.7 Application of CPAF in Oyster Transcripts
Here, we applied CPAF to identify ncRNAs from oyster transcripts. RNA-seq datasets from mantle tissues were used to assemble transcripts. A total of 165165 transcripts were assembled using StringTie (Perteaet al., 2015). After filtering, we identified 21411 ncRNAs in oysters using the integrated model. These ncRNAs correspond to 12935 ncRNA gene loci. The total number of ncRNA and ncRNA gene loci identified by our approach were higher than previous results (11637 gene loci)obtained using CPC, CPAT, and Pfamscan. A total of 10263 gene loci overlapped between CPAF and other methods. Therefore, 2672 gene loci were identified by CPAF but not by other methods. The mean value of logistic scores for these 2672 gene loci was lower than that of the other gene loci (0.74vs. 0.85)identified by CPAF. These ncRNAs identified from the oyster genome may be used in future genetic and evolutionary studies.
4 Discussion
In this study, we proposed a new ncRNA prediction method, CPAF, which is based on alignment-free features. Four types of features were used in CPAF: Fickett score, Hexamer score, CTD features, and modifiedk-mer. Fickett and Hexamer scores were extracted from CPAT, whereas CTD features were extracted from CPPred. Modifiedk-mer, a novel concept in this field, were used to classify transcripts for the first time. We used logistic regression with Lasso regularization to build a prediction model. The results showed that the proposed method performed better than previous methods in predicting ncRNAs, especially with reference to small ncRNAs.
Compared with other methods, our proposed approach only utilized alignment-free features to construct the classification model. The widespread application of high-throughput sequencing technology has enabled the genomic and transcript sequences of numerous species, including those of a large number of non-model species, to be identified(Liet al., 2017; Namet al., 2017; Sunet al., 2017; Wanget al., 2017; Huoet al., 2020; Liet al., 2021). However,predicting ncRNAs from transcripts of these novel species using approaches that rely on alignment-based features is difficult. This finding indicated that developing methods that do not use alignment-based features is necessary to predict ncRNAs. Compared with the previous methods, our proposed method CPAF, which only uses alignment-free features, performed better in predicting both long and small ncRNAs.
In this study, we proposed the inclusion of modifiedkmers as novel features in classifying coding RNAs and ncRNAs. The importance of using modifiedk-mers as a feature when studying similarities among long sequences was reported for the first time by Reinertet al. (2009). They have been widely used in many other fields, such as phylogenetic tree construction (Songet al., 2013), metagenome comparison (Jianget al., 2012; Songet al., 2019), phage classification (Song, 2020a), identification of horizontal gene transfer (Tanget al., 2018), and virus-host interactions(Ahlgrenet al., 2017). Previous studies have indicated that the selection ofkmay affect the classification process. For large datasets, such as metagenomes, largekvalues show good performance, whereas very largekvalues are not required for comparisons among short sequences. Considering that the lengths of transcripts for study were not large,we proposedk= 3 to extract the features from the sequences.The modifiedk-mer was estimated using the number of occurrences minus the expected number of occurrences for eachk-mer. In calculating the expected number for eachkmer, we assumed an Independent and Identically Distributed (IID)model for these nucleotides, while high-order Markov Models were used in calculating the expectation in previous work (Songet al., 2014). High-order Markov Models require several parameters to be estimated, and the studied sequence are short; thus, they are not suitable for studying transcript sequences. In this study, we examined IID, first-order, and second-order models, and the results showed that the performance of IID and first-order models was similar to or better than that of the second-order model.
In this study, we used 96 features in the prediction model. The number of features was large; thus, it included redundant features. We added Lasso regularization to the logistic regression model to enable feature selection and avoid overfitting. In the Human-Model and Integrated-Model, we found that the coefficients of the 96 features were all nonzero, and they were used in the prediction model. However, the coefficients of some features are small. In addition,we found that the coefficients of 22 modifiedk-mer features were larger than 0.5, and only the coefficients of four nonmodifiedk-mer features were larger than 0.5. Therefore,thek-mer features played important roles in the prediction models.
An increasing number of aquatic organisms have shown to be useful genomic resources. However, the identification of novel ncRNA sequences from these organisms is hindered by the lack of available sequence information in current databases. Therefore, the developed approach may be utilized to identify ncRNAs in these species. As a model shellfish organism,C. gigashas rich genome and transcriptome information. The results inC. gigasdemonstrate that our method can identify more ncRNAs than other methods.This new method can also be employed in the genomic and epigenetic studies in other marine shellfish.
Acknowledgement
This research was supported by the National Natural Science Foundation of China (No. 11701546).
杂志排行
Journal of Ocean University of China的其它文章
- Comparison of Flavor Substances in Dried Shrimp Products Processed by Litopenaeus Vannamei from Two Aquaculture Patterns
- Identifying Summer/Autumn Habitat Hotspots of Jumbo Flying Squid (Dosidicus gigas)off Chile
- Allelopathic Interactions Between the Tropical Macrophyte Enhalus acoroides and Epibenthic HAB Dinoflagellate Prorocentrum concavum
- Removal of Arsenic from Chlamys farreri with Different Methods
- Optimal Culture Capacity of White Shrimp (Litopenaeus vannamei)and Razor Clam (Sinonovacula constricta)in a New Series-Connection Culture Model
- Complete Mitochondrial Genome Analysis of Daphniopsis tibetana (Branchiopoda: Diplostraca): New Insights into the Taxonomy of the Genus and Its Phylogenetic Implications for Branchiopoda
