Processes Controlling the Carbonate Chemistry of Surface Seawater Along the 150˚E Transect in the Northwest Pacific Ocean
2022-12-27MOULiangZHANGHonghaiCHENZhaohuiandHUYubin
MOU Liang, ZHANG Honghai, CHEN Zhaohui, and HU Yubin,
1) Institute of Marine Science and Technology, Shandong University, Qingdao 266237, China
2) Frontiers Science Center for Deep Ocean Multispheres and Earth System, and Key Laboratory of Marine Chemistry Theory and Technology, Ministry of Education, Ocean University of China, Qingdao 266100, China
3) Physical Oceanography Laboratory, Ocean University of China, Qingdao 266100, China
Abstract The problem of ocean acidification caused by the increase of atmospheric carbon dioxide concentration is becoming increasingly prominent. Field observation in the northwest Pacific Ocean was carried out along the 150˚E transect in November 2019.The distribution characteristics and influencing factors of the surface seawater carbonate chemistry, including dissolved inorganic carbon (DIC), total alkalinity (TA), pH, partial pressure of carbon dioxide (pCO2)and aragonite saturation state (Ωarag)were investigated. DIC and TA ranged from 1915 to 2014 μmol kg-1 and 2243 to 2291 μmol kg-1, respectively; DIC in general decreased with decreasing latitude, but TA had no clear latitudinal gradient. pCO2 values increased with the decrease of latitude and were all below the atmospheric pCO2 level, ranging from 332 to 387 μatm. pH on the total hydrogen ion concentration scale (pHT)decreased with the decrease of latitude in the range of 8.044 – 8.110, while Ωarag increased with the decrease of latitude in the range of 2.61 – 3.88,suggesting that the spatial distributions of pHT and Ωarag were out of phase. Compared with the present, the predicted values of pHT and Ωarag by the end of this century would decrease remarkedly; larger declines were found in the higher pHT and Ωarag regions, resulting in the differences along the meridional gradient becoming smaller for both pHT and Ωarag.
Key words ocean acidification; carbonate system; aragonite saturation state; seawater pH; Pacific Ocean
1 Introduction
The ocean is one of the largest carbon sinks, absorbing about 30% of anthropogenic CO2since pre-industrial times (Sabineet al., 2004; Caiet al., 2010). However, the CO2absorbed by the ocean reacts with seawater, resulting in a decrease in pH (Byrneet al., 2010), which is called the ocean acidification (Caldeira and Wickett, 2003; Feelyet al., 2004). The average surface pH of seawater, which was about 8.2 before the industrial revolution, has dropped by 0.1 (Orret al., 2005; Feelyet al., 2009). The pH is expected to decline by a further 0.3 – 0.5 units by the end of this century and global surface ocean pH would become increasingly more homogeneous with time (Brewer,1997; Jianget al., 2019). The pH can directly reflect the amount of H+in seawater, which is an important measure of ocean acidification. Doreet al. (2009)reported timeseries measurements of seawater pH and related parameters at the ALOHA observatory near the central North Pacific over the past 20 years, and found a significant long-term downward trend of about -0.0019 ± 0.0002 y-1in the pH of surface seawater, in response to the increase of the global atmospheric CO2concentration. In addition,aragonite has a higher solubility than calcite, resulting in organisms with aragonite calcium carbonate as their structure more susceptible to ocean acidification (Mucci,1983; Fabryet al., 2009). Therefore, the aragonite saturation state (Ωarag)is also commonly used to assess the impact of ocean acidification on calcareous organisms. The oceanic uptake of anthropogenic CO2would result in concomitant changes in seawater chemistry and adverse consequences for many organisms (Gattusoet al., 1999;Langdon and Atkinson, 2005; Iglesias-Rodriguezet al.,2008). Although pH and Ωaragare two commonly used parameters in assessing the impact of ocean acidification,factors (e.g., temperature, CO2gas exchange)affecting the distributions of pH and Ωaragcould be quite different(Caiet al., 2020).
Previous work in the West Pacific Ocean has focused on the study of air-sea CO2exchange (Doreet al., 2003;McKinleyet al., 2004), and the carbonate system as well as its related influence factors (Murataet al., 2009; Wakitaet al., 2010). For example, Murataet al. (2009)studied the interdecadal variability of anthropogenic CO2along the 149˚E transect of the Northwest Pacific Ocean and Wakitaet al. (2010)analyzed the interdecadal variation of DIC in the Northwest Pacific Ocean from 1992 to 2008.Both studies revealed the decadal variation of a single carbonate system parameter. However, the investigated data on the carbonate system are still scarce in this region.In this study, we investigated the whole carbonate chemistry of the surface seawater, including DIC, TA,pCO2,pH and Ωaragalong the 150˚E transect in the Northwest Pacific Ocean. We also predicted the changes in pH and Ωaragby the end of this century. This study aimed to reveal factors controlling the meridional distributions of the carbonate chemistry, with a special interest in the distributions of surface seawater pH and Ωarag.
2 Materials and Methods
2.1 Study Area
The survey area (40˚ – 13˚N, 150˚E)is located northwest of the Pacific Ocean, whose hydrological conditions are affected by ocean currents and different water masses(Fig.1). From north to south, the survey area is affected by the Subarctic Current, Kuroshio Extension, Subtropical Countercurrent and North Equatorial Current. The Subar- ctic Current passing through the survey area is around 40˚N, which originates from the subarctic North Pacific Ocean dominated by upwelling. The Kuroshio Extension is around 34˚N, which is formed by the eastward turning of the Kuroshio Current near the Japan coast.The Subtropical Countercurrent is found in the latitudinal band of 22˚ – 25˚N, and the North Equatorial Current exists at the southern end of the survey area (Qiu, 2001).
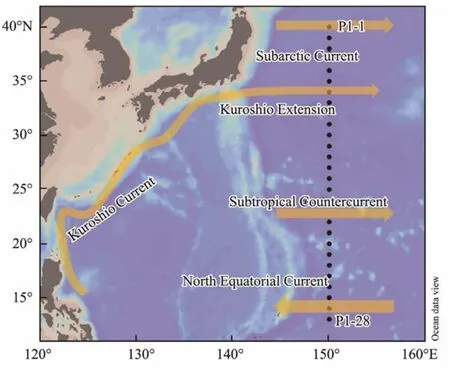
Fig.1 Sampling stations in the Northwest Pacific Ocean.
2.2 Sampling
Surface seawater samples were collected at each latitude (at an interval of 1 degree)from 40˚N to 13˚N along the 150˚E transect (P1)aboardR/V‘Dongfanghong 3’ in November 2019, except for stations P1-4, P1-17 and P1-18 (Fig.1). Water samples were collected using Niskin bottles mounted on a Seabird CTD system (911-plus, Seabird Corporation), which also measured the temperature and salinity of seawater. Duplicate pH samples were collected into 40 mL brown borosilicate glass vials after overflowing with at least twice their volume to minimize exposure with air. TA samples were collected into 250 mL high-density polyethylene (HDPE)bottles, immediately poisoned with 10 μL of saturated HgCl2, then stored in the dark at room temperature and brought back to the land laboratory for analysis within two months.
2.3 Analytical Methods
TA was determined by Gran titration using an open-cell with an automatic potentiometric titration system (T960,Hanon), and the concentration of HCl was calibrated using seawater certified reference materials (CRMs, Batch 178)from A. G. Dickson lab. Each sample was measured three times, using aged Pacific surface seawater with known TA values for quality control, with an accuracy of 0.1%. The pH samples were measured on board on the total hydrogen ion concentration scale (pHT,25)at 25 ±0.05℃ in a thermal bath using two independent benchtop pH meters (star A211, Thermo Fisher Scientific), each equipped with a combination electrode (8157BNUMD).The pH values were calibrated against the Tris buffer (pH= 8.094 at 25℃)from A. G. Dickson lab and converted toin situtemperatures (referred to as pHThereafter)using CO2SYS v2.1 program (Pierrotet al., 2006), with an overall precision of ± 0.005 pH units.
Knowing any two of the four carbonate system parameters (pH, TA, DIC andpCO2), the others of the carbonate chemistry can be calculated based on the thermodynamic properties (Millero, 2007). Thus, pHT, DIC,pCO2, Ωaragand Revelle factor (RF)were calculated from the measured pHT,25and TA data, using CO2SYS v2.1 program (Pierrotet al., 2006), together with thein situtemperature and salinity, and with the equilibrium constants of the carbonate acid K1and K2from Mehrbachet al. (1973)refit by Dickson and Millero (1987), the KHSO4was from (Dickson, 1990), and the [B]Tvalue from Uppström (1974). In order to assess the quality of the calculated data, DIC of an aged Pacific surface seawater (measured by a DIC analyzer (AS-C5, Apollo SciTech))was compared with the one calculated from the pHTand TA values which were measured by the same protocol as mentioned above. The difference between the measured and calculated DIC was within ± 2 μmol kg-1,suggesting the calculated DIC data were reliable.
2.4 Predictions of pHT and Ωarag by the End of This Century
Current predictions suggest that atmosphericpCO2will rise to (900 ± 50)ppm by 2100 and the rise in global mean surface temperature is likely to be 1.4℃ to 3.1℃ higher than present (IPCC RCP 6.0 projections). To predict the distributions ofin situsurface seawater pHTand Ωaragby 2100, we assumed a CO2concentration of 900 ppm in the atmosphere and a temperature 2℃ higher. We further assumed that surface oceanpCO2changes at the same rate as the atmosphericpCO2and the sea surface temperature (SST)will also rise by 2℃ by 2100 without TA changing over time. Surface seawater pHTand Ωaragat each sampling station along the P1 transect in 2100 were calculated from the surface seawaterpCO2and TA using CO2SYS program.
2.5 Statistical Analysis
The distributions of surface seawater temperature, salinity, DIC, TA, pHT, Ωarag,pCO2and RF along 150˚E transect from 40˚N to 13˚N were plotted using Ocean data view (Schlitzer, 2018). Correlation analysis in this study was performed by the Pearson correlation test using GraphPad Prism 8, with a significance level of 99%.
3 Results
3.1 Hydrographic Conditions
SST was in the range of 14.5 – 29.4℃ with a mean value of 26.0℃ and exhibited a clear latitudinal distribution(Fig.2a), increasing with decreasing latitude with abnormally low values at two northernmost stations (40˚N and 39˚N). The salinity was in the range of 33.46 – 35.04, with a mean value of 34.56, and the lowest values were also found at the two northernmost stations (Fig.2b), which were 33.61 and 33.46, respectively. Except for those two northernmost stations, the salinity of the rest stations was above 34 and generally followed bimodal distribution.The distributions of SST and salinity along the P1 transect revealed that the two northernmost stations were likely under the impact of the Subarctic Current, which is low in temperature and salinity.
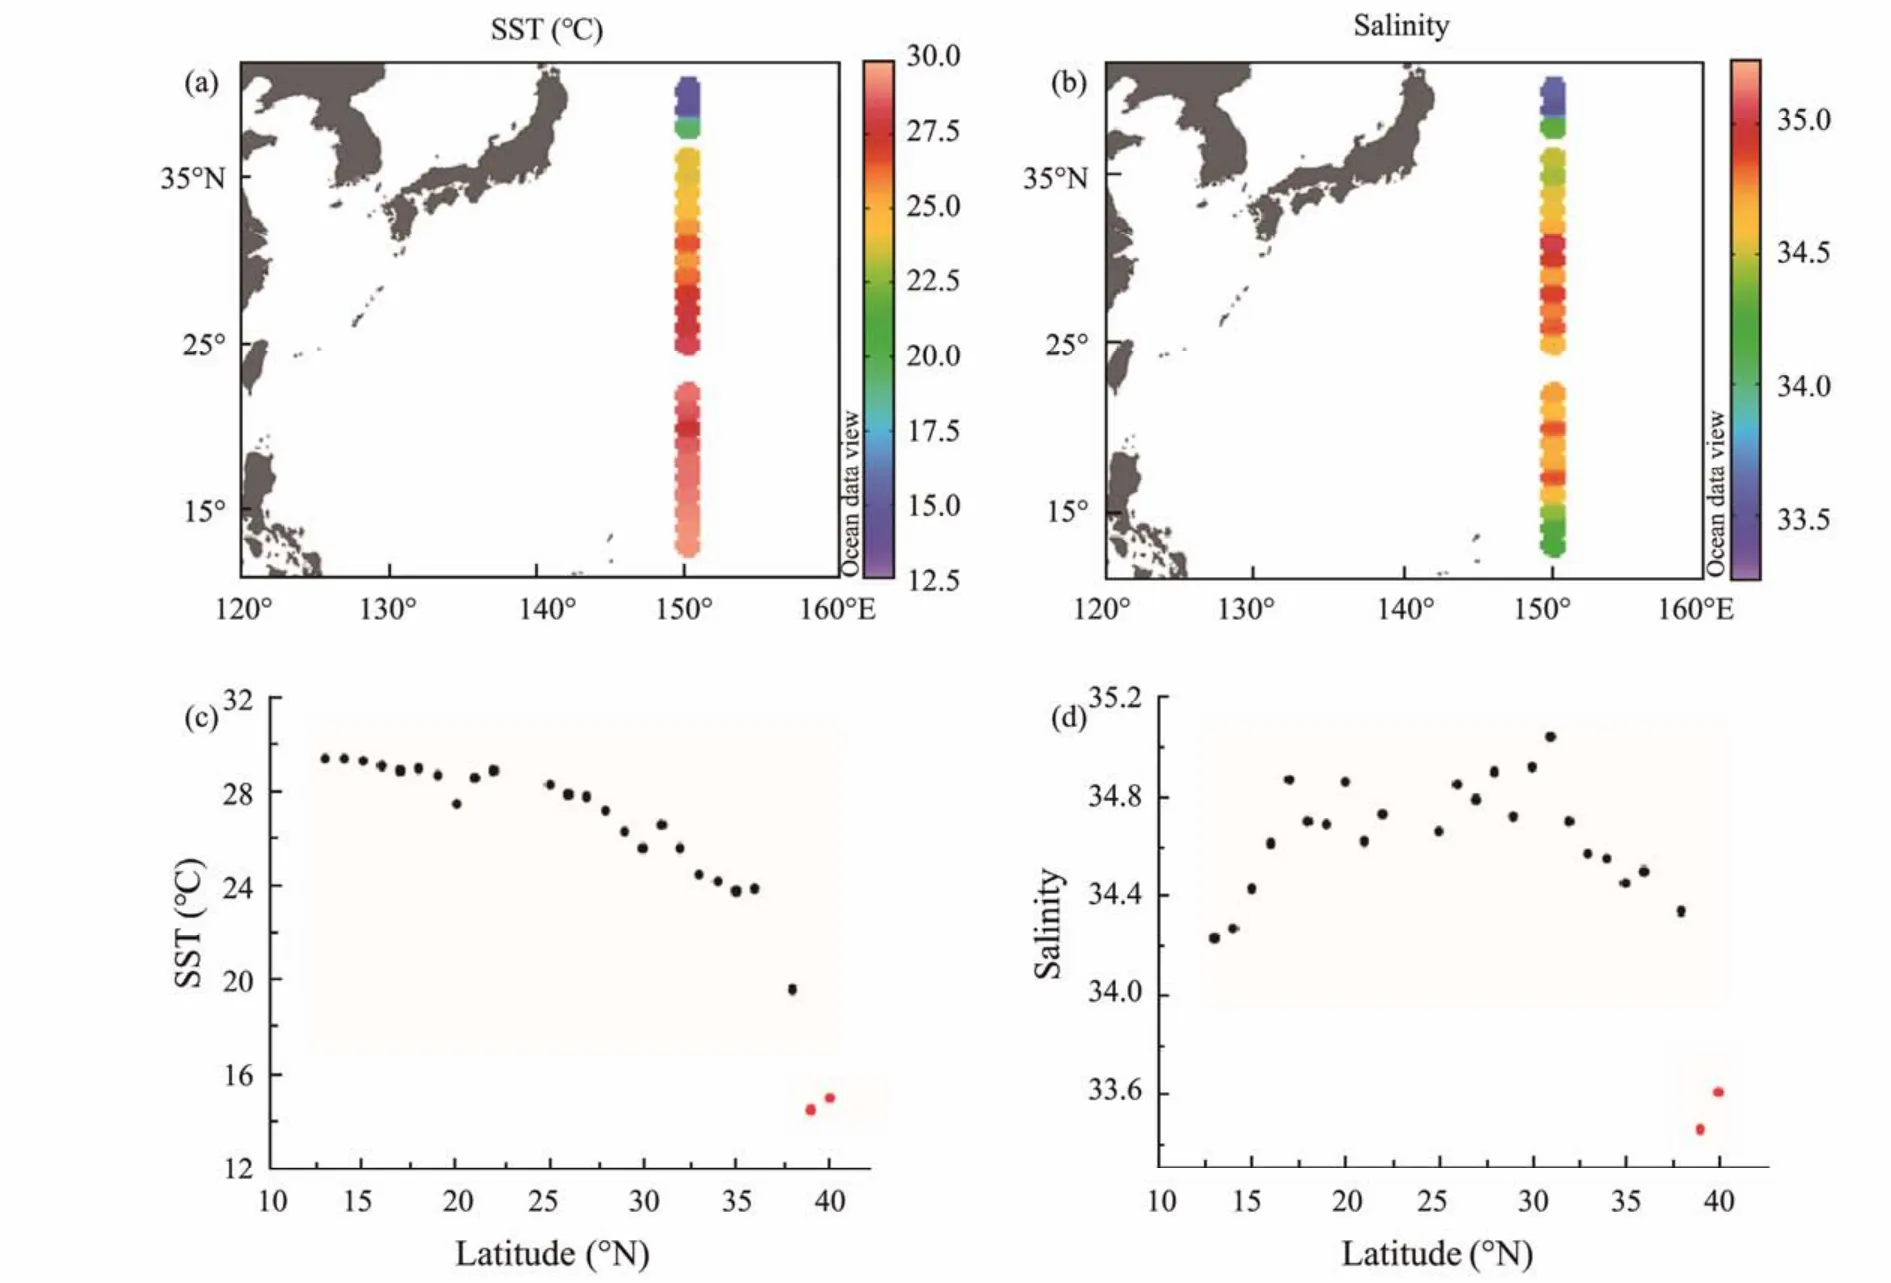
Fig.2 Distributions of sea surface temperature (a), salinity (b)and variations of sea surface temperature (c)and salinity (d)with latitude along 150˚E transect.
3.2 Distributions of Carbonate Chemistry
DIC values ranged from 1915 to 2014 μmol kg-1, decreasing with the decrease of latitude, with a mean value of 1954 μmol kg-1(Fig.3a). TA was in the range of 2243 –2291 μmol kg-1, with a mean value of 2270 μmol kg-1; it increased gradually from 40˚N to 31˚N and high values appeared near 31˚N. South of 31˚N, there was no latitudinal gradient in TA distribution (Fig.3b). The salinity-normalized DIC and TA (nDIC = DIC/S*35, nTA =TA/S*35)ranged from 1949 to 2107 μmol kg-1and 2288 to 2352 μmol kg-1along the P1 transect, respectively, with abnormally high values both at the two northernmost stations (Figs.3c and d). In general, nDIC decreased with decreasing latitude. But for nTA, except for the two northernmost stations, nTA of other stations were obviously lower and relatively homogeneous. The surface seawater pHTranged from 8.044 to 8.110, displaying a clear decrease pattern from north to south along the P1 transect (Fig.3e). Ωaragalso exhibited a significantly latitudinal pattern, but in contrast to pHT, it increased with decreasing latitude, ranging from 2.61 to 3.88 (Fig.3f).The surface seawaterpCO2was in the range of 332 – 387 μatm, increasing with the decrease of latitude (Fig.3g); all of them were well below the atmosphericpCO2which was around 412 μatm during the survey period (Dlugokencky and Tans, 2019), indicating that the whole survey area was a CO2sink. The difference inpCO2between the atmosphere and surface seawater (ΔpCO2=pCO2,air–pCO2,seawater)decreased from north to south, ranging from 80 to 25 μatm, indicating that the northern area was a stronger CO2sink. The spatial distribution of RF showed a clear meridional gradient along the P1 transect (Fig.3h),decreasing with the decrease of latitude from 11.02 to 8.98, with abnormally high values at the two northernmost stations.
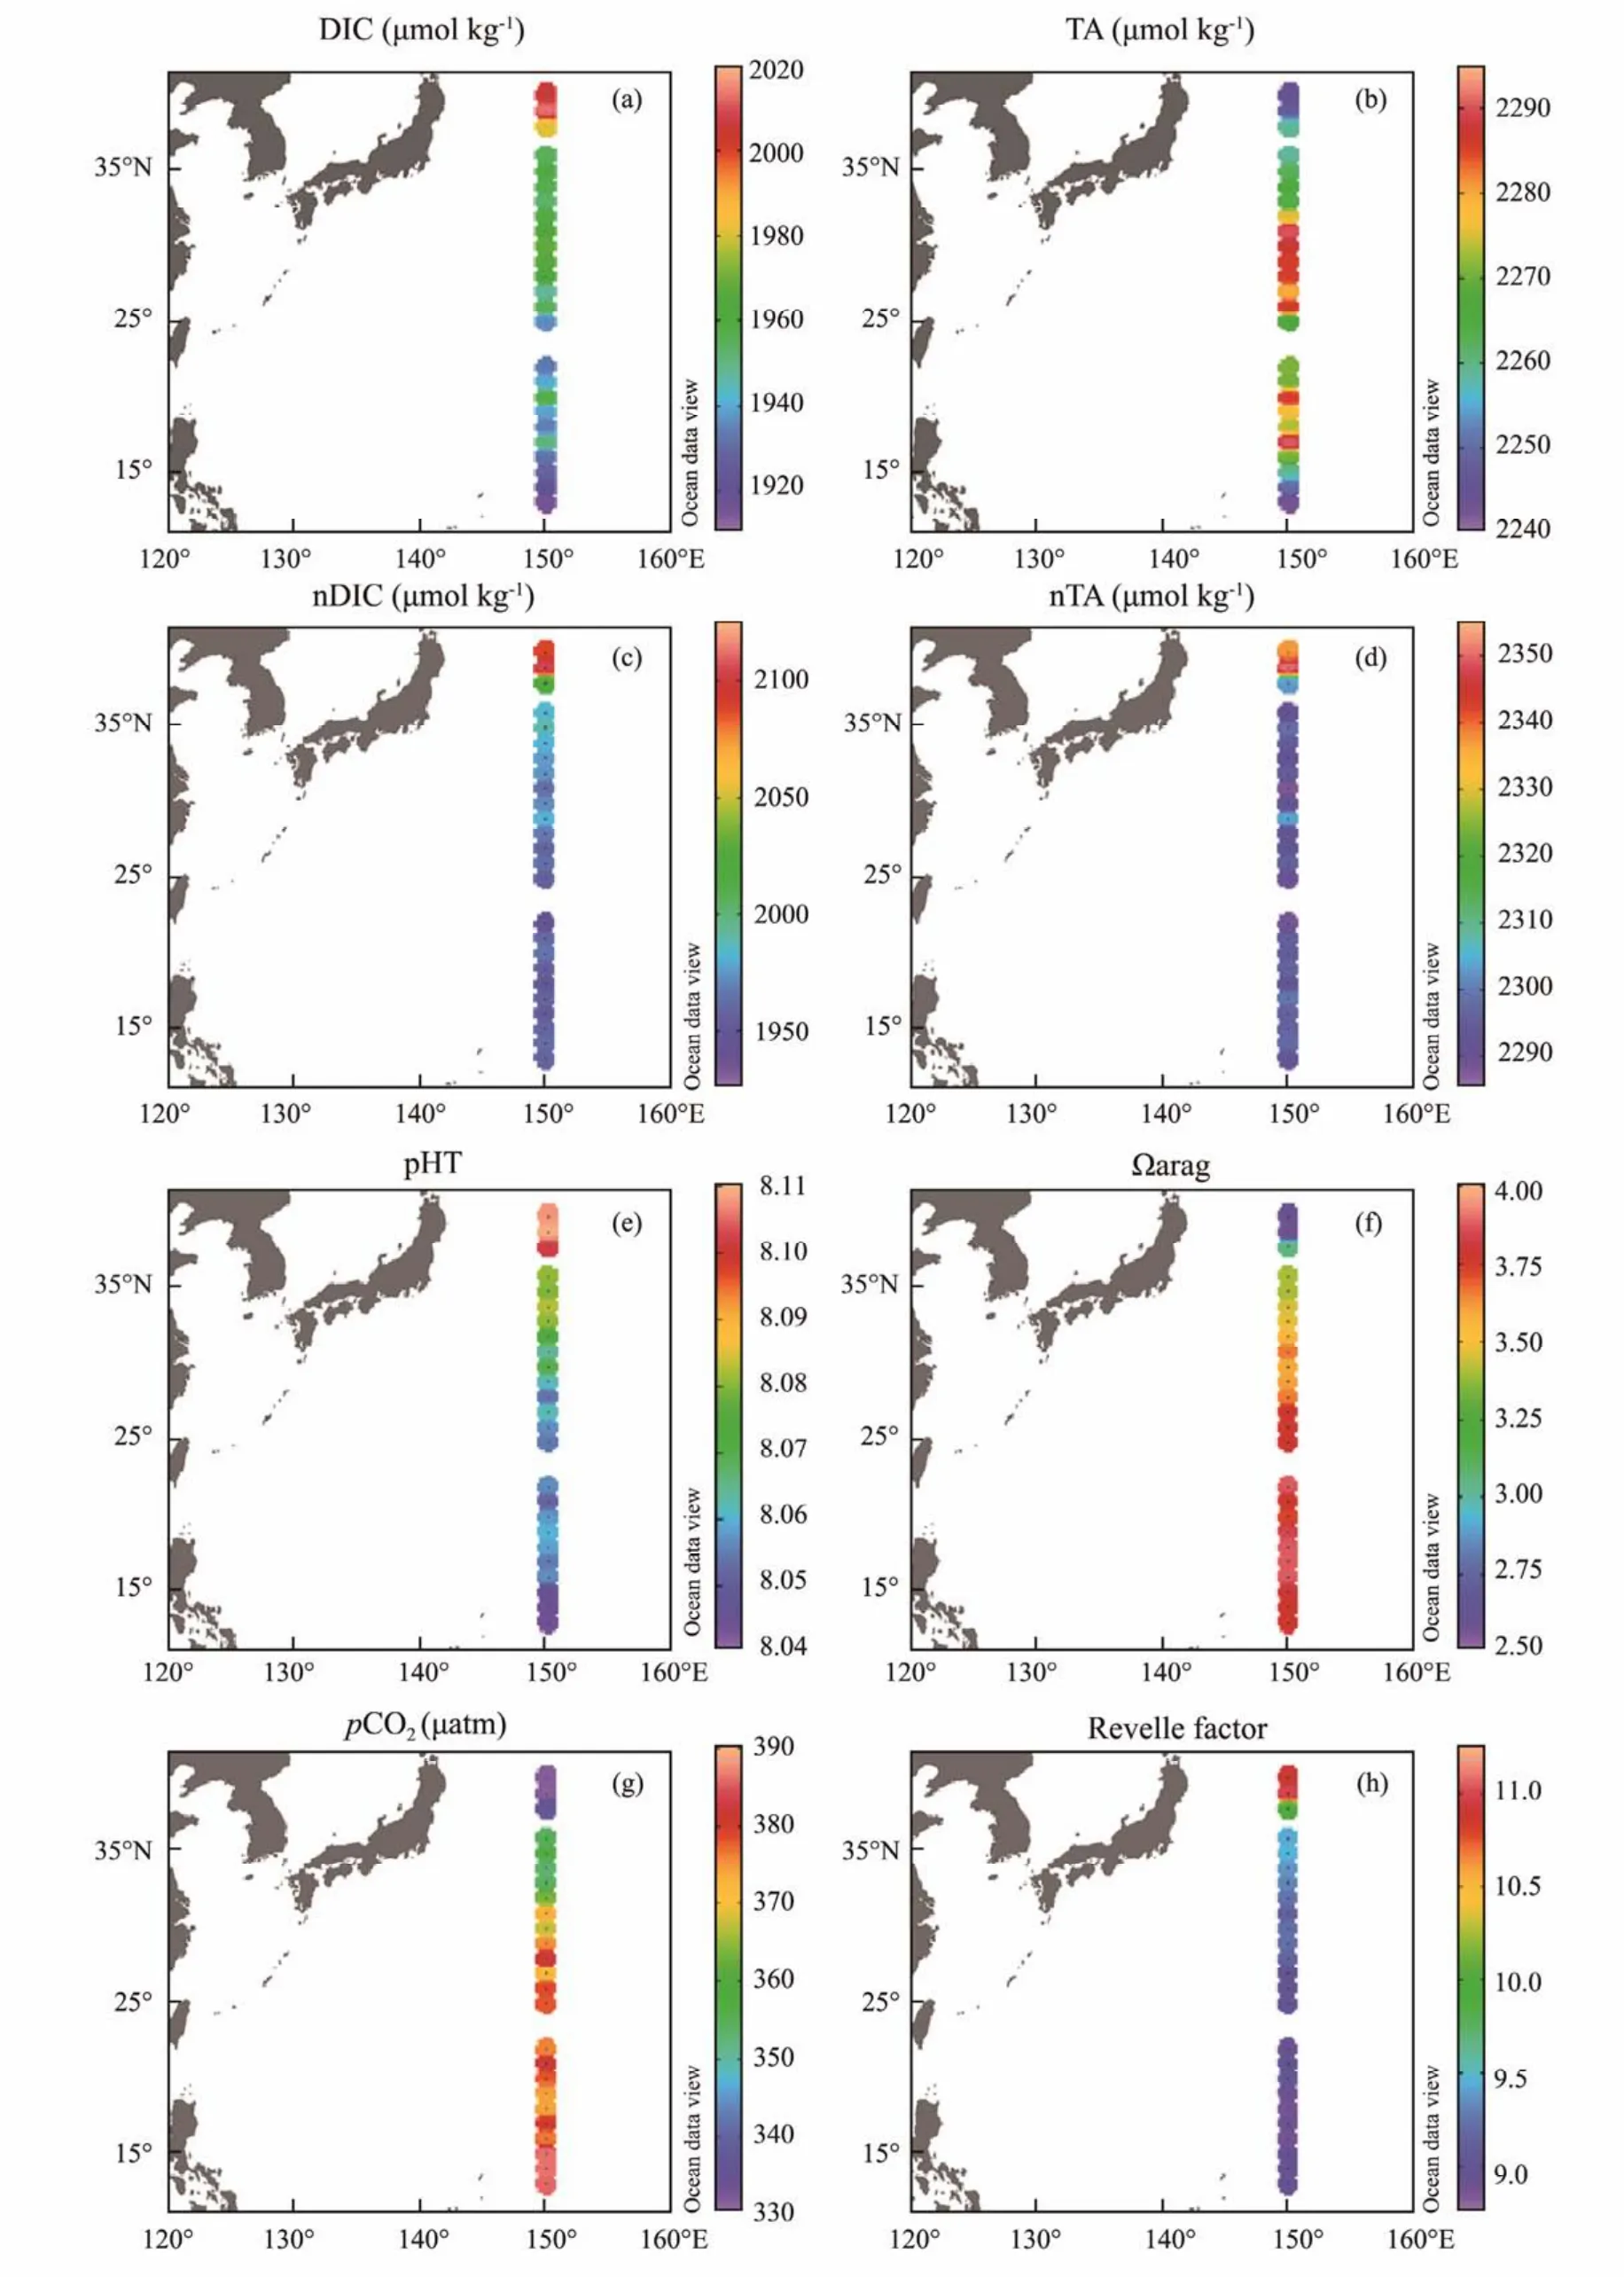
Fig.3 Distributions of carbonate chemistry along 150˚E transect. (a), DIC; (b), TA; (c), nDIC; (d), nTA; (e), pHT; (f), Ωarag;( g), pCO2; and (h), Revelle factor.
4 Discussion
4.1 Factors Affecting the Distributions of DIC, TA, pCO2 and RF
In order to better understand the processes controlling the distributions of carbonate chemistry, the survey regions along the P1 transect were divided into two subregions, namely, region 1 (stations from 38˚ to 13˚N)and region 2 (the Subarctic Current dominant regions: stations 40˚ and 39˚N), according to the SST-latitude and salinitylatitude diagrams (Figs.2c and d).
In region 1, DIC decreased from north to south along the P1 transect, while no clear pattern was found for TA.The variation of TA was closely related to salinity change(r= 0.96,P< 0.0001)(Fig.4a), indicating that TA was mainly controlled by water mixing. In regard to DIC, it is not only affected by the salinity change but also greatly affected by the air-sea CO2exchange and biological activities (Caiet al., 2020). In this study, there was a certain correlation between DIC and ΔpCO2(r= 0.63,P= 0.0012)(Fig.4b). Since surface seawaterpCO2values along the P1 transect were all below the atmosphericpCO2level,the larger ΔpCO2leads to more CO2being absorbed, resulting in higher DIC values in the northern parts of P1 transect. The Subarctic Current that originates from the subarctic North Pacific Ocean dominated by upwelling causes surface water around region 2 to have abnormally high TA and DIC, compared to the values predicted by the regression lines from region 1 (red dots in Figs.4a and b).
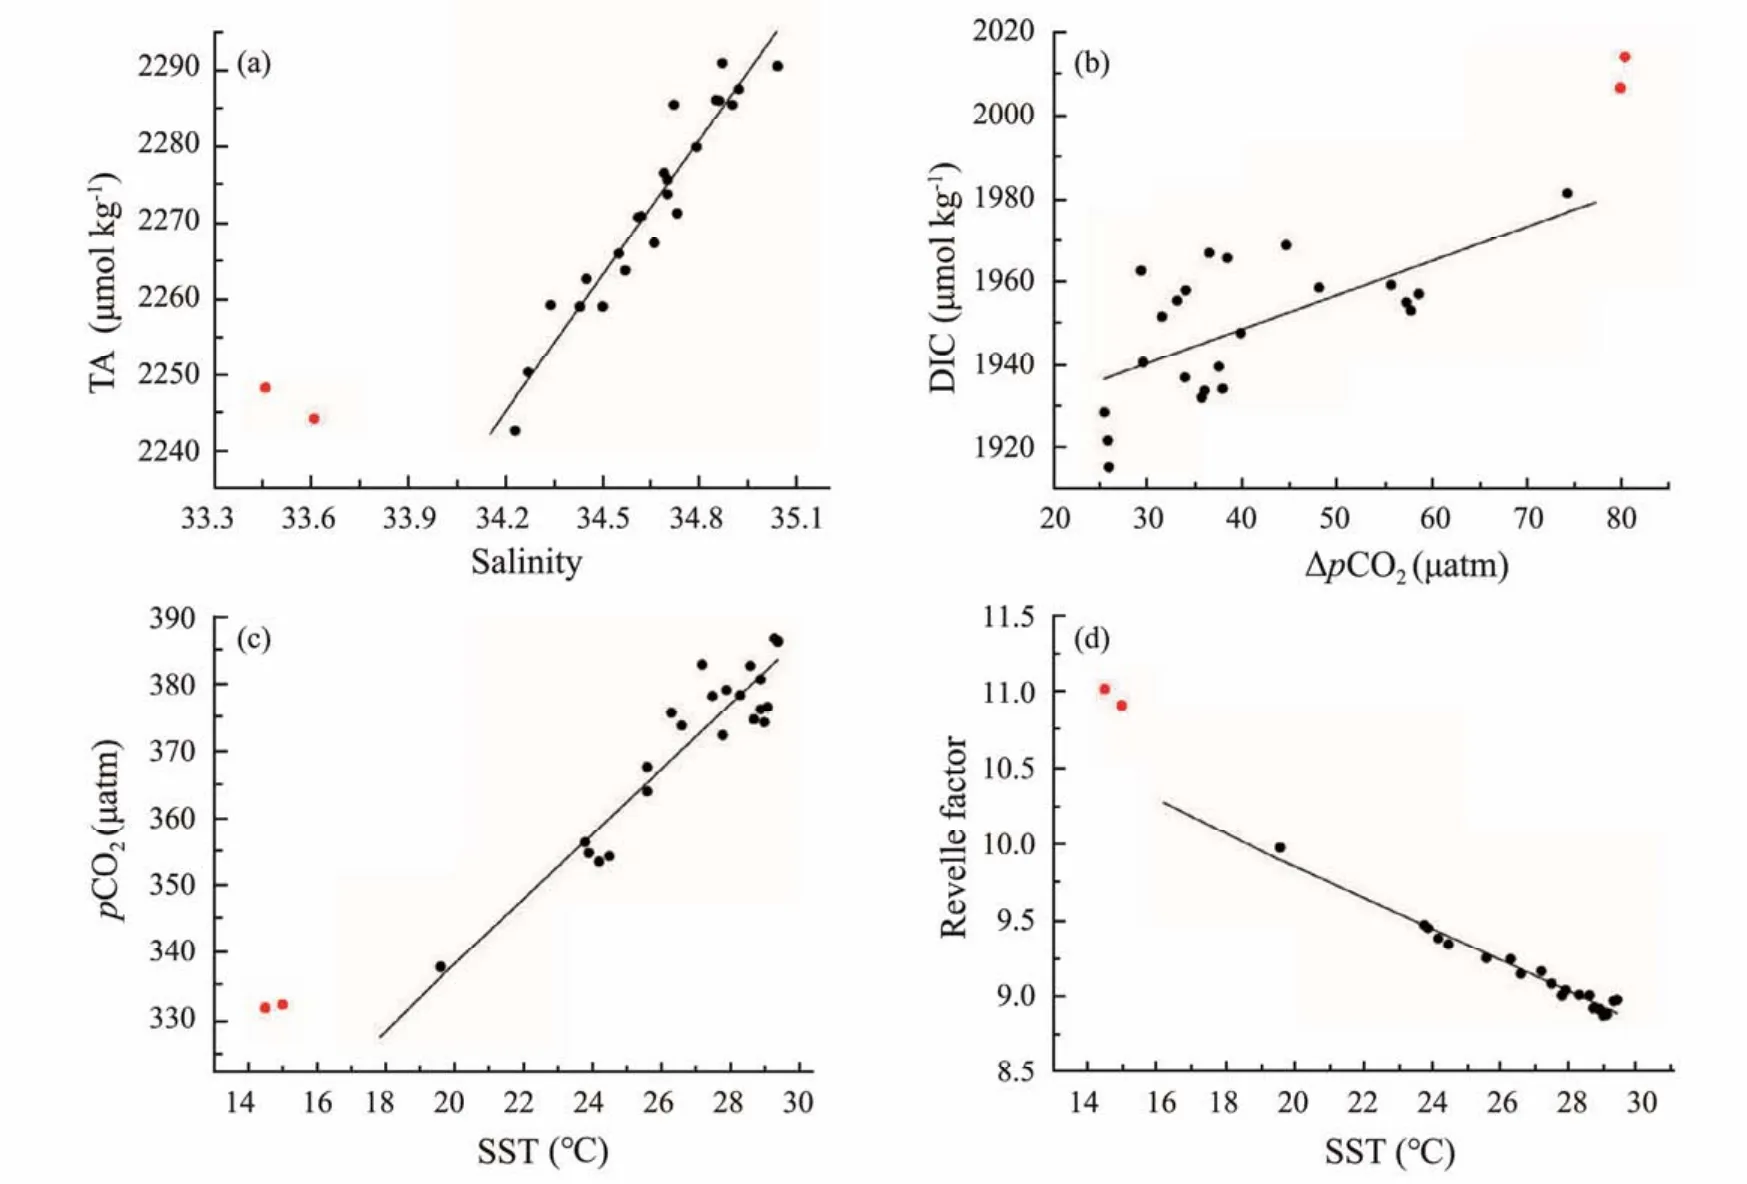
Fig.4 Relationships between TA and salinity (a), DIC and ΔpCO2 (b), pCO2 and sea surface temperature (c), Revelle factor and sea surface temperature (d). Red dots represent stations 40˚ and 39˚N of the 150˚E transect.
The strong positive correlation between temperature andpCO2(r= 0.93,P< 0.0001, excluding the two northmost stations)(Fig.4c)indicated that temperature plays an important role in latitudinal surface seawaterpCO2distribution. The higher the temperature, the lower the solubility of CO2, which results in an increase in seawaterpCO2and a decrease in carbon sink intensity. ThepCO2values of the two northernmost stations (red dots in Fig.4c)were significantly higher than those predicted by the regression line from region 1, possibly due to the impact of the Subarctic Current. Nevertheless, the surface seawaterpCO2remained substantially lower than the atmosphericpCO2, reflecting the important role of low SST in keepingpCO2lowviathermodynamic equilibrium shift and in maintaining a significant air-sea CO2disequilibrium (Caiet al., 2020).
RF, defined as the ratio between the fractional change inpCO2to the fractional change in DIC under the condition of constant temperature, salinity and TA, is a measure of the buffering capacity of seawater (Zeebe and Wolf-Gladrow, 2001). RF can be regarded as a function of temperature, which decreased with increasing temperature (r= -0.98,P< 0.0001, excluding the two northmost stations)(Fig.4d), explaining the latitudinal variation of RF along the P1 transect from north to south. The abnormally high RF values (red dots in Fig.4d)at the northern ends of P1 are mainly related to the abnormally low salinity and TA caused by the Subarctic Current passing through this region.
4.2 Effects of SST and ΔpCO2 on pH and Ωarag
From the north (40˚N)to the south (13˚N)along the P1 transect, the SST increased by nearly 15℃ and ΔpCO2decreased by 54 μatm, which provides a favorable condition for studying the effects of spatial variations of temperature and ΔpCO2on pH and Ωarag. The spatial variations of pHTand Ωaragbetween the northern end (40˚N)and the southern end (13˚N)along the P1 transect were 0.064 and -1.20, respectively. There were strong correlations between pHTand SST (Fig.5a,r= -0.96,P< 0.0001),and between Ωaragand SST (Fig.5b,r= 0.99,P< 0.0001),indicating that SST might play important roles in spatial distributions of pHTand Ωarag. According to Jianget al.(2019)and Xueet al. (2020), the influence of temperature on pH and Ωaragcan be divided into two aspects, namely,the internal temperature effect and the external temperature effect. The internal temperature effect refers to changing the existing form of CO2dissolved in water under constant TA and DIC conditions (i.e., closed system), increasing the dissociation of HCO3-and H2O and the concentration of H+and CO32-, thus decreasing pH and increasing Ωarag. The external temperature effect refers to the gas exchange caused by the change in CO2solubility, which decreases with increasing temperature,resulting in a decrease in seawater CO2concentration,thus increasing both pH and Ωarag. By altering the acidbase equilibrium of the carbonate system and CO2solubility-driven air-sea exchange, the combined effects of temperature would cancel out for pH resulting in little change of pH with temperature, whereas they reinforce each other for Ωarag. However, this hypothesis might not be completely true when air-sea CO2disequilibrium or other nonthermal components (e.g., water mass mixing and biological processes)have to be taken into consideration. As revealed by the study of Xueet al. (2021), if the seawater is under air-sea disequilibrium or under the influences of water mass mixing or biological processes,pH would be either more controlled by the thermal or nonthermal components, depending on their competing effects, while Ωaragwould be almost always dominated by its nonthermal components. In this study, pHTdecreased with the increasing temperature, suggesting that it is more controlled by the thermal components (i.e., internal temperature effect, Fig.5a, red dashed line)than the nonthermal components. However, the effect of the thermal components on pH was about 0.21, but the actual pHTdecreased only about 0.06, indicating that the effect of the thermal components was partially counteracted by the nonthermal processes. Although Ωaragwas positively correlated with SST, the thermal components only partially contribute to an increase in Ωarag(Fig.5b, red dashed line).
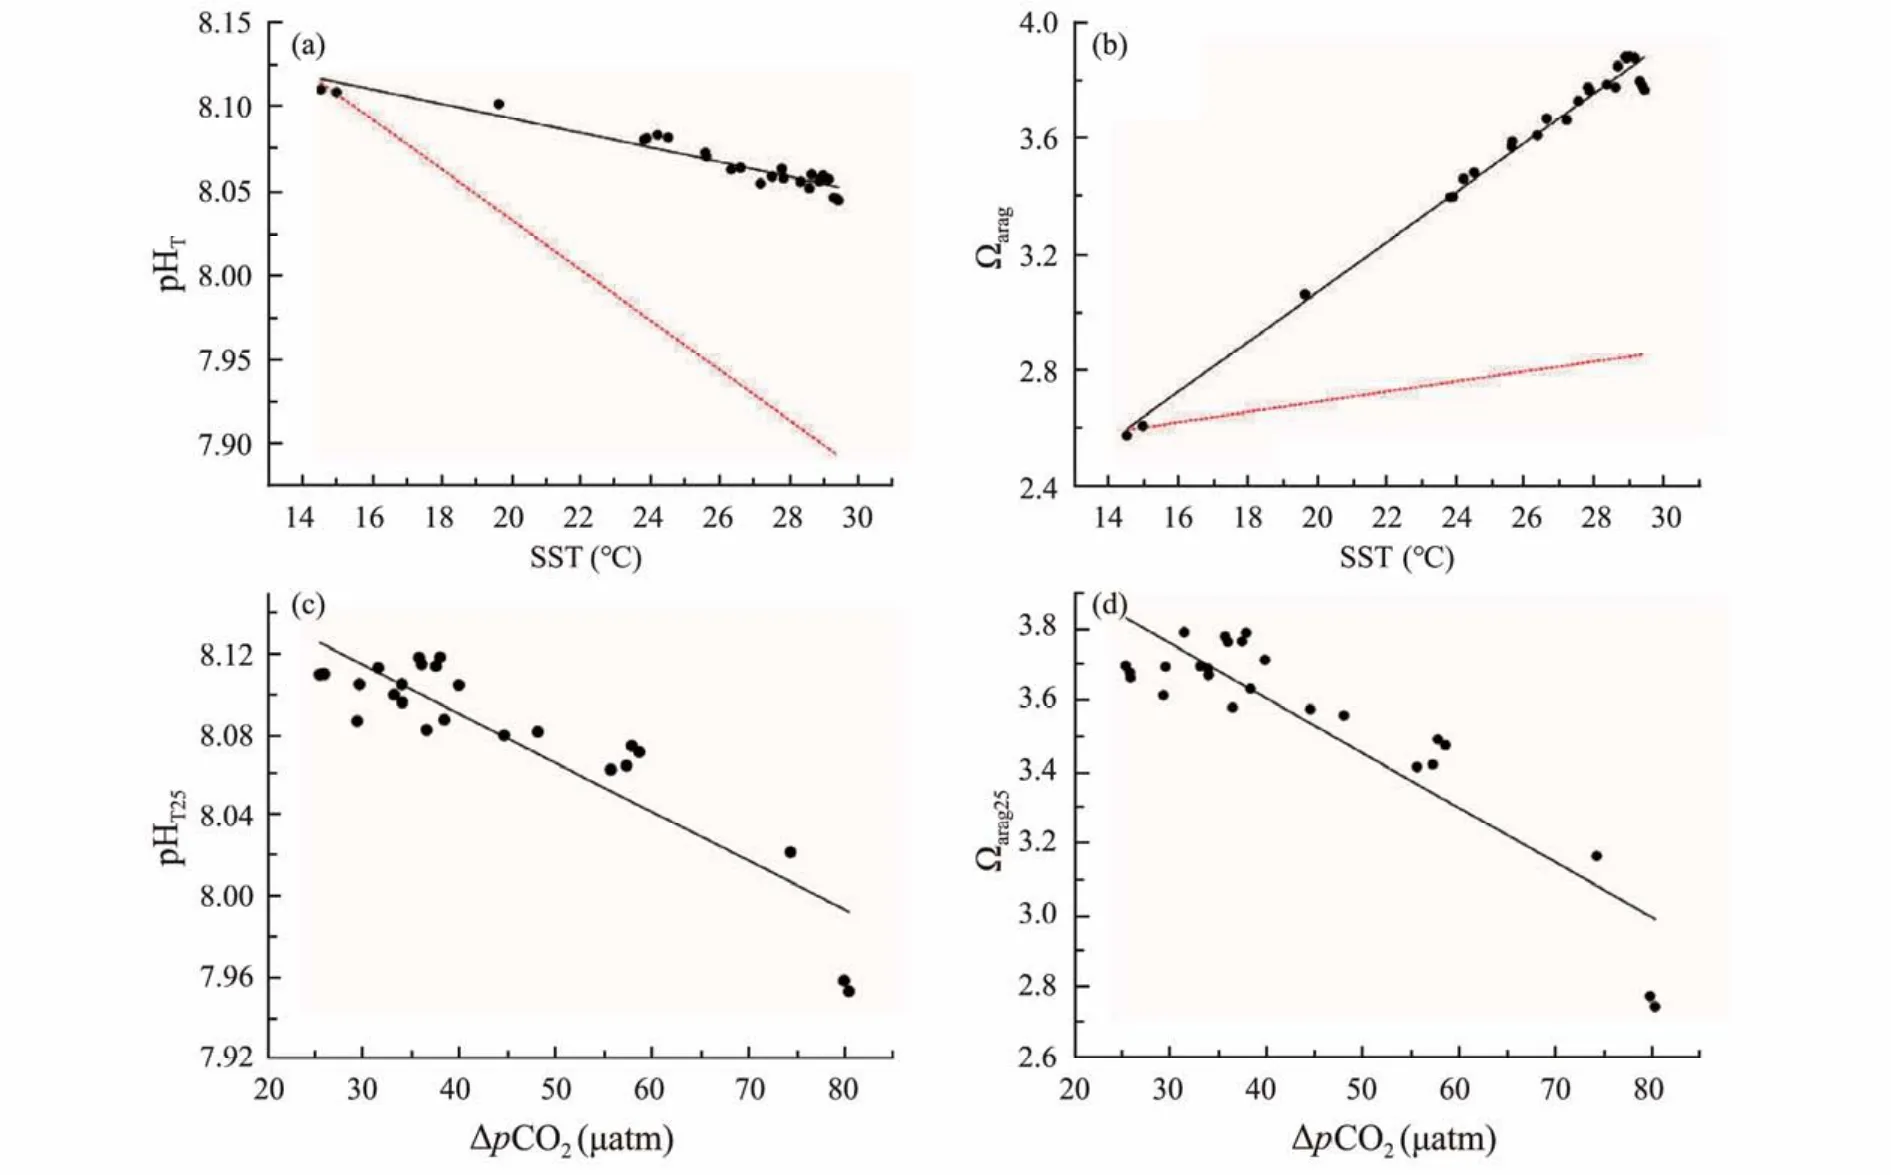
Fig.5 Relationships between pHT and sea surface temperature (a), Ωarag and sea surface temperature (b), pHT, 25 and ΔpCO2(c), Ωarag, 25 and ΔpCO2 (d). Red dashed line in (a)and (b)represents the internal temperature effect (calculated at constant S=33.61, TA = 2244 μmol kg-1 and DIC = 2207 μmol kg-1, based on the data from P1-1 station).
To further understand the impact of the nonthermal components on pH and Ωarag, we examined the correlations of ΔpCO2(ΔpCO2=pCO2,air-pCO2,seawater, and ΔpCO2> 0 along the investigated P1 transect)with pH and Ωarag, which were normalized to the temperature of 25℃(pHT,25and Ωarag,25)to remove the thermal components.As shown in Figs.5c and d, both pHT,25and Ωarag,25are negatively correlated with ΔpCO2(r= -0.90,P< 0.0001 andr= -0.96,P< 0.0001, respectively), which is due to the fact that ΔpCO2to a large extent represents the nonthermal components, while the nonthermal components of both pH and omega are in phase; larger ΔpCO2would result in more CO2being absorbed, which would reduce the pH and Ωaragin the same direction (Xueet al.,2021). Thus, from north to south along the P1 transect,although a decrease in ΔpCO2would increase pH, the effect is outweighed by the impact of temperature increase, resulting in a decrease in pHTfrom high latitude to low latitude, while both an increase in temperature and a decrease in ΔpCO2(main controlling factor)increase the Ωarag.
4.3 pH and Ωarag by the End of This Century
The spatial distribution characteristics of pHTand Ωaragalong the P1 transect at the end of this century under the IPCC RCP 6.0 projection were similar to the present(Figs.6a and b). pHT2100was in the range of 7.769 – 7.748,slightly decreasing with the decrease of latitude. Ωarag2100increased with decreasing latitude, ranging from 1.40 to 2.40. Both pHTand Ωaragshowed large declines compared with the present (Figs.6c and d). The declines in pHTand Ωaragranged from -0.343 to -0.296 and -1.17 to -1.50,respectively, in response to the temperature rise and the accumulation of atmospheric CO2concentration as projected. The decline in pH is consistent with the modeling study by Jianget al. (2019), showing that the global average surface seawater pHTdecreased by about 0.33 ±0.04 units from 2000 to 2100 under the RCP8.5 ‘business-as-usual’ scenario. As discussed above, two effects of temperature mainly cancel out for pH, whereas they reinforce each other for Ωarag(i.e., Ωaragwould increase with temperature increase). Therefore, the rise of temperature by the end of this century contributes little to the decline in pH and Ωarag, but rather the accumulation of the atmospheric CO2, which leads to a continuous increase in atmosphericpCO2, forcing more atmospheric CO2into seawater through the sea-air exchange, resulting in an increase in H+and a decrease in CO32-, thus leading to the decrease of both pH and Ωarag.
The decline in pHTfrom the present to the year of 2100(ΔpHT)decreased with decreasing latitude; ΔpHTwas larger at high latitudes than that at low latitudes along the P1 transect (Fig.6c), which is closely related to the distribution of RF. RF is a good indicator of ocean buffer capacity; the higher its value is, the weaker the buffer capacity of seawater will be, and the greater the pH change will be, resulting in a smaller latitudinal difference in pH along the P1 transect. The decline in pHTis consistent with the result obtained by Jianget al. (2019)that the pH of global ocean surface water would gradually become homogenous with time. The decline in Ωaragfrom the present to the year of 2100 showed a different latitudinal distribution pattern, which was slow in the northern end stations (i.e., the Subarctic Current dominant region),and relatively uniform and fast at low latitudes (Fig.6d).This is consistent with the findings of Feelyet al. (2018)that the decreasing rate of Ωaragis faster in warm and high Ωaragwaters. In a word, the decline in pH and Ωaragover time can vary differently in cold high latitudevs. warm low latitude waters, which is consistent with the findings from the American ocean margins (Caiet al., 2020).

Fig.6 Distributions of pHT (a), Ωarag (b)along 150˚E transect at the end of this century and the decline in pHT (ΔpHT)(c)and Ωarag (ΔΩarag)(d)from the present to the year of 2100 ΔpHT.
5 Conclusions
The distribution patterns of carbonate chemistry along the 150˚E from 40˚N to 13˚N and their controlling factors were investigated in November 2019. The Subarctic Current at the northern ends caused abnormally low temperatures and salinities of the surface seawater, and high values of nDIC and nTA. DIC and Revell factor decreased with the decrease of latitude, whilepCO2increased with the decrease of latitude but all were below atmosphericpCO2level, resulting in a decrease in ΔpCO2from north to south. The distributions of pHTand Ωaragwere out of phase; from north to south, pHTwas more controlled by the thermal components resulting in a decrease in pHTwhile the increase of temperature and the decrease of ΔpCO2both increased the Ωarag. In addition,pHTand Ωaragalong 150˚E at the end of this century were predicted to decrease but at different decline rates, with larger declines in higher pHTand Ωaragregions, suggesting that meridional gradients of pHTand Ωaragwould become homogenous with time in future.
Acknowledgements
This study was supported by the Key Research and Development Program of Shandong Province (No. 2020 ZLYS04), the National Key Research and Development Program of China (No. 2017YFA0604300), the Qingdao Pilot National Laboratory for Marine Science and Technology (No. 2018SDKJ0105-1), the Fundamental Research Funds for the Central Universities (No. 202072 001), and the Young Scholars Program of Shandong University (No. 2018WLJH43). We wish to thank crew members of theR/V‘Dongfanghong 3’ for their help during the investigation.
杂志排行
Journal of Ocean University of China的其它文章
- Comparison of Flavor Substances in Dried Shrimp Products Processed by Litopenaeus Vannamei from Two Aquaculture Patterns
- Identifying Summer/Autumn Habitat Hotspots of Jumbo Flying Squid (Dosidicus gigas)off Chile
- Allelopathic Interactions Between the Tropical Macrophyte Enhalus acoroides and Epibenthic HAB Dinoflagellate Prorocentrum concavum
- Removal of Arsenic from Chlamys farreri with Different Methods
- Optimal Culture Capacity of White Shrimp (Litopenaeus vannamei)and Razor Clam (Sinonovacula constricta)in a New Series-Connection Culture Model
- Identification of Non-Coding RNAs Based on Alignment-Free Features in Crassostrea gigas (Pacific Oyster)Transcriptome