Geoelectrical survey over perched aquifers in the northern part of Upper Sakarya River Basin,Türkiye
2022-12-21CanErtekinEminUlugergerli
Can Ertekin,Emin U Ulugergerli
1 Aegean Regional Directorate of Mineral Research and Exploration,İzmir,Türkiye.
2 Çanakkale Onsekiz Mart University,Department of Geological Engineering,Terzioğlu Campus,Çanakkale,Türkiye.
3 Çanakkale Onsekiz Mart University,Engineering Faculty,Department of Geophysical Engineering,Terzioğlu Campus,Çanakkale,Türkiye.
Abstract: In this study,a groundwater exploration survey was conducted using the DC Resistivity (DCR)method in a hydrogeological setting containing a perched aquifer.DCR data were gathered and an electrical tomography section was recovered using conventional four-electrode instruments with a Schlumberger array and a two-dimensional (2D) inversion scheme.The proposed scheme was tested over a synthetic threedimensional (3D) subsurface model before deploying it in a field situation.The proposed method indicated that gathering data with simple four-electrode instruments at stations along a line and 2D inversion of datasets at multiple stations can recover depth intervals of the studied aquifer in the hydrogeological setting even if it has a 3D structure.In this study,2D inversion of parallel profiles formed a pseudo-3D volume of the subsurface resistivity structures and mapped out multiple resistive (>25 ohm·m) bodies at shallow(between 50-100 m) and deep sections (>150 m).In general,the proposed method is convenient to encounter geological units that have limited vertical and spatial extensions in any direction and presents resistivity contrast from groundwater-bearing geologic materials.
Keywords: Groundwater;Perched Aquifer;DC Resistivity;Inversion;Sakarya River;Türkiye
Introduction
Groundwater exploration,in the simplest terms,includes two main parts: a) investigating and mapping groundwater-bearing depths in a geological setting,and b) pumping out water at a flow rate that should not deplete the aquifer(s) and monitoring groundwater levels and quality for exploitation of aquifer(s).
The former requires novel approaches to solve the problem in such a way that includes sensing subsurface properties without invading them (Fitts,2013).Technological developments such as advanced instruments can record very accurate data acquisition with a century-old Schlumberger array(Werkema et al.1998).Processing techniques using multi-dimensional modelling software can evaluatein situdata sets along with a profile or array to obtain an image of strata geometry and its spatial heterogeneity of the (hydro) geological setting of interest (Loke and Barker,1996a and 1996b).This is defined as aquifer characterization(Maliva,2016).Although aquifer characterization is required in almost all phases of groundwater studies such as evaluating hydraulic properties,groundwater flow and transport modelling practice as defined by Maliva (2016),it is only a sub-stage of groundwater exploration studies.It does not encompass the complete and necessary workflow for a groundwater site study,which must also include geophysical data acquisition and processing techniques using image outputs to help broadly evaluate cross-sectional or three dimensional conceptual models of the hydrogeological setting of interest.
The second main part of groundwater exploration requires probing the subsurface to explore the actual distribution of the hydrogeological conditions by using holes and to ascertain where to install wells,piezometers and monitoring devices(Fitts,2013).By pumping out groundwater,the water supply is assessed,but pumping out more than aquifer replenishment causes decreasing groundwater levels and even leads to dry up of wells (USGS,2021).Under this condition,land owners have to either deepen their wells or drill new ones at new locations.Groundwater demand without a safe yield,meaning the water withdrawal rate is less than the replenishment from the aquifer(Lee,1915),can result in problems such as deterioration of water quality and increased pumping(USGS,2021) and well construction costs.
In this study,a groundwater exploration survey was conducted using the DC Resistivity (DCR)method over a hydrogeological setting that contains a local perched aquifer exploited without a safe yield.Through this work,the possibility of producing a three dimensional (3D) structure of the perched aquifer with two dimensional (2D) data was also explored by gathering field data using low-cost instruments.Both a conceptual model and a set of field data were used over the perched aquifer.Pseudo imaging of the 3D structure,representing the perched aquifer,is possible only with a joint 2D inversion of the multiple DCR measurements.Independent,namely one dimensional (1D),inversion fails to produce realistic results.
1 Geological and hydrogeological settings of the study site
The geophysical survey site or the survey site was in the northern part of Mahmudiye county of Eskişehir city in Türkiye within the Şerefiye and Topkaya villages (Fig.1).The study site covering the survey site map consisted of a SRTM digital elevation model (EARTHDATA,2021) and a surface geology map (Akbaş et al.2011;Emre et al.2013,Emre et al.2018;GMVDE,2016).The map was geo-referenced in UTM projection zone 36 of the Northern Hemisphere (30° E-36° E) based on WGS 84 Datum.The site lied from 3434568.4°to 3460371.5° easting and from 4803897.9° to 4820306.1° northing directions (Fig.1).
The exposed rocks at the study site are from the regional metamorphic rocks of the Anatolid-Tauride Block and the ophiolitic rocks of the İzmir-Ankara Zone (Fig.1).The two basement rock associations are unconformably overlain by clastic deposits intercalated with tuff.Granitoid intrudes in the rocks exposed at the site.More detailed information on the two tectonic entities introduced above can be found in Okay and Tüysüz (1999)and Okay (2011).
One of the oldest rocks exposed at the southernmost part of the site is Cretaceous aged marble(Mzi in Fig.1) which is known locally as İnönü marble and is a member of the Anatolid-Tauride Block group.The other member of the Anatolid-Tauride Block is Triassic aged Sivrihisar metamorphics represented by the Sarıkavak formation (Mzs in Fig.1) and its marble member (Mzsm in Fig.1).They are outcropped at the northern part of the study site.The İzmir-Ankara Zone is represented with Jurassic-Cretaceous aged Dağküplü Peridotite (JKdp in Fig.1) at the northernmost part of the site and Dağküplü mélange (Kdm in Fig.1)at the easternmost part of the site (Kanar and Kandemir,2018).The regional metamorphic and ophiolitic rocks prevail in the basement rocks around the site and are overlain by sedimentary rocks unconformably.
The sedimentary rocks outcropped at the site comprise clastic deposits between the Miocene-Pliocene epochs and extend in all geographic directions at the site.They are conglomerate-sandstone and claystone-marn-tuff members of the Porsuk formation (Kanar and Kandemir,2018).The conglomerate-sandstone member (Tmplp1 in Fig.1) is made of polygenetic conglomerates,sandstones with partial claystone and siltstone.It is transitive laterally-vertically with lacustrine deposits of the claystone-marn-tuff member (Tmplp2 in Fig.1).The inner stratigraphy of Tmplp2 is represented with limestone levels which overlie detrital material conformably and with tuff levels intercalated to claystone-marn.Topkaya granitoid in the northern part of the site (Tet in Fig.1) cuts the basement rock outcrop (Kanar and Kandemir,2018).The unconsolidated sedimentary material(Qal in Fig.1) includes gravel,clay,and silt.The fluvial material (alluvium) also forms the largely flat terrain known as Eskişehir plain (Kanar and Kandemir,2018).
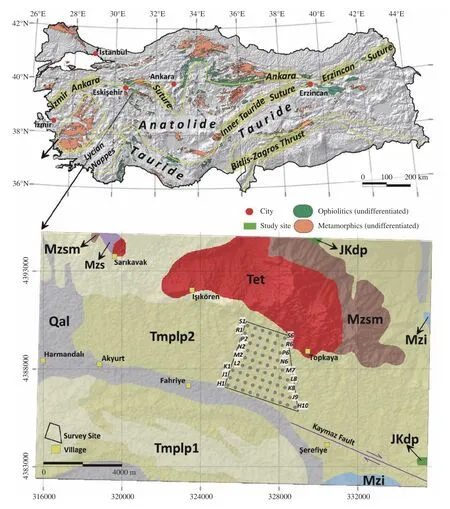
Fig.1 The global location and Tectono-stratigraphic terranes of Anatolia (Türkiye) and the surface geology of the study site and the survey site (the geophysical survey site) with the arrangement of VES stations (gray dots in the survey site) (compiled from MTA (1964),SRTM Elevation Data of 1 arc-second from EARTHDATA (2021)and Zürcher et al.(2010)
The hydrogeologic setting was scaled to the study site conditions and Upper Sakarya River Basin (Yukarı Sakarya Havzası in Turkish) according to the International Hydrogeologic Map of Europe,E6,Ankara sheet (IHME,2021).The study site occurs at the northern part of the river basin(Fig.2).The basement rocks (Mzs,Mzsm,Tet,JKdp,Kdm),except for İnönü marble (Mzi),are classified as “ no groundwater resources worth mentioning even at depth” in the IHME (2021)(Fig.3).These rocks are likely an aquiclude or aquifuge.İnönü marble (Mzi) crops out in the northeastern and southern sides of the site.According to its location,it is likely a part of the aquifer at the southern side and a part of aquifuge at the northeastern side,because the lithological contact of Mzi with the claystone-marn-tuff member (Tmplp2) can yield local groundwater (Fig.3).That is the probable reason that Tmplp2 is classified as“ local groundwater occurrence (in porous or fissured rocks)” in the IHME (2021).This phrase means groundwater flows along porous and fractures of the rocks.A significant exposed part of Tmplp2 is also classified as “local or discontinuous productive aquifers” in the IHME (2021)(Fig.3).This is related to the inner stratigraphy of Tmplp2 that includes limestone levels which are overlain by detrital (claystone-marl) material.The conglomerate-sandstone member (Tmplp1) and the unconsolidated sedimentary material (Qal) correspond to “local or discontinuous productive aquifers” in the IHME (2021) (Fig.3).The northern part of Tmplp1 is partly overlapped with “local groundwater occurrence (in porous or fissured rocks)” due to the partial claystone and siltstone occurrence (Fig.3).Tmplp1 and Qal were selected for well sites due to their aquifer conditions close to the survey site.

Fig.2 The regional hydrogeology map of Türkiye compiled from IHME (2021) and the hydrogeology map of the Upper Sakarya River Basin compiled from IHME (2021) and Esen (1978)
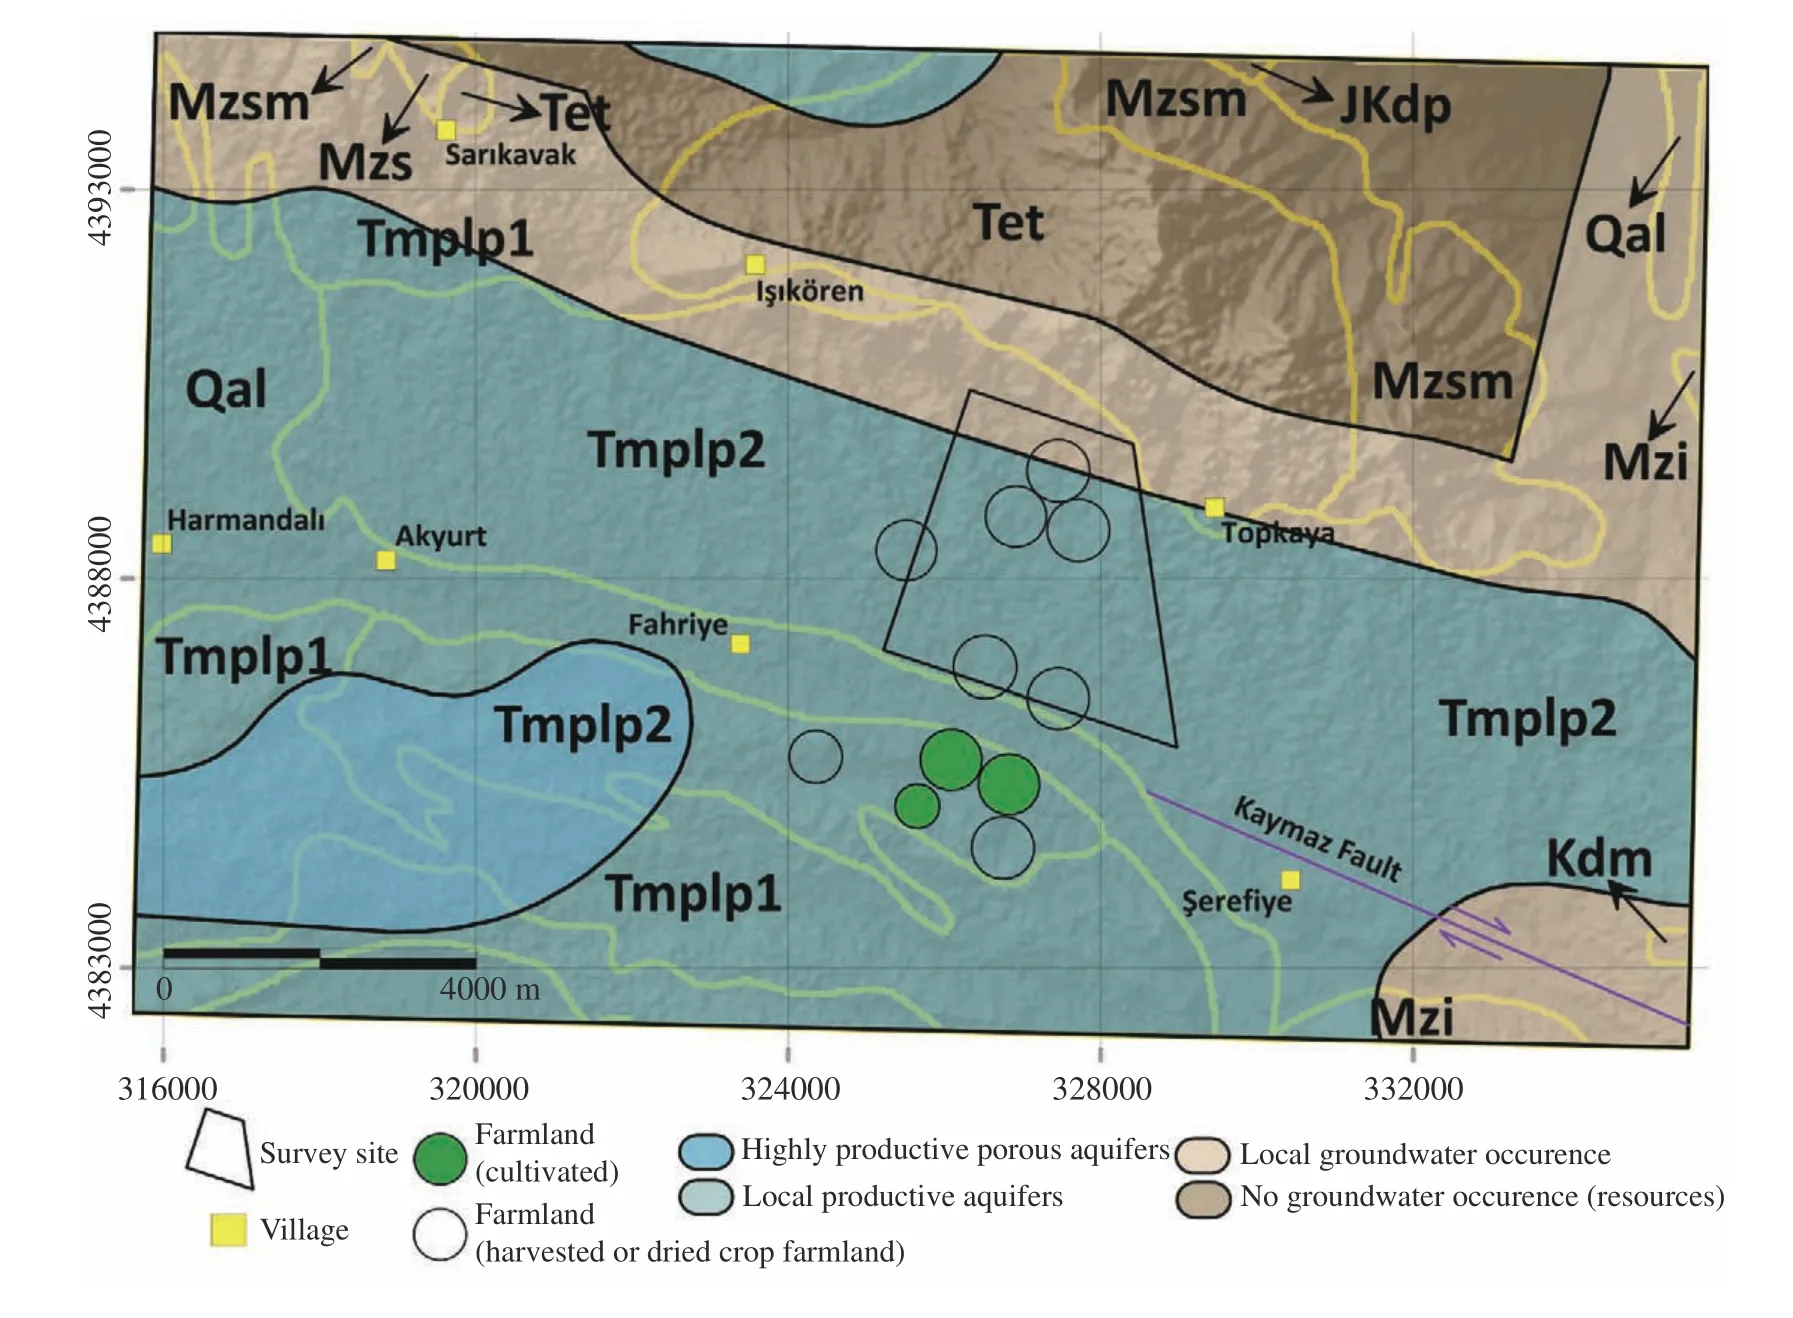
Fig.3 The hydrogeology map of the study site (the geophysical survey site) compiled from Akbaş et al.(2011),Emre et al.(2013,2018) and IHME (2021)
The wells close to the survey site are given in Fig.2 and Fig.4.The hydraulic test data of these wells are also outlined in Table 1.At the eastern and southern sides,there were five wells drilled by General Directorate of State Hydraulic Works(Devlet Su İleri - DSİ in Turkish).At the northern side,the six wells were constructed for agricultural use by the General Directorate of Agricultural Plants (Tarım İşletmeleri Genel Müdürlüğü-TİGEM in Turkish).The depths and pumping rates of TİGEM wells vary from 150 m to 161 m and 6 lt/sec to 53 lt/sec,respectively.Both TİGEM(2012)①TİGEM 2012.Anadolu Tarım İşletmesi Hidrojeolojik ve Jeofizik Etüt Raporu (in Turkish),73.and DSI Data Archive (the data obtained by personal communication) revealed that the wells were drilled up to 200 m through Tmplp1 and Tmplp2 and the conglomerate level(s) of Tmplp1 is considered an aquifer.As pointed out by the IHME (2021),Esen (1978) and TİGEM (2012),alluvium (Qal) and conglomerate level(s) of Tmplp1 are aquifereous units.The groundwater level map in meters above Mean sea level (MSL) was contoured using Minimum Curvature (Briggs,1974)and is given in Fig.4.After different gridding methods were tested using Surfer™ from Golden Software (Surfer,2020),the best fit for the groundwater level data was achieved and plotted for the measured (groundwater level) data (calculated from groundwater depth data in Table 1) vs.the estimated values in Fig.4.This gridding method,when attempted at implementing to the data of interest,produced smooth surfaces using the data of interest.The groundwater level map indicated that the two groundwater flows move in the two main directions (NE to SE and SW to W) which are separated by a groundwater divide extending almost parallel to Sakarya River (Fig.4).

Table 1 The wells with their hydraulic test data close to the survey site

Fig.4 The groundwater level map in meters above mean sea level (MSL) close to the survey site (the geophysical survey site) and the two main groundwater flow directions are visible and separated with the groundwater divide
2 Methodology and data
The DCR method together with multidimensionalmodelling was used in this investigation.In this method,conventional four-electrode instruments were used to gather the DCR data with the Schlumberger array and then the dataset was evaluated with the 2D inversion scheme to obtain an electrical resistivity tomography (ERT) section for realistic interpretation.Therefore,our approach and results differ from previous publications (e.g.Olorunfemi and Fasuyi,1993,Shaaban,2001;Saad et al.2012,Boubaya,2017;Araffa et al.2019)
The DCR data were acquired over the ground surface by injecting current from two electrodes,namelyAandB,and measuring voltage potential and ΔVfrom the other two electrodes (MandN)(Fig.5).The current and the potential drop values recorded at each survey point for eachABexpansion along the profiles were converted to apparent resistivities:

Fig.5 A sample DCRM survey setting for VES points along a profile

Where:kis a geometric factor and obtained from the intervals of all electrodes.ρareflects both subsurface resistivity distribution and also the effect of the electrode positions,providing a distorted smooth image of the subsurface.Thus,the evaluation of pseudo sections obtained from the apparent resistivities is misleading in a complex geological setting.
Hence,these sets of apparent resistivities were translated into images of rock material (mapped and given in geological formations or members to stratigraphical nomenclature in Fig.1) with true resistivities through inversion (Meju,1994).Note that presence of lateral continuity in geological units leads to a layered or 1D earth model and,in turn,the utilization of the 1D inversion scheme(Vedanti et al.2005,Ekinci and Demirci,2008).On the other hand,imaging lateral discontinuities of geological units requires at least a 2D earth model (Rijo et al.1977;Özurlan et al.2006).The 2D inversion scheme,chosen for the current study,required all stations to align along a profile and to be spatially dense enough (Ulugergerli,2017).Then an efficient and accurate 2D image of deep geo-electrical structures beneath the profile could be recovered.Regardless of the resistivity variation in a model,an equation for nonlinear and ill-posed inversion problem is given as (Menke,1989;Meju,1994):

Where: The aim is to estimate a logarithmic update vector,Δp,for initial model parameters,p,which can be either conductivity or resistivity or a function of each.In this study,the logarithm of conductivity was used.Jis a matrix consisting of partial derivatives,F,and smoothing matrices,C:

Where:wis a scaling value.Cprevents the recovery of high contrast between adjacent parameters,and is given as:

For 1D caseCin Equation (4) set:

βis a damping factor and up to ten different values are used in each iteration.Finally,the observed data appear only in ΔD,a vector of logarithmic discrepancies between observed (ρoa) and calculated (ρca) apparent resistivity,and is given as:

Where: 0 is augmented due to Eq.4.Estimated update vector,Δp,at iteration,k,is added to the initial model parameters,p:

Arbitrary constantbis set as 0.3 to avoid sudden changes between iterations.The inversion code iterates until the misfit reaches an arbitrarily selected threshold value,1.e-2.The measure of misfit,e,is given as:

The Schlumberger array (Fig.5) was used to gather the observed DCR data (ρoa).The maximum expansion of the current electrodes in each array,i.e.the distances between A and B electrodes,defined the depth of the investigations.In practice,DCR data recorded at a point with various AB expansion is called vertical electrical sounding(VES).Following the convention,the range of AB/2 rather than AB itself is used in the rest of the text.In reality,the depth of investigations is a function of not only AB/2 but also the geo-electrical setting.Hence,it can only be found within modelling studies (Oldenburg and Li,1999).For unknown geo-electrical settings,an empirical relation between max AB/2 and the depth of investigation (z) is given as (Roy and Apparao,1971;Szalai et al.2009):

Note that this approximation does not warrant getting the information down to such depth if the geology setting is complex,but serves as a good reference point to design the survey.On the other hand,the interval of the potential electrodes M and N started with a length as small as possible,i.e.a quarter of the min (AB/2),then increased wherever the potential drop between M and N electrodes was lower than the recording capability of the instruments.Although 1D inversion programs do not utilize the MN interval,it has to be very small.On the other hand,2D programs need this value and the interval does not have to be so small.Fig.5 depicts a sample DCRM survey.Each VES expansion is in line with the profile line.AB expansions can be different but the interval of VES stations must be shorter than the max (AB/2) of adjacent VES stations.
3 Processing and interpretation
The targeted conceptual model consisted of the water-bearing sandstone layers in clay-rich sediments of Tmplp2 (Fig.1 for the VES arrangement).For geophysical exploration,this target had limited extension in any direction and presented physical contrast from its host unit.Such targets are not preferred but merely a result of the local geological condition that occurs in many regions.Similar structural setting can be found in the literature (Meju,2002;Sasaki and Meju,2006) and proposed solution can easily be extended to other structural settings.The sandstone layers may have provided water but not in a favourable manner since the spatial extensions of them did not provide a good aquifer in terms of continuous saturated lenses.The resistivity of clay or clay-rich host is noticeably low (Palacky,1987;Telford et al.1990)and extends on a regional scale.On the other hand,sandstone layers with freshwater present relatively high resistivity.This resistivity contrast makes the resistivity methods of geophysics applicable to such exploration problems.Considering the cost of the instruments,the direct current resistivity method (DCRM) was used in this study,which is one of the most common and oldest (employed since the 1930s) tools used to explore water-bearing layers(Fretwell and Stewart,1981).Being a pioneer,Swartz (1937and 1939) used the DCRM to locate freshwater lenses in salt-water bodies on the Hawaiian Islands utilizing the resistivity contrast,and it has been in use ever since (Zhdanov and Keller,1994;Bhattacharya and Shalivahan,2016).
In general,geological units found in any geological environment require both lateral and vertical variations to be mapped.Such mapping requires a 2D or 3D data gathering scheme and their evaluation.Unfortunately,regardless of the form of target or the adequacy of the 1D assumptions for the subsurface geological setting,1D data gathering schemes are usually the norm in practice(Nwankwo,2011).The 2D evaluation of data sets gathered over 3D environments requires sufficient spatial coverage.Such approach may produce false anomalies due to the projection of off-profile objects onto the 2D results (Yang and Lagmanson,2006).This can cause serious problem if the 2D profiles are sparse.On the other hand,3D representation of spatially dense and parallel 2D profiles still produce acceptable resolution owing to the fact that the effect of off-profile structure will diminish with distance.With the help of the topnotch multi-electrode instruments ERT studies have become standard for shallow depth targets(<100 m) but the cost of the instruments is still prohibitive in developing countries.On the other hand,conventional four-electrode instruments are widely available and can even be manufactured in individual laboratories (Awotoye and Selemo,2006;Clark and Page,2011,Igboama and Ugwu,2011,Mikailu et al.2015;Florsch and Muhlach,2017).Once the DCR data have been gathered via any available instruments,the evaluation stage is considerably easy since open-source codes for multidimensional models are available via software hosting websites (e.g.URL1,2019②URL1 2019.https://github.com/fatiando (AD 19.11.2019);URL2,2019③URL2 2019.https://github.com/gimli-org/gimli (AD 19.11.2019)).
In the following sections,the study area and problem are outlined,and the approach is tested with a synthetic model.Then,the evaluation strategy is outlined.The well usage and the site situation are described in the results and discussion section and the conclusion sections.
3.1 Synthetic test
The hypothetical model consisted of a prism (1 000 m × 100 m × 100 m) buried 50 m deep inside a homogenous half space (Fig.6a).The prism represented the resistive (500 ohm·m) aquiferous unit (e.g.limestone layer) while the host was a relatively conductive (5 ohm·m) impermeable unit (e.g.clay).Our hypothetical survey line was near the end of the prism (solid line in Fig.6a).Four VES stations were located over the prism at slightly asymmetric locations with 300 m intervals.AB/2 expansions were from 3 m to 700 m.The apparent resistivities were calculated from this 3D model and used as input to the 2D inversion program.Note that our aim was not to elaborate on the solution power of the inversion scheme.Thus,we employed a test model as simple and small as possible.The findings can be outlined as follows.The initial model set 5 ohm·m.The misfit decreased from 0.209 76 to 0.010 448 after 23 iterations.
The 2D inversion with a spatially sparse and limited number of stations still recovered the structural information (Fig.6b).While the asymmetric position of the prism was well-represented between the second and third stations,the vertical location of the recovered structure was slightly shallower than the prism.Nevertheless the resistivity of the prism was much lower (~10 ohm·m) than what it should have been.As expected,a finite length structure could be recovered with the 2D inversion of independent DCR data sets only if all the stations were measured along the same survey line,expansions of current electrodes overlapped each other and the target unit caused an anomaly on apparent resistivities.In addition to resistivity contrast,the length of the prism also affected the observable apparent resistivities.A strike that is shorter than 500 m produced less than 5% deviation from the background (5 ohm·m) while any length longer than maximum AB/2 up to infinite strike caused a significant anomaly (~20%).2D inversion scheme assumes the strike is infinite;thus the location of the single survey line over a finite length structure may not have been adequate to image the structure.When the survey line was located off the front face of the strike,i.e.not cross over the prism (dashed lines in Fig.6a),the apparent resistivities did not deviate from the background value significantly.In other words,measurements could not sense the strike.This can be used to limit the survey area.As a result,2D inversion of the parallel survey lines both over and off the target structure can produce a pseudo 3D image of the subsurface.
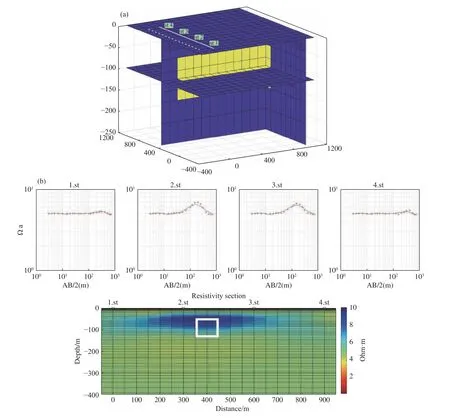
Fig.6 a) Synthetic model with finite length prism.Solid line profile for observable data.See text for dashed lines.b) 2D inversion result of synthetic data.The white box is the location of the prism
3.2 Field test
The target depth was approximately down to 150 m;thus AB/2 range was increased logarithmically from 5 m to 600 m and beyond at each survey point.Keeping the station intervals less than Max(AB/2) (600 m),a grid of 400 m × 400 m cells covering the survey area and defining the survey points was initially planned.However in practice,the intervals varied from 350 m to 450 m due to the accessibility of the sites.At each survey point,the data was gathered with an expansion approximately in the NW direction only.Hence,5 to 10 aligned survey points (Table 2) with expansions,formed nine parallel profiles extending in the NWSE direction (Fig.1).The profiles extended perpendicular to the slope to reduce the topographic effect and only the altitude variations that existed along the profiles were used in the 2D inversion code.Note that the average altitude difference between the first and the last profile was 110 m.

Table 2 Profile names,distance between first and last station and number of stations
Evaluation of the data started with 1D Occam’s inversion (Constable et al.1987) in order to show the difference between the dimensional assumptions.For each VES data,26 fixed-thickness thin layers were used.A smooth variation and blurred image of the layered earth model was expected,if any.The left plot in Fig.7 presents observed (obs.)and calculated (calc.) apparent resistivities while the right plot shows the result of the layered earth model (1D model) inversion together with simple depth transformation (App.res) similar to the Bostick-Niblett depth transformation used in magnetotellurics data analysis (Jones,1983).Transformed depth,d,and transformed apparent resistivity,ρd,are given below:
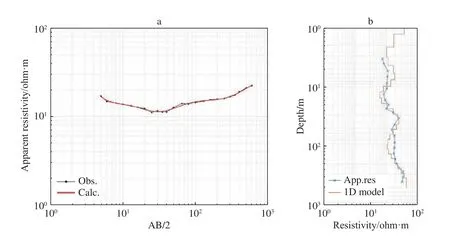
Fig.7 1D inversion result of VES at PP6

and

Where: sc is an arbitrary scale factor set to 3.This transformation is merely used to compare the result of 1D inversion and the effective depth range of the AB expansion.
All the results of 1D Occam’s inversion along a profile P and all fifth stations may form pseudo 2D images of the subsurface (Fig.8).Note that this presentation is usually misleading since it is not an appropriate way to image lateral variations.Therefore,it should not be utilized to locate fault zones or trace the continuity in geological units in either lateral or vertical directions.Fig.8 indicates that recovered resistivity were below 50 ohm·m in the entire survey site.The 1D inversion results complied with the clay-rich regional geology.Lateral variation exists in the area;thus,2D inversion was required to locate the features to be used in realistic evaluation.

Fig.8 a) Stitched presentation of 1D Occam’s inversion result along the 5th station for each profile.b) Stitched presentation of 1D Occam’s inversion result along the Profile P
In order to obtain 2D inversion results the data sets in each profile were inverted using the scheme given in Ulugergerli (2017) and the recovered geoelectrical models are given in Fig.9.Upper plots are observed (marker) and calculated (solid) apparent resistivity curves while the lower panel is the 2D resistivity section.The triangles are the locations of the stations.The vertical axis is the depth in meters while the horizontal axis is the distance(m) from the first station.
The initial model of each profile was a homogeneous half-space with an average value of the apparent resistivities of the profile.The inversion process was performed with a maximum of 100 iterations and the threshold value for misfit was set to 0.001 after the trial-and-error procedure.The final misfit values for pH to PS were between 0.02 and 0.2 (Table 3).The fit between the observed and calculated data was good enough to accept that the recovered models were sufficiently converged,justifying further evaluations.

Table 3 Variation of misfit values in 2D inversion
The general features of final geo-electrical models obtained from 2D inversion and proposed geological evaluations were as follows: The recovered resistivities for the sections vary 5-50 ohm·m and covered the entire sections above ~300 m depth.This depth doubles the empirical estimation (150 m).The top unit (0-10 m) was an alluvial zone.Then a conductive (<15 ohm·m) clay unit occurred between 10 m and 300 m.The conductive unit contained shallow resistive blocks (>25 ohm·m)that represent sandstone layers in Tmplp2 (a perched aquifer).Deeper units (>200 m) were likely intercalated limestone materials (a perched aquifer)of Tmplp2 or intercalated conglomerate levels of Tmplp1,because the two members of Porsuk formation are laterally transitive in the stratigraphic order (Kanar and Kandemir,2018).The perched aquifer conditions were supported by the geophysical images during VES stations (Fig.9) depicting unconnected unit setting of the subsurface down to a 200 m depth.Note that Tmplp1 and Tmplp2 are defined by IHME (2021) as locally productive aquifers (Fig.3).
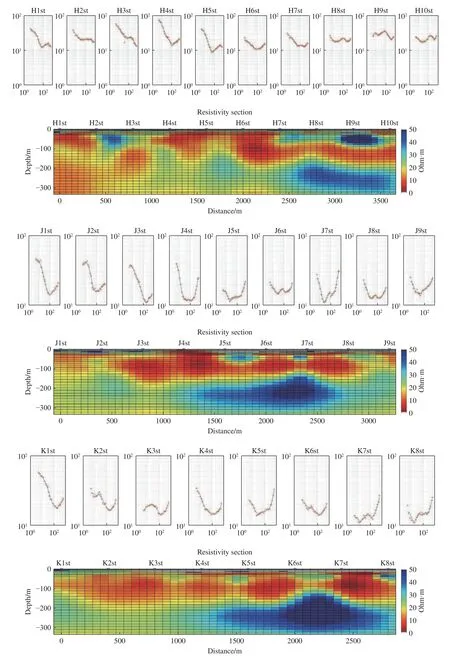

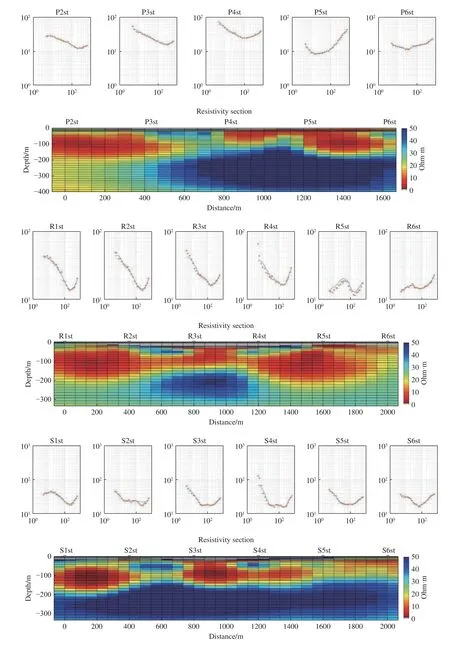
Fig.9 The 2D sections are the recovered resistivity vs.depth beneath each profile
4 Results and discussions
In the DCR method,the empirical depth of the investigation formula indicates that an interval of over 800 m between A and B current electrodes isrequired to explore such depth ranges.However,the electrodes can be embedded in any geological setting along the survey line.The benefits of spatially dense and in line VES data sets are that the researcher can both check the consistency of data sets and also obtain the ERT section.The consistency is important when one of the current electrodes crosses a fault line.There is no way to locate the fault with stand-alone VES data.Moreover,1D inversion will recover a fictitious layer due to diffraction caused by lateral discontinuity,i.e.a fault zone.This is also the case for off-profile structures(Ulugergerli,2017).Large expansion of AB electrodes (>800 m) makes multi-electrode applications with multi-core cables extremely cumbersome;therefore,relatively cheap four-electrode instruments are still the best option for deep targets.The interval of the VES stations should be less than max (AB/2).The VES data sets can then be gathered along a profile using a simple four-electrode instrument.
In this study,2D inversion of the DCR data mapped out multiple resistive (>25 ohm·m) bodies at shallow (between 50-100 m) and deeper sections (>200 m).The survey design also allowed exploring the layering of sandstone-claystone levels in Tmplp2.The sandstone layers are aquifer mediums inside the impermeable clay as long as there is a recharging web between the layers.Therefore,the next quest is to map any existing network between pockets.The level map at 75 m presents possible channels between the layers (20-25 ohm·m).The topography differences between the profiles vary from 10 m to 20 m and are included in the graph.Over PN,it was proposed to install two wells down to 200 meters (blue zone in Fig.10).Before reaching a depth of 200 meters,an aquifer was encountered with a flow of approximately 40 lt/sec.After excessive pumping (40 lt/sec) for 5 years,the flow decreased drastically and the well had almost dried out by 2017.
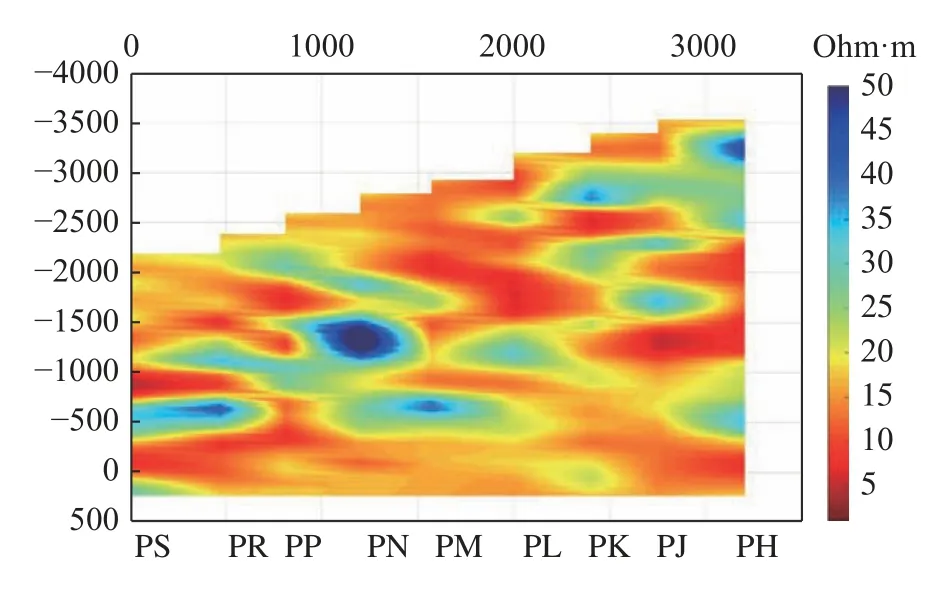
Fig.10 Level map at 75 m from all profiles
For the wells in the vicinity of the surveyed area,replenishment conditions are essential for long term usage.These results indicate that perched aquifers have very limited coverage.The groundwater divide elongation,which is parallel to the Sakarya river bed (Fig.4),reveals that the replenishment conditions of the perched aquifer are only related to surface water availability.In addition,abstracting more than aquifer replenishment can easily shorten the life cycle of the wells.
The proposed approach can easily be applied to different geological settings to map water bearing crack zones in crystalline basements or perched aquifers in alluvial material (for a typical section,Fig.2.15 in Freeze and Cherry,1979).It also provides better images of conventional or large scale regional aquifers and natural resources (Meju,2002).One of the problems that was not highlighted in the frame of this study is the reliability of inversion schemes employed in available source codes.Non-uniqueness of the inversion procedure over complex geology setting can be overcome via multi-physical approaches (Gallardo and Meju,2007) but there is no open source code available to date.
5 Conclusions
(1) VES data sets can be gathered along a profile with low-cost instruments and their 2D inversion over 3D environment produce acceptable resolution.
(2) Contrary to shallow applications,spatially dense and parallel 2D sections can image deeper targets but recovered resistivities will be lower than actual resistivities.
(3) Pseudo 2D sections obtained from stitched 1D inversion results can produce fictitious structures below the measurement point since 1D inversions cannot handle lateral variation.
(4) The general features of final geo-electrical models obtained from 2D inversion and proposed geological evaluations are as follows: The recovered resistivities for the sections vary 5-50 ohm·m and cover the entire sections above ~300 m depth.The conductive unit contains shallow resistive blocks (>25 ohm·m) that represent sandstone layers.Deeper units (>200 m) are probably limestone.
(5) This result indicates that perched aquifers can hold limited amount of groundwater but recharging is crucial.
(6) The proposed approach can be employed to get a better image of subsurface geological setting regardless of the target and can be used for exploration of groundwater and other natural resources.
Acknowledgement
We would like to thank General Directorate of Agricultural Plants (Tarım İşletmeleri Genel Müdürlüğü or TİGEM) for allowing us to publish the data and M.Mıhçı for field assistance.Anonymous reviewers helped us to improve this manuscript.
杂志排行
地下水科学与工程(英文版)的其它文章
- Tracing runoff components in the headwater area of Heihe River by isotopes and hydrochemistry
- Stable chlorine isotopic signatures and fractionation mechanism of groundwater in Anyang,China
- Spatial distribution characteristics and main controlling factors of germanium in soil of northern Dabie Mountains,China
- Identification of groundwater potential in hard rock aquifer systems using Remote Sensing,GIS and Magnetic Survey in Veppanthattai,Perambalur,Tamilnadu
- Effect of groundwater on the ecological water environment of typical inland lakes in the Inner Mongolian Plateau
- Evolution of the freeze-thaw cycles in the source region of the Yellow River under the influence of climate change and its hydrological effects
