Fractionation of soil organic carbon in a calcareous soil after longterm tillage and straw residue management
2022-12-01LlTengtengZHANGJiangzhouZHANGHongyanPeterCHRlSlTEZHANGJunling
Ll Teng-teng ,ZHANG Jiang-zhou, ,ZHANG Hong-yan ,Peter CHRlSlTE ,ZHANG Jun-ling
1 Key Laboratory of Vegetation Restoration and Management of Degraded Ecosystems &CAS Engineering Laboratory for Vegetation Ecosystem Restoration on Islands and Coastal Zones,South China Botanical Garden,Chinese Academy of Sciences(CAS),Guangzhou 510650,P.R.China
2 College of Resources and Environmental Sciences,China Agricultural University/National Academy of Agriculture Green Development/Key Laboratory of Plant-Soil Interactions,Ministry of Education,Beijing 100193,P.R.China
3 College of Resources and Environment/International Magnesium Institute,Fujian Agriculture and Forestry University,Fuzhou 350002,P.R.China
Abstract No-tillage (NT) and straw return (S) collectively affect soil organic carbon (SOC). However,changes in the organic carbon pool have been under-investigated. Here,we assessed the quantity and quality of SOC after 11 years of tillage and straw return on the North China Plain. Concentrations of SOC and its labile fractions (particulate organic carbon(POC),potassium permanganate-oxidizable organic carbon (POXC),microbial biomass carbon (MBC),and dissolved organic carbon (DOC)),components of DOC by fluorescence spectroscopy combined with parallel factor analysis(PARAFAC),and the chemical composition of SOC by 13C NMR (nuclear magnetic resonance) spectroscopy were explored. Treatments comprised conventional tillage (CT) and NT under straw removal (S0),return of wheat straw only(S1),or return of both wheat straw and maize residue (S2). Straw return significantly increased the concentrations and stocks of SOC at 0-20 cm depth,but NT stratified them with enrichment at 0-10 cm and a decrease at 10-20 cm compared to CT,especially under S2. Labile C fractions showed similar patterns of variation to that of SOC,with POC and POXC more sensitive to straw return and the former more sensitive to tillage. Six fluorescence components of DOC were identified,mainly comprising humic-like substances with smaller amounts of fulvic acid-like substances and tryptophan. Straw return significantly decreased the fluorescence index (FI) and autochthonous index (BIX) and increased the humification index (HIX). No-tillage generally increased HIX in topsoil but decreased it and increased the FI and BIX below the topsoil. Relative abudance order of the chemical composition of SOC was: O-alkyl C>alkyl-C>aromatic-C>carbonyl-C. Overall,NT under S2 effectively increased SOC and its labile C forms and DOC humification in topsoil and microbially-derived DOC below the topsoil. Return of both wheat and maize straw was a decisive factor in promoting SOC in the plow layer. The stratification of SOC under NT may confer a long-term influence on carbon sequestration.
Keywords: soil organic carbon,labile C fractions,EEM fluorescence,PARAFAC analysis,13C NMR spectrometry
1.lntroduction
Soils constitute the largest carbon stock in terrestrial ecosystems,storing more than three times as much carbon as the atmosphere or vegetation (Sandermanet al.2017). Globally,arable land stores more than 140 Pg C at a soil depth of 0-30 cm,accounting for nearly 10% of the total global soil organic carbon (SOC)pool (Zomeret al.2017). Increasing the SOC content of arable land is closely linked with food security and mitigation of climate change (Lorenz and Lal 2016),as SOC is the cornerstone of soil health and plays a crucial part in maintaining major soil functions (Lal 2004,2016;Bossioet al.2020). However,anthropogenic disturbance of arable soils results in the loss of SOC and soil degradation. SOC contents are lower in arable soils than in soils under natural vegetation due to land transformation and intensive agriculture (Hassink 1997;Poeplau and Don 2015). For example,25% of SOC has been lost upon conversion from forest/grassland to arable land in North and Northeast China (Zhouet al.2019). Global interest in increasing C sequestration is reinforced by the ‘4 per thousand initiative’ which states that a C sequestration rate of 4‰ (or even higher) can be achieved under best management practices (Minasnyet al.2017;Taoet al.2019).
No-tillage (NT) and straw return (S) are common approaches that are widely recommended to increase SOC sequestration effectively (Lal 2015). Globally,conservation agricultural (CA) land had increased in the area up to 125 million ha by 2012 (Friedrichet al.2012).Up to 2016,CA systems have been widely implemented in China to reach an area of 8 million ha (FAO 2021).A meta-analysis in China shows that NT with crop residues can increase SOC content by 3.9-10.2% and crop yields by 4.6% compared with conventional tillage(CT) without residues (Zhaoet al.2017). The benefits of NT are mainly due to the physical protection of SOC from decomposition by preventing the disintegration,disorganization,and oxidation of soil aggregates (Sixet al.2000;Syswerdaet al.2011),as well as residue retention with lower mineralization by enhancing soil aggregation and reducing microbial activity (Sarkeret al.2018;Kanet al.2020b). By contrast,tillage causes SOC loss at an estimated annual rate of 0.3-1.0 Pg C per year (Chappellet al.2016),especially a rapid C loss from large macroaggregates (Yeet al.2020). However,the efficacy of NT in enhancing SOC is inconsistent,although numerous studies indicate that NT increases C sequestration when NT is compared to CT (Palmet al.2014). For instance,Duet al.(2017a) found that NT only stratified SOC,and the increase in SOC in the topsoil was offset by a simultaneous decline in SOC in the subsoil. Zero tillage without S or mulching resulted in a zero or negligible increase in SOC stock (Powlsonet al.2014;Zhenget al.2014;Niuet al.2019). The variation is attributable to differences in environmental factors(Dimassiet al.2014;Sunet al.2020),organic inputs (Ogleet al.2012),planting systems (Luoet al.2010),nitrogen application (Halvorson and Jantalia 2011),and duration of experiments (Dikgwatlheet al.2014). The conservation tillage effect is more pronounced in regions with relatively warm or arid climates or low fertilizer nitrogen application rates (Baiet al.2019),a situation likely to occur on the North China Plain (NCP). However,detailed investigations of C sequestration and SOC quality are still lacking and this greatly hampers the wide adoption of conservation practices in this region.
Changes in the quality of SOC as affected by tillage and S have been little studied compared with the quantity of SOC (Duet al.2017b). SOC quality has been characterized mainly by labile C fractions and the molecular structure of SOC (Assunçãoet al.2019;Ramírezet al.2020). Labile carbon fractions account for a small but active proportion of SOC (Haynes 2005) and are proposed as early indicators sensitive to management practices and cropping systems (Haynes 2005;Denefet al.2007). Particulate organic carbon (POC),potassium permanganate-oxidizable carbon (POXC),microbial biomass carbon (MBC),and dissolved organic carbon(DOC) commonly represent the unstable carbon fractions(Siet al.2018;Xueet al.2018). However,whether these indicators are sensitive to tillage and S practices on the NCP remains to be determined. NT and S significantly increased labile C fractions,and POC was a more sensitive fraction to changes in tillage practice than POXC at 0-50 cm depth in Hebei Province,North China (Xueet al.2018).Zero tillage increased POC,mineral-associated organic carbon,and humin contents due to the constant inputs of crop residues to surface soils (Ferreiraet al.2020).Bongiornoet al.(2019) found that POXC and POC were more sensitive to tillage and fertilization than DOC in European arable soils.
Soil DOC is the most mobile and readily microbially utilized fraction,and its concentration and composition can affect microbial C processes. The composition of DOC can be identified by fluorescence excitation-emission matrix (EEM) spectrophotometry combined with parallel factor analysis (PARAFAC) (Fellmanet al.2010). Tillage is associated with an increase in aromatic structures in DOC (Romeroet al.2017) or has no significant effect on DOC characteristics (Ohnoet al.2009;Bongiornoet al.2019). Humic acid-like and fulvic acid-like substances were found primarily in soil with wheat straw amendment(Gaoet al.2018). DOC content decreased with depth and conversion from more plant-derived DOC near the surface to more microbially processed DOC in the subsoil (Schmidt and Martínez 2019). The dynamics of the composition of DOC may be derived from differences in microbial processes and organic inputs. Hence,understanding the composition of soil labile C is important in predicting the early potential changes in SOC quality under different agricultural management practices.
Winter wheat and summer maize is the predominant cropping system on the NCP,a major grain production region producing more than half the national wheat yields and 30% of the national maize yields (CSB 2018). No-till combined with S might notably enhance the rainfed crop yields and SOC storage in arid climates (Pittelkowet al.2015). However,the wide adoption of NT on the NCP remains constrained due to a lack of knowledge on the appropriate management practices and integrated pest and disease control. Here,we have taken advantage of an 11-year-old field experiment to focus on the quantity and quality of SOC by investigating the concentration and chemical composition of SOC and its labile forms in response to tillage and S. The chemical composition of SOC was determined by solid-state cross-polarization magic-angle spinning (CPMAS)13C nuclear magnetic resonance (NMR) (Duet al.2017b). We hypothesized that:(1) S would increase the concentrations of SOC and its labile fractions,and NT would increase them in the topsoil only with the return of both wheat straw and maize residues;(2) S and tillage practices would shift the composition of DOC and SOC.
2.Materials and methods
2.1.Site description and experimental design
The study on winter wheat and summer maize rotation,located at Quzhou Experimental Station in Quzhou County,Hebei Province,North China (36°52′N,115°01′E,40 m a.s.l.),was established in 2007. The average monthly temperature and precipitation are 10.8°C and 509.8 mm,respectively,across 2016-2018. The soil is classified as a Cambisol with a silty loam texture,with soil background properties reported in Liet al.(2020).
The experiment was a split-split-plot design. The mainplot factor was tillage practice,the split-plot factor was S mode,and the split-split-plot factor was nitrogen rate. In total,there were 18 treatments with three replicates,and six treatments were selected at an application rate of 180 kg N ha-1with tillage and straw residue management. Each plot was 10 m×10 m. The tillage practices were no-tillage (NT)all year round and CT using a moldboard plow to~20 cm soil depth,then rotary tillage to~10 cm depth before sowing wheat,and NT before sowing maize. The three S treatments were straw removal (S0),return of wheat straw only (S1),and return of both wheat straw and maize residue(S2). Crop residues were chopped to~10 cm long using a combine harvester and incorporated into the top 20 cm of the soil profile in the CT treatment,but in the NT treatment,the straw remained on the soil surface to act as a mulch.
During the growth period of the winter wheat,800 kg ha-1compound fertilizer (N:P:K,15:7:12) was used as a ground fertilizer,and 60 kg N ha-1as urea was used as a top dressing at the shooting stage. During the summer maize season,267 kg ha-1compound fertilizer (N:P:K,15:7:12) and 20 kg N ha-1as urea were used as basal fertilizer,and 120 kg N ha-1was used as a top dressing at the bell stage.
2.2.Soil sampling
Soil samples were taken at soil depths of 0-10 cm and 10-20 cm using an auger (8-cm diameter) at the maize harvest in October 2018. Five cores were removed from each plot and mixed thoroughly to give one composite sample after removing crop residues and stones. The samples were passed through an 8-mm sieve and then divided into two portions,one of which was air-dried to 8% moisture content for the separation of soil aggregates (>2.0 mm,0.25-2.0 mm,and <0.25 mm) by wet sieving (Cambardella and Elliott 1993). The other portion was passed through a 2-mm sieve and further subdivided into two parts,one of which was air-dried for the determination of SOC,POC,POXC,and DOC,and the remainder was stored at -20°C for the determination of microbial biomass C (MBC). Undisturbed soil cores were taken using a cutting ring (100 cm3) to determine the bulk density (Chenet al.2020).
2.3.SOC and labile C fractionation
The SOC was determined using an elemental analyzer(Vario Macro CNS analyzer,Elementar,Langenselbold,Germany) after the removal of inorganic C with 0.5 mol L-1HCl solution (Chenet al.2009). POC,the sandsized (53-2 000 μm) soil fraction,was determined according to Cambardella and Elliott (1993). POXC was determined using the KMnO4oxidation method (Weilet al.2003). MBC was determined using the chloroform fumigation extraction method (Vanceet al.1987) and calculated using a correction factor (Kc=0.45) to convert C concentration to MBC (Joergensen 1996). DOC was extracted according to Sharmaet al.(2017). Briefly,10.0 g of air-dried soil were extracted with 20 mL of Milli-Q water on a horizontal shaker at 140 r min-1for 2 h and centrifuged at 4 000 r min-1for 15 min. The supernatant was filtered through a 0.45-μm pore membrane filter and analyzed for C concentration using a TOC analyzer (TOCVCPH;Shimadzu,Kyoto,Japan).
2.4.Fluorescence component characteristics of DOC
The DOC solutions were determined by fluorescence EEMs using an Aqualog synchronous analyzer (Horiba Scientific,Kyoto,Japan) with excitation wavelengths of 200-500 nm and emission wavelengths of 250-550 nm at 4-nm increments. The scan speed was 1 000 nm min-1and the bandwidths of excitation and emission slits were set.
PARAFAC analysis was conducted using MATLAB 7.0 (MathWorks,Natick,MA) with the DOM Fluor v.1.7 Toolbox. Six PARAFAC components were detected according to their maximum fluorescence intensity(Ishii and Boyer 2012). The spectral components were compared with previous studies (Appendix A).The percentage of each component is expressed as the ratio of the component fluorescence intensity (CI)to the total fluorescence intensity (i.e.,C1(%)=C1/(C1+C2+C3+C4+C5+C6)×100) (Guéguenet al.2015).The fluorescence index (FI) is the ratio of the fluorescence intensity at emission wavelengths 450 and 500 nm relative to that at the excitation wavelength of 370 nm,which was used to differentiate microbial origins of DOC from terrestrially-derived origins (McKnightet al.2001). The autochthonous index (BIX) was determined as the ratio of the fluorescence intensity at an emission wavelength of 380 nm to the emission intensity maximum observed between 420 and 435 nm at an excitation wavelength of 310 nm (Parlantiet al.2000;Huguetet al.2009),showing the degree of autochthonous origin of DOC. The humification index (HIX) is expressed by the peak area under the emission spectra 435-480 nm divided by the peak area 300-345 and 435-480 nm at the excitation wavelength of 254 nm (Ohno 2002) due to the higher ratio of C/H and the presence of complex molecules such as high-molecular-weight aromatics.
2.5.Chemical composition of SOC
The chemical composition of SOC was determined by13C-CPMAS-NMR (Kurganovaet al.2019). Soil samples were pretreated by demineralizing using 10% (v/v)hydrofluoric acid,and the remaining samples were freezedried (Gonçalveset al.2003).13C-CPMAS-NMR analysis was conducted using an Avance III 300 WB spectrometer(Bruker,Billerica,MA). Dried and finely powdered soil samples were packed in a ZrO2rotor closed with a Kel-F cap and spun at a rate of 5 kHz. A total of 10 000 scans were recorded with 6 s recycle delay for each sample. All13C CPMAS chemical shifts were referenced to the resonances of adamantane (C10H16) standard(dCH2=38.5).
The NMR spectra were obtained with MestreNova Software 9.0 (Mestrelab Research Inc.,Santiago de Compostela,Spain). Integration was done using the resonance peak areas for the four major zones (Baldock and Skjemstad 2000;Simpson and Simpson 2012;Duet al.2017b): alkyl C (0-50 ppm),O-alkyl C (50-110 ppm),aromatic and phenolic components (110-165 ppm),and carboxyl and carbonyl components (165-215 ppm).Each functional group as a percentage of total C was determined by integrating the area below the curves. The degree of decomposition was determined by calculating the alkyl C/O-alkyl C ratio,aromaticity (ratio of aromatic C/(aromatic C+alkyl C+O-alkyl C)),and aromatic C/O-alkyl C ratio. The SOC aliphaticity was estimated as the ratio of (alkyl C+O-alkyl C)/(alkyl C+O-alkyl C+aromatic C),indicating the SOC decomposition potential (Baldocket al.1997).
2.6.Calculations and statistical analysis
The SOC stock (Mg C ha-1) and sequestration rates (Mg C ha-1yr-1) from 2007 to 2018 at each soil depth were computed according to Fanet al.(2014). The mean annual C input (Mg C ha-1yr-1) was assessed using data from 2007 to 2016,according to Liet al.(2020),including C from straw,stubble,root,and rhizodeposition.
The sensitivities of labile C fractions were assessed according to Plaza-Bonillaet al.(2014):
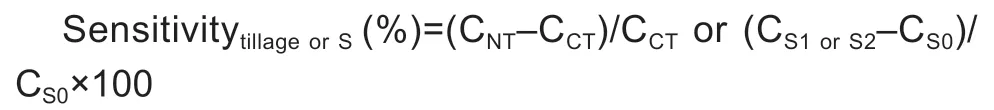
where sensitivitytillageorSindicates the variation in labile SOC fractions (%);CNTand CCTrefer to the different labile fractions under NT and CT treatments,respectively;CS0orS1orS2refers to the different labile fractions under S0,S1,and S2 conditions.
Mean weight diameter (MWD;mm) expresses the water stability of soil aggregates as:
MWD=∑(d×m)
where d is the average diameter (mm) of each aggregate size and m is the aggregate weight of each percent in soil(%).
Data analysis was conducted using the SPSS 21.0 Software Package. Effects of tillage and straw return on SOC,labile carbon fractions,and indices of fluorescence at both soil depths were analyzed with a two-way analysis of variance. Tillage effects under the same straw return conditions were pair analyzed. Pearson linear correlations were used to evaluate the relationships between SOC and its labile fractions and MWD.
3.Results
3.1.Soil organic C concentrations and stocks
Overall,straw return significantly enhanced SOC concentrations and stocks at both soil depths,and the effect was greater in the S2 treatment than in S1(Fig.1). Compared to CT,NT generally increased SOC concentrations and stocks by 12 and 10% at 0-10 cm and decreased them by 18 and 15% at 10-20 cm,and this was particularly pronounced in the S2 treatment.The SOC concentration was mainly affected by straw return in the topsoil and tillage practices below the topsoil(Appendix B). Soil bulk density decreased with straw return at 0-10 cm but was not affected by tillage or straw return at 10-20 cm (Fig.1).
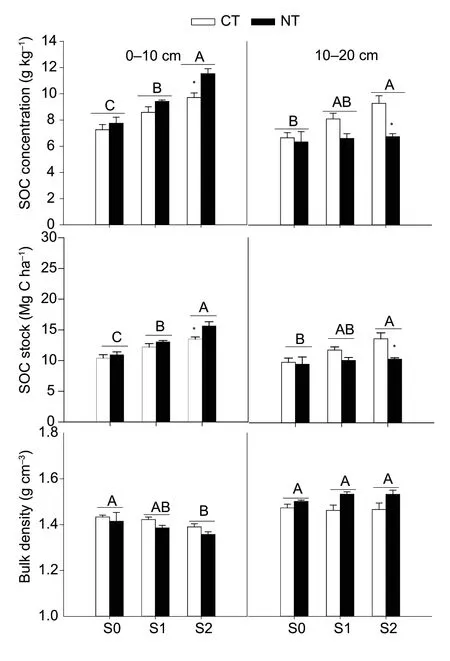
Fig.1 Soil organic carbon (SOC) concentration,SOC stock,and bulk density under different tillage and straw managements at 0-10 and 10-20 cm depths. CT,conventional tillage;NT,no-tillage. S0,straw removal;S1,return of wheat straw only;S2,return of both wheat and maize straw. Vertical bars denote the standard error of the mean (n=3). Different capital letters indicate significant differences among different straw return practices at P<0.05. *,significant difference between the two tillage practices under the same straw treatment at P<0.05.
Tillage and straw return did not affect mean annual yields (average 5.19 Mg ha-1of wheat and 7.56 Mg ha-1of maize) or aboveground biomass (average 10.9 Mg ha-1of wheat and 14.0 Mg ha-1of maize) of either wheat or maize from 2007 to 2016 (Appendix C). The mean annual C sequestration rates increased with the mean annual C inputs,i.e.,straw-C,stubble-C,and root-C (Appendix D).Consequently,the C sequestration rate was significantly increased by straw return at both depths,increased in the NT treatment in the topsoil,and decreased below the topsoil compared to CT.
3.2.Concentrations and sensitivities of soil labile C fractions
The concentrations of labile C fractions exhibited similar patterns to SOC at both soil depths,and these parameters were all positively correlated with one another (Fig.2;Appendix E). The concentrations of labile C fractions increased with straw return,and values were higher in the S2 treatment than in S1. The exception was POC in the sub-topsoil,where no significant difference was observed between treatments S1 and S2. The concentrations of labile C fractions (except DOC) were higher under NT than under CT at 0-10 cm,and those of POC and POXC were lower under NT than under CT at 10-20 cm. In general,the effects of straw return on the concentrations of labile C fractions were greater than tillage practices at both soil depths,but POXC concentrations in the subsoil were mainly affected by tillage practices (Appendix B). The contributions of straw return to the differences in concentrations of POC,POXC,MBC,and DOC were 74,93,72,and 85% at 0-10 cm depth,respectively,and 36,43,68,and 74% at 10-20 cm,respectively. The corresponding values for tillage were much lower,or there was no contribution at the two soil depths. The interactive effects of S and T contributed to differences in POC and POXC by 6 and 1% at 0-10 cm and in MBC at 10-20 cm depth by 20%. Accordingly,the percentages of POC and POXC in SOC increased with straw return,but the percentages of DOC and subtopsoil MBC to SOC increased under NT conditions,yet NT decreased the percentage of POXC in SOC below the topsoil (Appendix F).
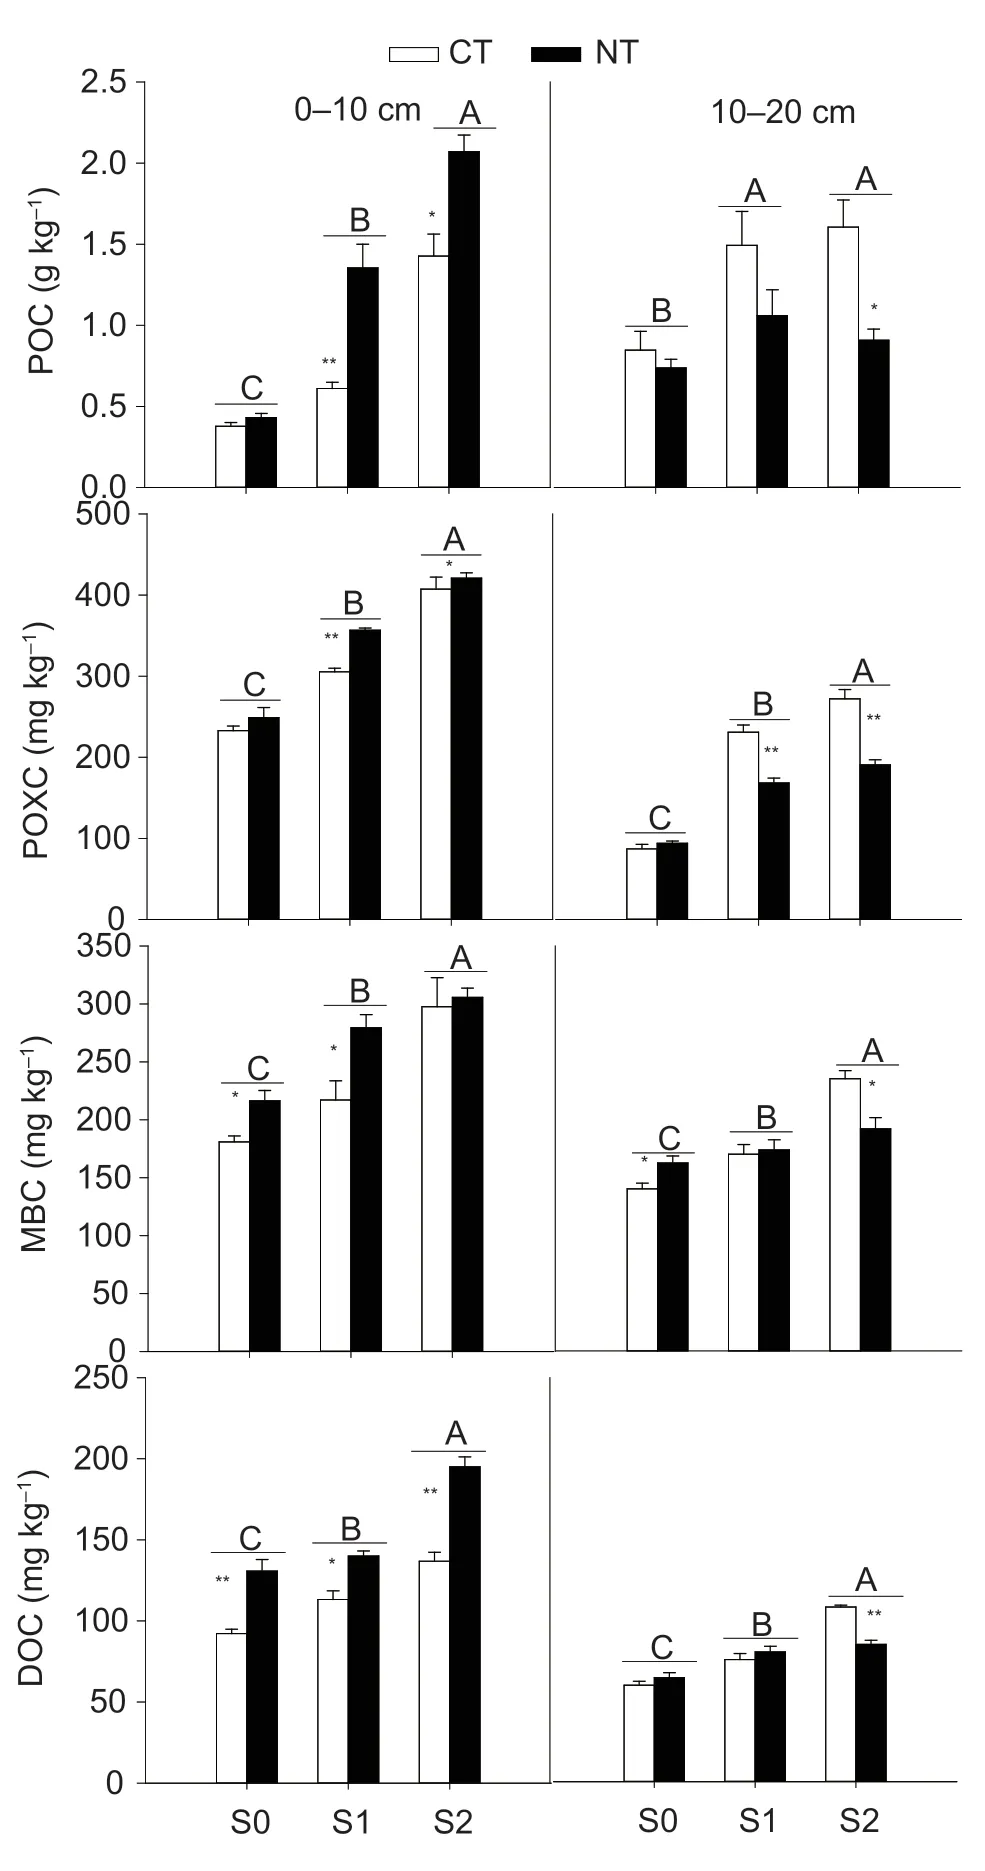
Fig.2 Concentrations of soil labile C fractions under different tillage and straw managements at 0-10 and 10-20 cm depths.CT,conventional tillage;NT,no-tillage. S0,straw removal;S1,return of wheat straw only;S2,return of both wheat and maize straw. POC,particle organic carbon;POXC,permanganate oxidizable organic carbon;MBC,microbial biomass carbon;DOC,dissolved organic carbon. Vertical bars denote the standard error of the mean (n=3). Different capital letters indicate significant differences among different straw return practices at P<0.05. * and **,significant differences between the two tillage methods under the same straw management conditions at P<0.05 and P<0.01,respectively.
Sensitivities of labile C fractions were assessed by comparing tillage practices (NTvs.CT) and straw return(S1vs.S0,S2vs.S0) at both soil depths (Table 1). POC was the most sensitive parameter to tillage practices at both depths and was more sensitive to straw return in the surface soil. In contrast,POXC was more sensitive to straw return in the subsoil. Changes in POC (NTvs.CT) showed the highest values (62.3%) in topsoil and -26.4% in sub-topsoil.The corresponding values of POC were 139.9% (S1vs.S0) and 332.2% (S2vs.S0) at 0-10 cm depth. Changes in POXC showed the maximum values of 123.7% (S1vs.S0)and 158.6% (S2vs.S0) at 10-20 cm depth.
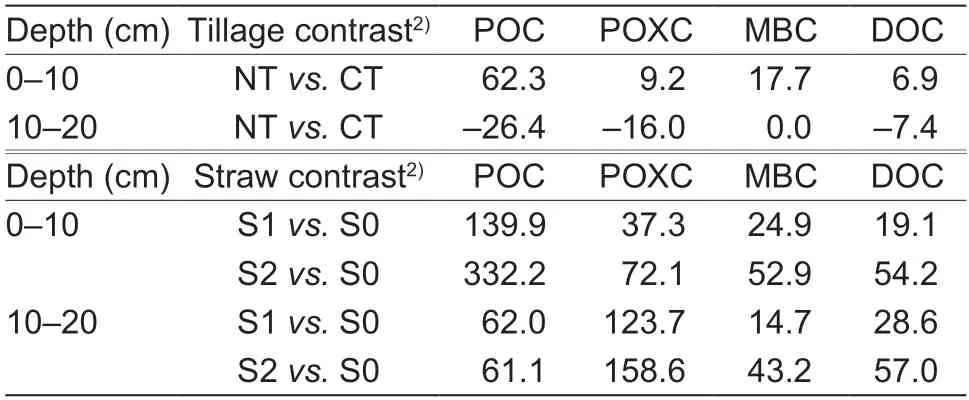
Table 1 Sensitivity of labile C fractions in response to tillage and straw return practices at 0-10 and 10-20 cm depths1)
3.3.Chemical composition of DOC by EEM-PARAFAC analysis
Fluorescence EEM-PARAFAC analysis was used to characterize and identify the chemical components of DOC. Based on EEM locations and contours,six fluorescent components,i.e.,components 1 (C1),2(C2),3 (C3),4 (C4),5 (C5),and 6 (C6),were identified(Appendices G and H). The detailed characteristics of the components in comparison with previous studies are summarized in Appendix A. The relative abundances of the six components are shown in Fig.3. At 0-10 cm depth,the values of C1,C2,C3,C4,C5,and C6 ranged from 27 to 35,21 to 22,15 to 22,9 to 21,6 to 9,and 4 to 9%,respectively. At 10-20 cm depth,the corresponding values were 25-31,21-24,14-19,14-21,5-8,and 6-13%.
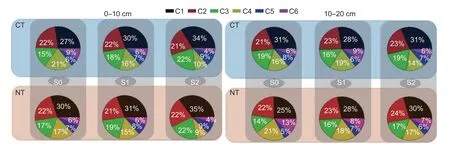
Fig.3 The relative percentage (%) of the six components (i.e.,components 1 to 6,C1 to C6) in dissolved organic carbon under different tillage and straw managements at 0-10 and 10-20 cm depths. CT,conventional tillage;NT,no-tillage. S0,straw removal;S1,return of wheat straw only;S2,return of both wheat and maize straw.
The six components of DOC at both soil depths were significantly affected by tillage and straw return (Appendix I).At 0-10 cm,the relative abundances of C1,C3,and C5 increased with straw return (S0=S1<S2),those of C4 and C6 were the reverse,and C2 was relatively constant. At10-20 cm,tillage contributed more to the differences in the six components than straw return mode. The relative abundances of C2 and C6 increased under NT,but those of C3 and C5 decreased. The proportion of C2 increased with straw return and NT. There were significant interactions between tillage and straw return in the relative abundances of C2,C3,C5,and C6. The abundances of C1 and C4 were not significantly affected by tillage or straw return.
Importantly,fluorescence indices are used to assess the origin and degree of transformation of DOC. FI is commonly used to calculate the relative weights of plantderived or microbially-derived DOC. An FI (fluorescence index)≤1.2 indicates that DOC is derived from plant residues and soil organic matter,and FI≥1.8 indicates a microbial source (Fellmanet al.2010). Autochthonous index (BIX) represents the new organic matter derived from microbes. Higher BIX values (>1) represent high percentages of autochthonous sources,while lower BIX values (<1) imply low percentages of biological origin(Huguetet al.2009;Huguetet al.2010;Salveet al.2012). The humification index (HIX) values are in the 0 to 1 range,with higher values indicating a greater degree of humification (Ohno 2002). As shown in Fig.4,straw return decreased the FI and BIX,and the values fell within the ranges of 1.57-1.70 and 0.60-0.76,respectively,and increased the HIX at both soil depths. Compared to CT,HIX in the NT treatment increased significantly at 0-10 cm but decreased at 10-20 cm. No-tillage increased FI and BIX at 10-20 cm compared with CT,especially in treatment S2.
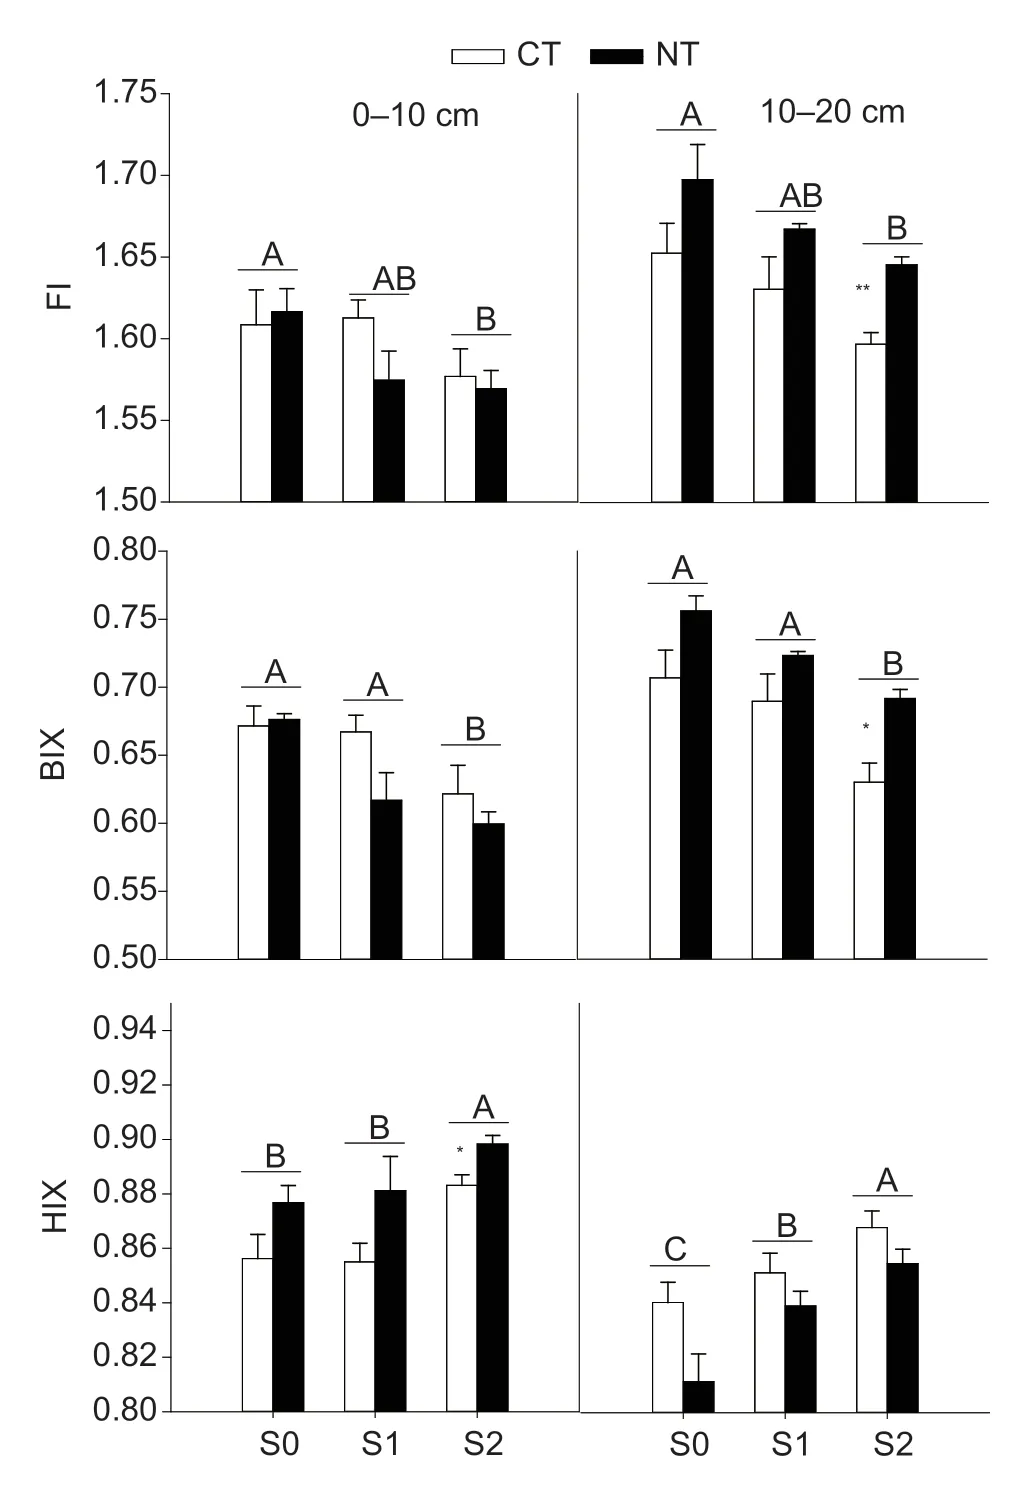
Fig.4 Fluorescence index (FI),autochthonous index (BIX),and humification index (HIX) based on EEM-PARAFAC analysis of dissolved organic carbon under different tillage and straw managements at 0-10 and 10-20 cm depths. CT,conventional tillage;NT,no-tillage. S0,straw removal;S1,return of wheat straw only;S2,return of both wheat and maize straw. Vertical bars denote the standard error of the mean (n=3). Different capital letters indicate significant differences among different straw return practices at P<0.05. * and **,significant differences between the two tillage methods under the same straw management conditions at P<0.05 and P<0.01,respectively.
3.4.Chemical composition of SOC by 13C-NMR analysis
The13C-NMR spectra indicate the chemical structures of SOC comprising alkyl C (0-50 ppm),O-alkyl C (50-110 ppm),aromatic C (110-165 ppm),and carbonyl C(165-215 ppm) (Fig.5). At both soil depths the relative proportions of the functional groups were ranked in the sequence O-alkyl>alkyl C>aromatic C>carbonyl C(Table 2). On average,SOC at 0-10 cm depth contained 28.8% alkyl C,39.3% O-alkyl C,18.9% aromatic C,and 13.0% carbonyl C,and the corresponding values at 10-20 cm were 28.7,38.7,19.6,and 13.1%,respectively.
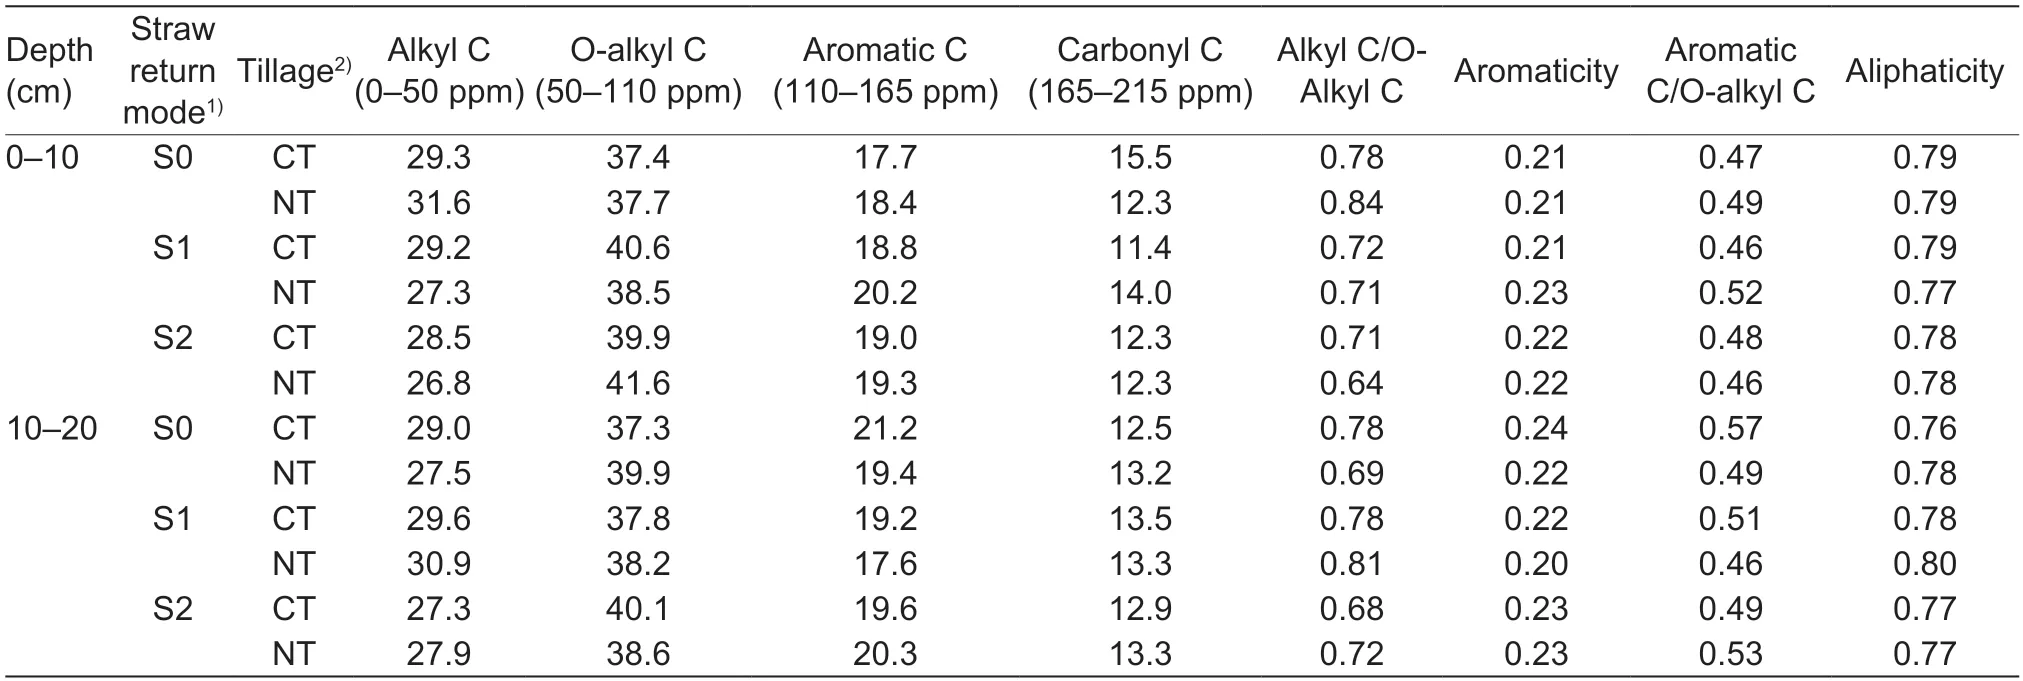
Table 2 Relative percentage (%) of different structural regions of soil organic carbon (SOC) as determined from the solid-state cross-polarization magic angle spinning (CPMAS) 13C nuclear magnetic resonance (NMR) spectra under the different tillage and straw return practices at 0-10 and 10-20 cm depths1)
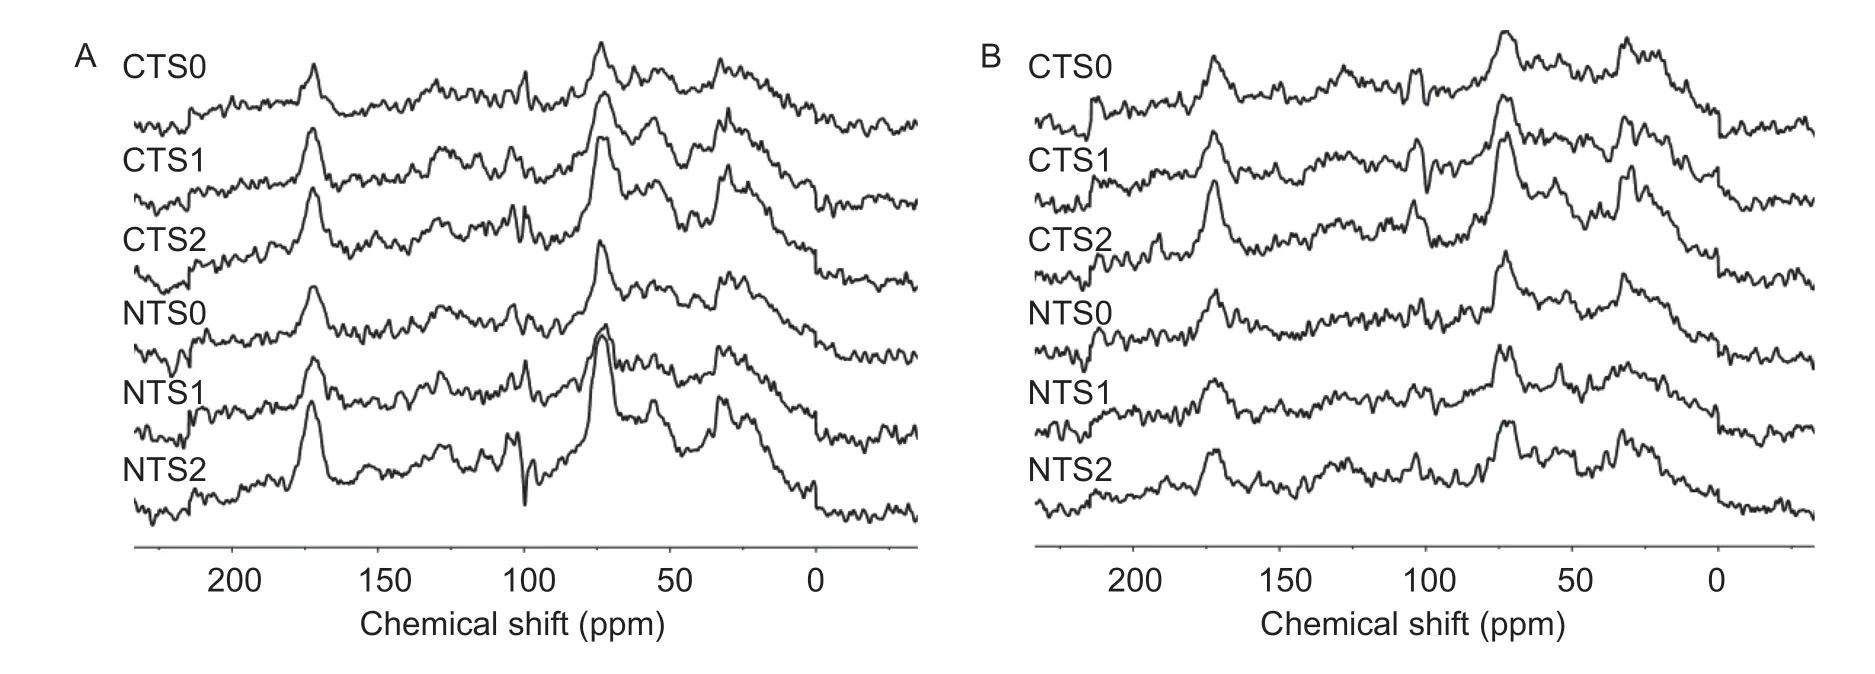
Fig.5 13C NMR (nuclear magnetic resonance) spectra of soil organic carbon under different tillage and straw managements at 0-10 cm (A) and 10-20 cm (B) depths. CT,conventional tillage;NT,no-tillage. S0,straw removal. S1,return of wheat straw only;S2,return of both wheat and maize straw.
Straw return tended to decrease the alkyl C and increase the O-alkyl C in the topsoil,but this pattern was not observed below the topsoil. At 0-10 cm depth,the content of alkyl C and the alkyl C/O-alkyl C ratio were maximum in the NT+S0 treatment. The contents of aromatic C and aromatic C/O-alkyl C ratio were maximum in treatment NT+S1. The highest content of O-alkyl C and the lowest alkyl C/O-alkyl C ratio were detected in treatment NT+S2. At 10-20 cm depth,CT without straw return had the highest content of aromatics,aromaticity,and aromatic C/O-alkyl C ratio. NT with only wheat straw return had the maximum aliphaticity and alkyl C/O-alkyl C ratio and the lowest aromaticity and aromatic C/O-alkyl C ratio,while CT+S2 had the lowest alkyl C/O-alkyl C ratio.
4.Discussion
4.1.SOC concentration and stock
Eleven years of straw return significantly increased SOC concentration,stock,and sequestration rate at 0-20 cm depth despite the absence of any significant yield increase under straw return compared to straw removal (Appendix C).The C sequestration rate at the 0-20 cm depth was,on average,0.39 (0.25-0.52) Mg C ha-1yr-1under straw return,a value close to the mean level of 0.35 Mg C ha-1yr-1across China (Hanet al.2018) and on the NCP (0.33 Mg C ha-1yr-1). Return of both wheat straw and maize residue could realize the ‘4 per mille’ goal,with annual mean rates of increase of 12.5‰ (the S1 treatment) and 25.9‰ (the S2 treatment) at 0-20 cm depth. We did not find a significant yield increase in the straw return treatment (Appendix C). The results contrast increases in grain yield of 9.3-18.4% across China and 3.0-26.7%on the NCP (Hanet al.2018). The discrepancy may be related to differences in fertilizer management,cropping system,soil type,duration of the experiment,and the initial SOC content (Berhaneet al.2020). Here,the fertilization rates and the management practices were the same across all treatments. The additional benefit due to straw return did not translate into yield benefit.For example,straw return decreased wheat yields by 0.6-7.1% on the NCP,possibly due to the slower warming of the soil under straw mulching during the cool season(Wanget al.2015).
Importantly,NT stratified the SOC at 0-20 cm depth with enrichment at 0-10 cm and a decline at 10-20 cm compared to CT,especially under the S2 treatment (Fig.1;Appendix D). Similarly,compared with plow tillage,zero tillage significantly increased SOC concentration and stock in topsoil at 0-5 or 0-10 cm depth,and the stratification ratio on the NCP (Duet al.2010;Zhaoet al.2015;Puet al.2019). This is mainly attributable to the lower capacity of SOC to mineralize due to increased physical protection of aggregates in NT soils (Kanet al.2020b). In addition,NT increased soil aggregate stability (Appendix J),and pore connectivity and CT decreased SOC content by increasing pore anisotropy and macropore volume(Guoet al.2020). By contrast,a recent meta-analysis of Chinese arable soils shows a declining trend from plow tillage to rotary tillage to zero tillage on SOC storage when combined with crop residue incorporation (Wanget al.2020). The outcome of tillage and crop residues on SOC is complicated by confounding factors,including cropping system,fertilization,and study duration (Wanget al.2020). The other beneficial impacts of the adoption of conservation tillage also include increased soil aggregation,protection of the soil from rainwater erosion,and increasing soil moisture content (Ji and Unger 2001;Ogleet al.2019). Our study indicates that NT is limited in increasing SOC contents in this region compared to CT. Considering the effectiveness of NT,at least the amount of straw return should be considered. In contrast,subsoiling or deep plowing combined with straw residues increases carbon sequestration by enlarging the storage space for SOC-rich materials (Alcántaraet al.2016;Xueet al.2018;Xuet al.2019),or rotating conservative tillage with CT increases SOC at greater soil depths (Zhanget al.2018). On the other hand,NT with straw retention promotes the temperature sensitivity of SOC at low-tointermediate moisture contents,potentially exacerbating the greenhouse effect under future warming scenarios(Kanet al.2020a). Hence,a mechanistic understanding of the dynamics of SOC will provide guidance in terms of rational management practices to increase SOC content.
4.2.Soil labile C fractions and their sensitivities
Tendencies of labile C fractions were in line with that of SOC,with POC more sensitive to tillage practices at both soil depths and straw return at 0-10 cm depth.POXC was more sensitive to straw return at 10-20 cm depth (Fig.2;Table 1),which agrees with previous studies (Chanet al.2002;Duvalet al.2018;Bongiornoet al.2019). Similarly,an experiment conducted for four years on the NCP found that POC was a more sensitive indicator of tillage and straw return practices than POXC at 0-50 cm soil depth (Xueet al.2018). POC showed a significant response to the amount of residue,temperature,and precipitation,but POXC did not (Duvalet al.2018;Xueet al.2018). This may be due to POXC being easily degradable by soil microbes as it consists of simple carbohydrates,amino acids,and amide sugars in addition to compounds such as lignin and complex polysaccharides (Weilet al.2003). POC,the newest and most bioactive SOC,is composed of partially decomposed fresh plant litter and microbial products (Skjemstadet al.2006),which depend largely on C amendment of the soil (Vieiraet al.2007) and tillage disturbance (Sixet al.2000). The higher sensitivity of POC is also associated with soil aggregation (Sixet al.2000). Here,POC and MWD were positively correlated with each other and had the most highly significant correlation coefficients across all treatments and depths (Appendix K). Consequently,the greater amount of C input (Appendix D) and higher aggregate stability (Appendix J) promoted the percentage of POC in SOC in tandem (Appendix F). In summary,POC may be a suitable indicator of changes in active carbon on the NCP.
In a similar fashion to POC and POXC,MBC and DOC increased with straw return,but the magnitude of the changes in response to tillage practices and straw return modes was smaller than the other two parameters(Fig.2;Table 1). MBC is a living and labile C fraction easily subjected to external micro-climate change,DOC represents the most reactive fraction and is accessible to microbial utilization,and mobile fractions are readily transported to greater soil depths (Chantigny 2003).These fractions are easily affected by water,temperature,and biotic disturbance (Zhanget al.2015;Huet al.2017).MBC and DOC may be greatly affected by the growth of crops (Leiet al.2010). Approximately 80-90% of wheat and maize roots grow in the top 25 cm of the soil profile(Hirteet al.2018). Hence the effects of tillage and straw addition on MBC and DOC may be offset by carbon inputs due to root growth in the surface soil,which may result in similar percentages of MBC and DOC in SOC across all treatments.
4.3.DOC composition and spectral indices
Six major fluorescent components in DOC were observed using 3D-EEM and PARAFAC analysis (Appendices G and H). Humic-like substances represented the major fluorescence component in DOC,in line with previous studies (Liet al.2019;Zhanget al.2019). Organic substances in the straw contain mainly proteins,cellulose,and polysaccharides,which are the precursors of humicand fulvic-like substances (Maieet al.2007). Straw return significantly increased humic-like (C1 and C3) and fulvic acid-like (C5) substances,while aromatic humiclike compounds (C4) and protein-like tryptophan (C6)decreased in the surface soil (Appendix I). Straw entering soils is decomposed to different degrees to decomposed humic-like substances,and aromatic materials are the dominant recalcitrant compounds to microorganisms that are utilized at later decomposition stages,resulting in a decrease in the content of less aromatic substances(Chenet al.2010). Protein-like tryptophan (C6) in DOC is derived mainly from autochthonous sources and decreases with straw return,which agrees with Zhanget al.(2019). The removal of aboveground biomass of crops by harvesting reduces the input of crop residues;thus,DOC relies more on autochthonous sources.Below the topsoil,NT promoted the microbial-derived sources of DOC,as shown by the increments in C2 and C6 over CT (Appendix I). However,the percentages of high-molecular-weight humic-like substances (C3)and fulvic-like substances (C5) decreased compared to surface soil DOC. Below-topsoil DOC is enriched by simple,microbially-derived precursors and deprived of energy-rich,plant-derived materials (Romeroet al.2019). Therefore,understanding the spatial and temporal dynamics of DOC may aid our knowledge of the degradation,transformation,and turnover of active C in the soil.
Our results indicate a joint contribution to DOC from microbial and allochthonous sources (Birdwell and Engel 2010;Jianget al.2017),and the crop-derived source in DOC increased with straw addition. No-tillage protected the microbially-derived DOC below the topsoil from decomposition due to the lack of disturbance and straw incorporation. In addition,the humification of DOC was altered by tillage owing to its changing distribution of straw retention in the soil profile.
4.4.Chemical composition of SOC
The percentage of the relative functional C groups based on13C NMR spectroscopy shows the trend O-alkyl C>alkyl C>aromatic C>carbonyl C (Fig.4),which is similar to Guoet al.(2019). The molecular structure of SOC mainly depends on the quality of material inputs into the soil. Here,the abundance of O-alkyl C tended to increase,but alkyl C was apt to decline with straw addition to the surface soil,possibly due to the resistant alkyl C being decomposed through labile O-alkyl C fueling the microbiome,especially under a lack of fresh labile C input into the soil (Fontaineet al.2007).
Despite the minor variations in the contents of various functional groups,the ratios varied with tillage and straw return treatments (Table 2). The ratios of alkyl C/O-alkyl C and aromatic C/O-alkyl C,aromaticity,and aliphaticity have been suggested as indices for the decomposition dynamics of SOC (Hatcheret al.1981;Baldocket al.1997;Kölbl and Kögel-Knabner 2004;Bimülleret al.2014). No-tillage promoted the decomposition and recalcitrance of SOC in the no (S0) or low (S1) straw input treatment but increased the lability of SOC in treatment S2 in topsoil. The higher alkyl C/O-alkyl C ratio in the NT+S0 treatment in topsoil indicates a higher degree of decomposability of SOC,possibly due to both selective preservation andin-situsynthesis related to long-chain polyethylene structures such as waxes,suberin,and cutin (Baldock 1992). A lack of external C input to the soil promotes the resistance and stability of SOC owing to an energy deficit for the microbiome to decompose (Fontaineet al.2007). As expected,NT with only wheat straw return showed the highest aromatic C/O-alkyl C ratio in the surface soil and the lowest aromatic C/O-alkyl C ratio in sub-topsoil (Table 2),which was associated with the distribution of wheat straw incorporated into soil layers and the higher lignin contents in wheat (Dignacet al.2005). The lowest alkyl C/O-alkyl C ratio in treatment NT+S2 in the surface soil(Table 2) indicated that NT better preserved the labile C such as polysaccharides due to the slower mineralization rate (Kanet al.2020b) and higher aggregate stability(Appendix J),whereas CT promoted their decomposition(Baldocket al.1997;Sixet al.2000;Shresthaet al.2015). Similarly,on the Loess Plateau in China,conservation tillage increased the abundance of O-alkyl C and had a lower aromatic C/O-alkyl C ratio in light-and coarse-POC fractions compared to CT (Gaoet al.2019).We also found that CT promoted the aromatization of SOC below the topsoil. These results suggest that the impacts of tillage on the chemical composition of SOC are complex,and interactions among biotic and abiotic factors need to be considered.
5.Conclusion
This experiment shows that straw return increased the concentration and storage of SOC at 0-20 cm depth(S0<S1<S2). No-tillage did not significantly affect the total SOC stock at 0-20 cm,but the SOC was stratified,i.e.,higher values were detected at 0-10 cm and lower values at 10-20 cm relative to CT,especially under S2 conditions. Both POC and POXC were more sensitive to straw return,and the former was more responsive to tillage. Straw return increased the crop-derived DOC and humification of DOC at 0-20 cm. No-tillage increased DOC humification at 0-10 cm and microbial sources in DOC at 10-20 cm under the return of both wheat straw and maize residues. Straw return and tillage marginally affected the chemical composition of SOC. The chemical composition of SOC was: O-alkyl C>alkyl-C>aromatic-C>carbonyl-C. Overall,we found that straw return and NT combined with the return of both wheat straw and maize residues effectively increased the concentrations of SOC and its labile fractions and shifted the fluorescent components of DOC in the soil profile at 0-20 cm,yet less influenced the chemical composition of SOC. We recommend POC and POXC as early sensitive indicators for predicting SOC dynamics in response to straw and tillage management in this region. Moreover,accidental deep tillage in the NT system combined with the return of both wheat and maize straw may enhance SOC. This study provides data to underpin advice on soil-crop system management to increase carbon storage and soil fertility in North China.
Acknowledgements
The authors gratefully acknowledge funding from the National Basic Research Program of China(2015CB150500).
Declaration of competing interest
The authors declare that they have no conflict of interest.
Appendices associated with this paper are available on http://www.ChinaAgriSci.com/V2/En/appendix.htm
杂志排行
Journal of Integrative Agriculture的其它文章
- Integrated pest management and plant health
- Neopestalotiopsis eucalypti,a causal agent of grapevine shoot rot in cutting nurseries in China
- Changes in phenolic content,composition,and antioxidant activity of blood oranges during cold and on-tree storage
- Development of a texture evaluation system for winter jujube(Ziziphus jujuba ‘Dongzao’)
- Statistical analysis of nitrogen use efficiency in Northeast China using multiple linear regression and Random Forest
- Characteristics of inorganic phosphorus fractions and their correlations with soil properties in three non-acidic soils