The SSA-BP-based potential threat prediction for aerial target considering commander emotion
2022-11-28XunWngJinLiuToHouChoPn
Xun Wng ,Jin Liu ,To Hou ,Cho Pn
a College of Information Science and Engineering,Wuhan University of Science and Technology,Wuhan,430081,China
b Beijing Xin Li Machinery Limited Liability Company,Beijing,100039,China
c School of Information and Communication Engineering,Hubei University of Economics,Wuhan,430205,China
Keywords:Aerial targets Emotional factors Potential threat prediction BiLSTM Sparrow search algorithm Neural network
ABSTRACT The target"s threat prediction is an essential procedure for the situation analysis in an aerial defense system.However,the traditional threat prediction methods mostly ignore the effect of commander"s emotion.They only predict a target"s present threat from the target"s features itself,which leads to their poor ability in a complex situation.To aerial targets,this paper proposes a method for its potential threat prediction considering commander emotion(PTP-CE)that uses the Bi-directional LSTM(BiLSTM)network and the backpropagation neural network(BP)optimized by the sparrow search algorithm(SSA).Furthermore,we use the BiLSTM to predict the target"s future state from real-time series data,and then adopt the SSA-BP to combine the target"s state with the commander"s emotion to establish a threat prediction model.Therefore,the target"s potential threat level can be obtained by this threat prediction model from the predicted future state and the recognized emotion.The experimental results show that the PTP-CE is efficient for aerial target"s state prediction and threat prediction,regardless of commander"s emotional effect.
1.Introduction
In modern aerial defense operation,the target"s threat prediction is an essential process for command.Its results will directly affect the correctness of defense decisions and the rationality of firepower[1].However,due to a large amount of time-sensitive information in a complex aerial combat environment,it is difficult to obtain satisfactory decision relying exclusively on the aerial combat situational information[2].Therefore,as an essential decision-making tool to relieve stress on commanders,the threat prediction on enemy aerial targets have been introduced into aerial defense techniques.
Currently,many threat prediction methods have been developed,while there are two disadvantages that would limit their application seriously.On the one hand,most of these methods only predict target"s threat level in the present time instead of that in the future,and have large errors.On the other hand,the commander"s emotion is rarely considered even though it would influence his decision-making efficiency.Therefore,the current research on target threat cannot provide an efficient reference for the commander"s defense resource scheduling.It is necessary to comprehensively analyze the target"s state information and the commander"s emotion to predict a precise potential threat level for any aerial target.
For getting the target"s state information,the autoregressive integrated moving average model(ARIMA)and the Elman neural network are applied[3,4].Unlike the maneuvering target tracking based on MN-DDPG and transfer learning[5],the state prediction needs to analyze all the target features in a more integrated way.The Long Short-Term Memory neural network(LSTM)is an improvement of the general recurrent neural network(RNN)[6-11].It has been adopted to predict the target"s state with high performance[12].However,the LSTM only considers the relationship of the forward sequence but ignores that of the backward one.Recently,a new variant version of LSTM,namely BiLSTM,has been used for complex nonlinear classification and regression problems such as ship motion prediction[13-15].It not only takes advantage of LSTM in dealing with long-term dependencies,but also utilizes the future information by introducing two forward and backward LSTM layers[13].As the relationship among the aerial target"s speed,height,distance,and other features are related to both the forward information and the subsequent missions,the BiLSTM can analyze the target"s features efficiently and thus perform a more precise state prediction.
The commander discussed in this paper is a person in charge of air defense in a ship.His duty is to analyze the target"s threat and thus make a firepower assignment.For getting a commander"s emotion,the capture and analysis for a commander"s physiological features are feasible.However,it is a challenge to obtain the commander"s speech,ECG,electrodermal,and brain wave because they are very easily affected by noise[16].Therefore,we choose the facial expression to obtain the commander"s emotion[17].In Ref.[18],a deep sparse autoencoder network based on softmax regression is proposed for facial expression recognition.In Ref.[19],the spatio-temporal convolutional features with nested LSTM are proposed for facial expression recognition.A complimentary facial expression extraction method based on deep learning is proposed in Ref.[20].In Ref.[21],a facial emotion recognition scheme based on graph mining is proposed.
Although the target"s state and the commander"s emotion are both important factors in predicting a target"s threat level,the recent research is restricted to use only the target state information and ignore the commander"s emotion.For example,Ref.[1]proposed a target threat prediction method based on three-way decisions under an intuitionistic fuzzy multi-attribute decisionmaking environment[22],established a model of cloud target threat assessment based on aerial combat simulation under fuzzy and uncertain conditions,the group target threat assessment based on interval intuitionistic fuzzy multi-attribute group decisionmaking is proposed in Ref.[23].Besides,the Bayesian networks[24],the intuitionistic fuzzy sets[25,26],the neural networks[27],and the heterogeneous group decision-making[28]have been applied in threat prediction.
This paper proposes a novel method for potential threat prediction that can consider both the target"s state and the commander"s emotion in an aerial combat environment.This method includes three steps.Firstly,the BiLSTM is used to perform the aerial target"s state prediction with small errors.Secondly,the convolutional neural network(CNN)identifies the commander"s emotion in real-time.Lastly,the BP[29]optimized by SSA[30](SSA-BP)combines the target"s state with the commander emotion to build the target"s threat prediction model.Therefore,the target"s potential threat level can be obtained from this SSA-BP model by inputting the predicted state data and the identified commander"s emotion.
The remainder of the paper is organized as follows.We introduce the methodology and the overall framework in Section 2.Section 3 presents the state prediction method based on the BiLSTM.Then,in Section 4,the CNN[31]performs facial expression recognition for the commander"s emotion.The SSA-BP is used to build the threat level prediction model in Section 5.The simulation experiments and results are presented in Section 6.A relevant discussion of this method is presented in Section 7.The conclusions are drawn in the final section.
2.Methodology
The PTP-CE is composed of three parts,as shown in Fig.1.The first part presents a prediction algorithm for the target"s state based on the BiLSTM.The second part designs an emotion recognition module based on the CNN.The third part uses the SSA-BP to combine the state information with the commander emotion to get the potential threat level.
In the target state prediction part,we perform a comprehensive analysis of the target type,velocity,heading angle,electromagnetic attributes,distance,and altitude.These features include the target"s combat posture attributes and inherent attributes,where the combat posture attributes are changing and the inherent attributes are nonnumeric during its motion.According to these features,Section 3 establishes a model to capture the hiding relationship on aerial combat attributes by the BiLSTM.Then this model is used to predict the aerial target"s future state.
In the emotion recognition part,the facial expression is used to recognize the commander"s emotion.The facial expression is the most direct way to reveal the emotion.The commander"s face image can be easily captured by a camera in the control room.Section 4 introduces the CNN used to analyze the facial expression for getting the emotion.Obviously,the commander has different productivity when he is in a positive or negative emotion.Namely,the positive emotion can effectively increase his productivity,the neutral emotion has no effect on his productivity,while negative emotion can reduce his productivity.We classify the surprise and happiness as positive emotions,anger and sadness as negative emotions,normal as a neutral emotion.
In the threat prediction part,we combine the target"s state with the commander"s emotion to analyze threat to the ship.Due to the complex non-linear relationship among target threat level,target"s state,and commander"s emotion,we select the SSA-BP to fit them in Section 5.
The above three parts have synthetically considered the main factors of an aerial target"s threat level,so a feature description tree can be established as shown in Fig.2.
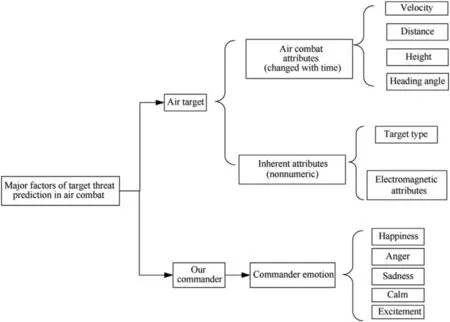
Fig.2.Feature description tree of aerial target"s potential threat level.
3.State prediction based on BiLSTM neural network
The aerial target"s states usually change drastically with subsequent tasks at any time.Although the LSTM is prior to analyzing time series,it is still insufficient to capture the features of contextdependent temporal data as it uses only the forward LSTM network that cannot handle backward feature information effectively.The BiLSTM combines the forward LSTM with the backward LSTM,which can obtain both the forward and the backward feature information.Therefore,we adopt the BiLSTM to establish the prediction model based on the target"s time state data.
3.1.Long-short term memory neural network
The LSTM has three gates:input gate,output gate,and forget gate.The network mainly learns to control these three gates for outputting the desired result.The working processes are as follows.
(1)The forget gate determines the information that needs to be forgotten,and it determines how much of the cell state of the previous moment is saved to the cell state of the current moment.The calculation formula is as follows.

wherextdenotes the input to the neuron at timet,ht-1denotes the hidden layer information at the timet-1.Wfandbfare the corresponding weights and bias terms,respectively.
(2)The input gate determines the information to be saved,which determines how much of the inputxtto the cell at the current moment is saved to the cell statectat the current moment.It is calculated as follows.

whereWi,Wc,bi,are the corresponding weights and bias terms,respectively.ct-1denotes the previous cell state information andctdenotes the current cell state information.
(3)The output gate determines the information to be output,which determines how much of the current cell state is input to the hidden of the cell.It is calculated as follows.

whereWoandbcare the corresponding weights and bias terms,respectively.htdenotes the hidden layer information at the momentt.
3.2.Bi-directional LSTM neural network
The BiLSTM has better performance for temporal prediction than the LSTM as its excellent ability for context-dependent processing.Compared with the LSTM,the BiLSTM builds 2 LSTM layers with opposite directions,one starting from the beginning of the sequence and stopping at the end,and the other starting from the end of the sequence and stopping at the beginning.This pair of hidden layers with opposite directions eventually connects the same output,so the BiLSTM is significantly superior to normal LSTM or RNN for the task of predicting contextual relevance.The BiLSTM model is represented as follows.

where Waare the weights and baare the biases that are used to calculate the activation vector a in the forward sequence.x and︿x are the input vector for forward sequence and backward sequence,respectively.︿W a and︿baare the weights and biases used to calculate the activation vector︿a in the backward sequence.Wyand byare the weights and biases used to calculate the output︿y.aprerepresents the activation vector of the last memory cell in the forward sequence.apreis0vector if the current memory cell is the first memory cell.︿anextis the next memory cell"s activation vector in the backward sequence,it is0vector if the current memory cell is the last memory cell.The network structure of the BiLSTM is shown in Fig.3.
In the forward sequence,the input vector x for the target is described as follows:

where videnotes the velocity,didenotes the distance,aidenotes the altitude,hidenotes the heading angle,iis from time 0 to timet.The activation vector a can be calculated as Eq.(6)at this time for their forward relationship.
Besides,for the backward sequence,the input vector︿x for the target is described as follows:

Then activation vector︿a can be calculated as Eq.(7)for their backward relationship.
At last,the output︿y can be obtained from a and︿a as Eq.(8).
4.Emotion recognition based on the CNN

Fig.3.Structure of the BiLSTM network.
The facial expression is the most natural and direct channel to reveal a person"s emotion.Also,the non-contact way to capture the facial expression from a camera has no interference to the commander"s operation.Therefore,we choose the facial expression to analyze commander"s emotion.If the commander is in good emotion,he can deal with the target in a more timely and rational manner,the target"s potential threat level can decrease even though its state remains unchanged.Therefore,according to the actual scene,we set the five types of commander"s emotion that are anger,sadness,normal,happiness,and surprise.
In a battleship"s command room,it is easy to collect the commander"s high-resolution front images through a camera.The CNN can then self-learn the filter according to the input image and automatically adjust the filter"s parameters,which is very useful for image feature analysis.Besides,the CNN has some functions of images restoration in extreme conditions,so it can quickly generate a clear image from the blurred image in order to obtain the required information.Therefore,as an important tool in facial recognition,the CNN is a stable and feasible way for recognizing the commander"s emotion in a aerial-defense process.In this part,the emotion of anger,sadness,normal,happiness,surprise is coded as[1 0 0 0 0],[0 1 0 0 0],[0010 0],[0 0 0 1 0],[0 0 0 0 1],respectively.Then it is possible to determine what emotion the commander is from the coding output of the CNN.
5.Potential threat prediction based on SSA-BP
From Section 3-4,the target"s potential threat level can be obtained after we get its future state and the commander"s emotion.However,the relationship between the target"s threat level and the target"s state is complex and non-linear,and the effect of the commander"s emotion on the target"s threat level is even more complicated.Fortunately,the SSA-BP has a robust global search capability that can avoid its fall into the local optimum.
5.1.Sparrow search algorithm
The SSA is introduced by Xue[30]in 2020.It has higher performance compared with the Gray Wolf Optimization(GWO),Particle Swarm Algorithm(PSO)and Gravitational Search Algorithm(GSA).Especially,the SSA has high performance in different search spaces and can explore potential global optimum regions,so it effectively solves the optimum local problem derived from that the threat prediction is a complex non-linear process.
The SSA is a group optimization algorithm inspired by the sparrows’foraging and anti-predatory behaviors.It takes all possible group behavior factors into account to converge quickly around the optimal value with high stability for global optimality searching.
The general process of the SSA is as follows:
(1)Initialize the sparrow population"s number and define its related parameter values;
(2)Output the current sparrow"s global-optimal position and global-optimal fitness value;
(3)Sort the fitness value to find the current best and worst individuals if the current iteration number is less than the maximum iteration number.
According to the foraging rule,the sparrows are divided into the discoverers(explorers)and the joiners(followers).The discoverer firstly performs the position update,where the joiners use discoverers to obtain food.The joiners may constantly monitor discoverers to increase their predation rate.Besides,some sparrows in the group will update their position when they perceive danger.
A population ofnsparrows can be expressed as follows:

whereddenotes the dimensionality of the problem variable to be optimized andnis the number of sparrows.In the subsequent optimization problem,ddenotes the number of parameters of the BP to be optimized.Furthermore,it means the total number of weights and bias in the BP neural network.Then,the fitness values of all sparrows can be expressed as follows:

wherefdenotes the fitness value.According to the principle of the above SSA,the optimization objective function can be established as follows:

whereNis the total number of the training set.oiandpiare the true and predicted values of thei-th data,respectively.And the fitness function indicates that we ultimately want to obtain a network with small errors on the training set.
In the SSA,the discoverers with better fitness values have priority to obtain food in the search process.They are also responsible for finding food for the entire sparrow population and providing foraging directions for all the joiners.Therefore,the discoverer can obtain a more extensive foraging range than the joiners.During each iteration,the location of the discoverer is updated as below:

wheretrepresents the current iteration.j=1,2,3…d.itermaxis a constant,indicating the max iteration.Xi,jdenotes the position information of thei-th sparrow in thej-th dimension.α(α∈(0,1])is a random number.R2(R2∈[0,1])indicates the warning value.ST(ST∈[0.5,1])indicates the safety value.Q is a random number that follows a normal distribution.Ldenotes a 1×dmatrix in which each element of the matrix is all 1.
WhenR2<ST,it means that there is no predator around the foraging environment at this time and the finder can perform an extensive search operation.WhenR2≥ST,it means that some sparrows in the population have found a predator and alert the other sparrows in the population to quickly fly to other safe foraging places.
Some joiners will always observe the discoverer during the foraging process.Once they perceive that the discoverer has found better food,they will immediately leave their current position to compete for this food.Also,they can get immediate access to the discoverer"s food if they are the winner in the competition.The updated description of the joiner"s location is as follows:

whereXpis the optimal position currently occupied by the discoverer,andXworstis current global worst position.A denotes a matrix where each element is randomly assigned a value of 1 or-1,andA+=AT(AAT)-1.Whenit indicates that the first joiners with a bad fitness have not got food and are in a very hungry state.It must fly to other places and forage for more energy.The location update of the vigilantes is described as follows:

whereXbestis the currently global optimal position.As the step control parameter,β is a random number that obeys a normal distribution with mean 0 and variance 1.K(K∈[-1,1])is a random number,andfiis the fitness value of the current sparrow.fgandfware the current global best and worst fitness values,respectively.ε is a constant to avoid 0 in the denominator.For simplicity,whenfi>fg,it indicates that the sparrow is at the edge of the population and is extremely vulnerable to predators.Xbestindicates that the sparrow is in the safest position in the population.Whenfi=fg,it indicates that the sparrows in the middle of the population are aware of the danger and need to move closer to other sparrows to minimize the hunted risk.Kmeans the movement direction of the sparrows,and is also a step control parameter.
5.2.BP for sparrow search algorithm optimization
The BP is a multilayer feedforward network with error backpropagation.It contains an input layer,an output layer,and some hidden layers.The update of its weights and bias is the most crucial step in its whole learning process.
The SSA has the advantage of exploring the global optimum in different search spaces and thus avoid the optimum local problem effectively.Therefore,it is used to optimize the BP for getting the optimal weights and bias.In this section,we firstly determine the specific structural parameters of the input layer,the hidden layer,and the output layer in the training process.The SSA is then used to search for optimal weights and bias.The initialized sparrow population parameters include the number of sparrow populations,the proportion of discoverers,the warning value,the maximum number of iterations.The fitness function of the SSA can be set as the neural network"s error function according to the error in the optimization process.Finally,we predict the target"s threat level based on the optimal weights and optimal bias.The flow chart of the whole optimization process is shown in Fig.4.
The optimization process can be further explained as follows.
(1)Calculate the sparrow"s fitness value,and determine its individual extreme value and the global optimal extreme value.
(2)Use Eqs.(14-16)to update the sparrow"s position,and obtain the updated value of the sparrow"s fitness.
(3)Repeatedly update the sparrow"s individual extreme and global extreme value according to the new fitness values.
(4)Return to(2)if the expected condition is not met.
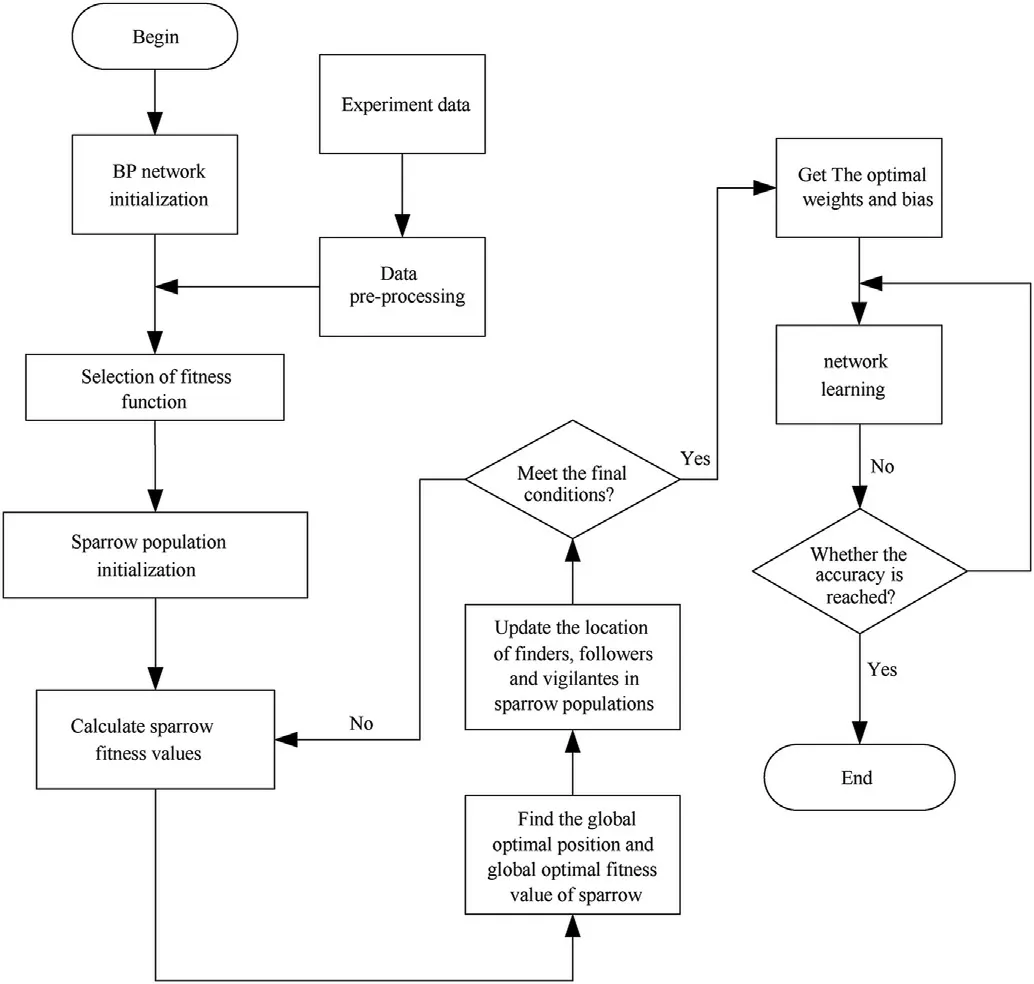
Fig.4.The flow chart of the optimization process.
(5)The SSA is finished when the error reaches the desired value,or the iteration number reaches the set maximum number.At this time,the weights and bias of the BP are set according to the obtained optimal results.
The influencing factors of the target"s threat are target type,electromagnetic attributes,velocity,heading angle,distance,altitude,commander emotion.The neural network structure of the SSA-BP is shown in Fig.5,where these 7 factors are the SSA-BP"s 7 inputs,and the threat level is the output.
6.Simulation experiments
The simulation experiments include three parts:target state prediction,commander emotion recognition,and target threat level prediction.Section 6.1 introduces the experimental dataset.Section 6.2 describes the experimental models.Section 6.3 presents the experimental results to prove the PTP-CE"s superiority.
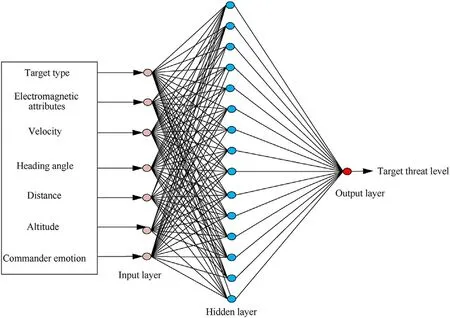
Fig.5.Structure of SSA-BP network.
6.1.Experimental datasets
The dataset used in the target state prediction is given in Section6.1.1.Then the dataset employed in the emotion recognition is introduced in Section 6.1.2.At last,the state-emotion dataset used for the threat prediction is given in Section 6.1.3.
6.1.1.Target state dataset
Table 1 lists a set of measured target data used in the state prediction experiment,which refers to Ref.[12].Table 2 lists the target"s inherent attributes,which are nonnumeric.
6.1.2.Commander emotion dataset
The dataset is composed of the images derived from the internationally common FER2013 dataset[32].We only adopt the 5 type of emotions due that the commander rarely shows fear and disgust through his long-period training.As the commander"s front facial images can be captured clearly from the camera in the control room,we only need to collect some images from this dataset according to the actual scenario.Namely,the 675 images are selected from this dataset and reclassified into 5 categories according to the 5 types of emotion(anger,sadness,normal,happiness,and surprise),where each category has 135 images.In the subsequent model training,the training set,validation set,and test set are divided according to the ratio of 6:2:2.
6.1.3.Threat level prediction dataset
The original threat level dataset of the target is from Ref.[33].It is obvious that the commander with different emotions will has different working productivity.The commander with anger is the most irrational and has lowest productive.The commander with normal has common productive because he can be calm to deal with any targets.However,the commander with surprise has the most productive in that he would be in a special situation where he is not expected and not experienced.The targets in this situation must be urgent.The commander should deal with the target rapidly and his attention thus will be more intensive than that he is in normal.
The dataset should consider not only the state relationship of the target,but also the influence of the commander"s emotion.Therefore,we add 5 different emotions for each piece of the data in this dataset and obtain 375 threat datasets finally.As the emotion"s effect on the threat level is a non-linear and complicated process,we also modify the threat level by a comprehensive analysis for the target"s attributes such as speed and distance,as well as the sanity level of the commander"s emotion.Table 3 shows some of the data from the final threat level dataset.

Table 1Real-time data on target status.

Table 2Inherent attributes of the target.

Table 3Some data from threat level prediction dataset.
We adopt G.A.Miller"s 9-level quantization theory to quantify the above dataset.
(1)Target type:quantified as 3,5 and 8 in order of large targets(fighter-bombers,et),small targets(stealth aircraft,et)and helicopters.
(2)Velocity of the target:quantified as 1-9 in order by 0 m/s~1800 m/s(equal interval of 200 m/s).
(3)The heading angle of the target:quantified as 9-1 in order by 0-36°(equal interval of 4°).
(4)The electromagnetic attributes of the target:strong,medium,weak,and none quantified as 2,4,6,and 8.
(5)Target altitude:ultra-low(0-0.1 km),low(0.1 km-1 km),medium(1 km-7 km)and high quantified(>7 km)as 2,4,6 and 8,respectively.
(6)The target"s distance:quantified as 9-1 in order by 0 km-450 km(equal interval of 50 km)).
At last,the commanders"emotions are set as 10,8,6,4,and 2,representing anger,sadness,normal,happiness,and surprise,respectively.
By using the above quantification,the training set and the test set can be mean normalized.The mean normalized mapping relationship is as follows.

wherex,y∈Rn,xmin=min(x),xmax=max(x),The raw data are normalized to the range[0,1]after normalization.After quantile normalization of the data,a standard target feature-emotion dataset can be obtained.Finally,we randomly select 360 sets of data as the training set and 15 sets of data as the test set.
6.2.Experimental models
In the target state prediction,the training set is from time 1 to time 51,and the test set is from time 52 to time 61.To train the BiLSTM by real-time data,we set a time window of sizep=4.The number of cells for the BiLSTM is 50.Besides,the number of training epochs is 200 rounds.
In the emotion recognition,we adopted the standard LeNet network[31]to avoid large computational cost.The LeNet can extract features by using some clever operations such as convolution,parameter sharing,pooling,and using a fully connected neural network for classification and identification.
In the target"s threat level prediction,we input the final standard dataset in section 6.1.3 into the SSA-BP.The BP neural network topology is set as 7-15-1 because a 3-layer network can work well in almost all pattern recognition applications.The relationship of the nodes between the input layer and the hidden layer in the BP is described as an empirical formula:

wherenidenotes the number of nodes in thei-th layer,andni+1denotes the number of nodes in the(i+1)-th layer.The number of nodes in the hidden layer is set to 15.
After initializing the BP,we initialized the sparrow population.As the BP neural network topology is set as 7-15-1,it means the dimensions we optimize are 136.In equation(11),d=136,n=20.In Eq.(14),R2=0.6.The proportion of discoverers to 0.7,the proportion of sparrows aware of the danger to 0.2,and the maximum number of iterations to 30.The value ranges of the weights and bias is(-1,1).
6.3.Results
Section 6.3.1 describes the result of the state prediction.Section 6.3.2 describes the result of the emotion recognition.Then the potential threat level of the target is given in Section 6.3.3 by using the model of the SSA-BP.At last,the comparisons of the SSA-BP with the other models for target threat prediction are given in Section 6.3.4.
6.3.1.Target state prediction
The state data from time 52 to time 61 are predicted in the first 51 s.The mean square error(MSE)is introduced to evaluate the BiLSTM between the actual and the predicted values.The MSEs of distance,velocity,heading angle,and altitude are obtained from time 52 to 61.Since all features in each second are correlated,we calculate the average MSE of all features in each second.The experimental results are shown in Table 4,which shows the MSE in every second obtained by the BiLSTM and the LSTM,respectively.Although their MSEs both increase with time,the MSE of the BiLSTM is always smaller than the LSTM.In particular,the MSE of the BiLSTM is 1.7 at the 52 nd s.Besides,to prevent the occasionality influence from the parameters’randomization of the neural network,we have conducted 10 repetitions of the experiment for these data,respectively.Moreover,the average MSE is calculated for the 10 experiments.The average MSE of the BiLSTM is 99.18,which is significantly smaller than the average MSE of LSTM 138.2.
6.3.2.Commander"s emotion recognition
The learning curves of the emotion recognition are shown in Fig.6(a and b).It can be found that their accuracy and the loss value tend to be stable as the training rounds increases.Moreover,the LeNet tested on the test set can be up to an accuracy of 82.2%and a loss value of 0.90.
6.3.3.Potential threat level
According to the target"s data in the 58-th,59-th,60-th,and 61-th second,the BiLSTM can predict the target"s state in the 62-th second shown in Table 5.As the inherent attributes are nonnumeric and not changed significantly in a short time,we can treatthe data in Table 2 as the data at the 62-th second.Besides,as a qualified commander,his emotion will not change significantly in a short time.We can regard the emotion recognized in the 61-th second as the 62-th second.Finally,we combine Table 2,Table 5 with all kinds of the emotion,the potential threat level of the target in the 62-th can be obtained as Table 6 by the SSA-BP.
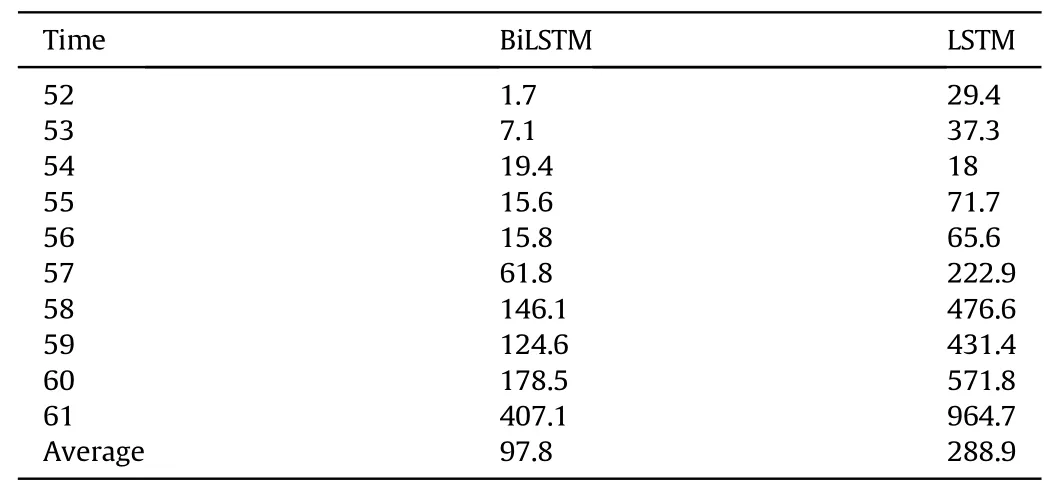
Table 4MSEs for BiLSTM and LSTM from time 52 to time 61.
6.3.4.The comparisons of the SSA-BP with the other models
The SSA search result is shown in Fig.7,where the overall error decreases rapidly with the iteration number increases.Moreover,the test conducted on the test set can get a distribution curve of prediction errors which is shown in Fig.8.It is superior that the errors of the SSA-BP are all closer to 0.
We also compare the true threat level with other three models on the test set.The comparison graph is shown in Fig.9,where the predicted values of the SSA-BP are closer to the true value than the other models.
The performance of the models is also tested by the MSE,as shown in Fig.10.Obviously,the SSA-BP model has higher accuracy than the GRNN,GA-BP.To fully evaluate the stability of the SSA-BP and prevent the occasionality influence from the parameters’randomization of the neural network,we also perform 10 experiments on each model separately and compute the average MSE of each model shown in Fig.10.It is evident that the average MSE of the SSA-BP is smaller than the other models.
7.Discussion
The personalized recommendation considering emotional impact has been widely applied in related fields[34-36].For instance,the intelligent driving technology taking driver"s emotions into account can effectively avoid traffic accidents.Also,our approach for the target"s potential threat level prediction has a similar role for these generic domain models.The goal is that the commander can be better survival in the battlefield.Therefore,our approach has some advantages described in the below.
(1)For the target"s state prediction,the prediction error of the BiLSTM is smaller than the LSTM,according to Table 4.For example,the MSE at 52 s is only 1.7.Although the MSE of the BiLSTM after 53s is relatively large,it is still reliable because the closer between the predicted time and the present time is,the smaller the BILSTM"s prediction error is.Therefore,the BiLSTM can effectively predict the changing trend of the target"s states.

Table 5Predicted data on time 62.

Table 6Potential threat level.
(2)For the emotion recognition,it is easy to find from Fig.6 that the network has converged when the number of iterations reaches 400 rounds.Although our experimental accuracy on the test set is only 82.2%,the international common FER2013 dataset"s accuracy is generally only about 70%.In addition,the image data from FER2013 dataset are captured from multiple people and many of them are very ambiguous,while the commander"s facial images are captured from only a few people in the ship and all of them can be highdefinition.Therefore,the recognition accuracy of the CNN can be significantly improved in the actual combat and command scene.
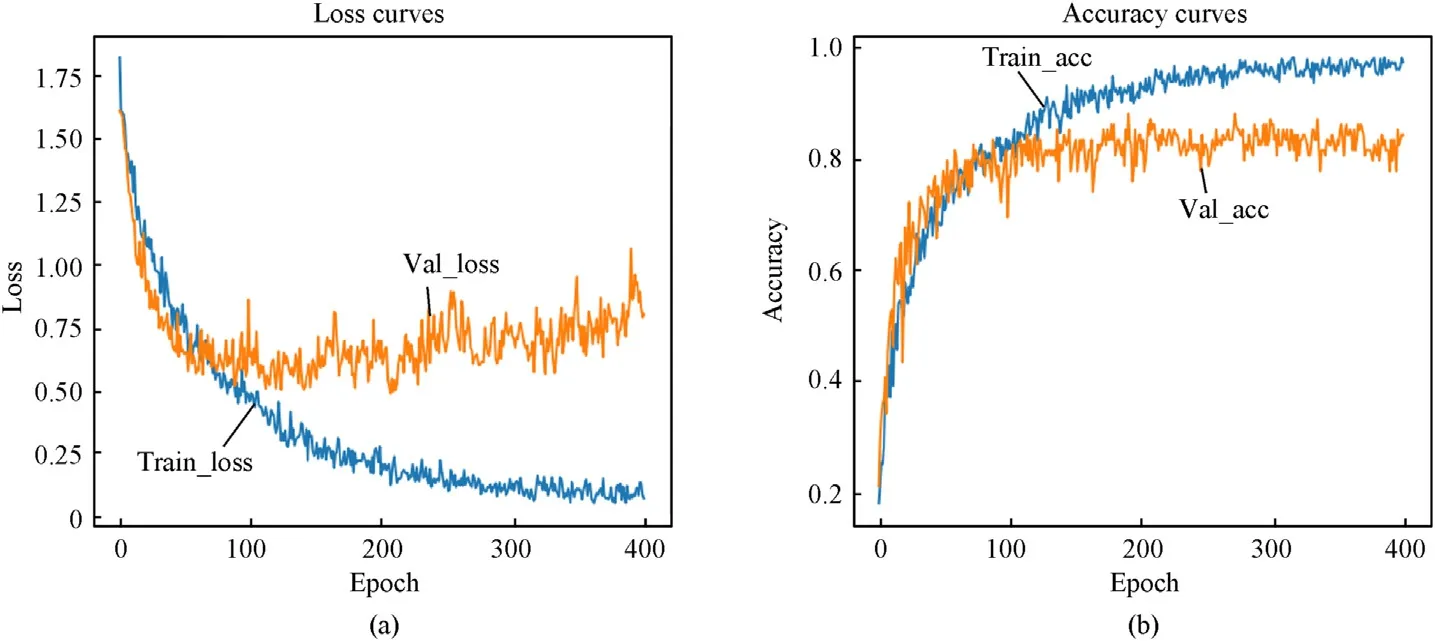
Fig.6.Learning curves of the emotion.

Fig.7.Search result of the SSA.

Fig.8.Prediction errors of different models.
(3)For the threat level prediction,the prediction accuracy of the SSA-BP is higher than that of the GA-BP,the BP,and the GRNN from Figs.7 and 8,which demonstrates that the SSA has more robust performance to solve the global optimal solution problem.In addition,we can get more precise results for the target"s threat level in the 62nd-second in Table 5.
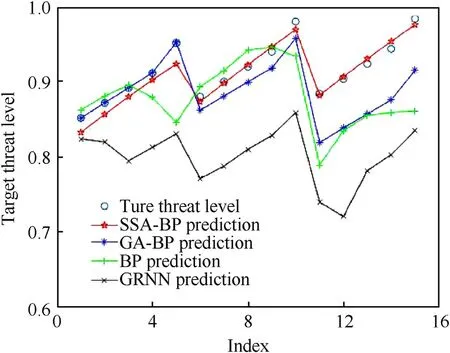
Fig.9.Comparison graph of different models.

Fig.10.MSE and the average MSE of different models.
8.Conclusion
Aerial target"s potential threat prediction is the bias for a commander to perform situation analysis and firepower allocation in a complex battlefield.The current research is limited in predicting the present threat of the target,and ignores the commander"s emotion.Therefore,this paper presents a PTP-CE method to predict the potential threat level of aerial targets intelligently and efficiently.The significant innovation is that the SSA-BP module is adopted to combine the commander"s emotion with the target"s state to implement a more comprehensive threat prediction.The PTP-CE combines the advantages of the BiLSTM and the backpropagation neural network optimized by the sparrow search algorithm(SSA).The target"s future state is predicted by the BiLSTM network from real-time series data.Moreover,the SSA-BP can combine the target state with the commander emotion to establish the threat model.The potential target threat level is thus obtained from the predicted state and the recognized emotions by the SSABP model.We have compared the PTP-CE with some other methods to prove its performance.
Future work will focus on improving the PTP-CE to deal with multiple targets simultaneously.
Declaration of competing interest
The authors declare that they have no known competing financial interests or personal relationships that could have appeared to influence the work reported in this paper.
Acknowledgements
This work was supported by the National Natural Science Foundation of China(No.61873196 and No.61501336),the Natural Science Foundation of Hubei Province(2019CFB778),the National Defense Pre-research Foundation of Wuhan University of Science and Technology(GF202007)and the Postgraduate Innovation and Entrepreneurship Foundation of Wuhan University of Science and Technology(JCX2020095).
杂志排行
Defence Technology的其它文章
- Defence Technology
- Visual-simulation region proposal and generative adversarial network based ground military target recognition
- Preparation and characterization of HMX/NH2-GO composite with enhanced thermal safety and desensitization
- Interception probability simulation and analysis of salvo of two electromagnetic coil launched anti-torpedo torpedoes
- Damage behavior of the KKV direct hit against fluid-filled submunition payload
- Formation of adiabatic shearing band for high-strength Ti-5553 alloy:A dramatic thermoplastic microstructural evolution
