Gorkha earthquake (MW7.8) and aftershock sequence:A fractal approach
2022-11-03RamKrishnaTiwariandHariharPaudyal
Ram Krishna Tiwari and Harihar Paudyal
1 Central Department of Physics, Tribhuvan University, Kirtipur, Kathmandu 44618, Nepal 2 Birendra Multiple Campus, Tribhuvan University, Bharatpur, Chitwan 44200, Nepal
ABSTRACT On April 25,2015,Nepal was struck by the MW7.8 Gorkha earthquake followed by an intense aftershock sequence.It was one of the most destructive earthquakes in the Himalayan arc,causing more than 8 900 fatalities.In this study,we analyzed the dataset (429 events,magnitude of completeness (Mc) ≥ 4.2 local magnitude) of the first 45 days after the Gorkha earthquake to estimate the seismicity parameters b-value,D-value,and p-value.We used the maximum likelihood method to estimate the bvalue and Omori-Utsu parameters,whereas the correlation integral method was applied to estimate the fractal dimension (Dvalue).The analysis was carried out using running and sliding window techniques.The lowest b-value (0.57 ± 0.04) and the highest D-value (1.65 ± 0.02) were computed at the time of the Gorkha earthquake,after which the b-value significantly increased to a maximum of 1.57.It again dropped to 0.93 at the time of the major aftershock on May 12,2015.The D-value showed an initial quick drop and then decreased in a wavy pattern until the end of the study period,indicating the clustering and scattering of earthquakes in a fault region.The b-value contour map identified the eastern part of the study area as a high stress region (b=~0.8),implying that the stress shifted to that region.The D-value contour map reveals that the seismogenic structure shifted from linear to planar in the region.The rate of aftershock decay (p=0.86 ± 0.04) for a short period reflects that the level of stress decreased rapidly.This study helps to understand the level of stress and seismicity pattern of a region,which could be useful for aftershock studies.
Keywords: Omori-Utsu law;correlation integral;fractal dimension;b-value;central Himalaya.
1.Introduction
Earthquakes are a manifestation of complex non-linear threshold dynamics in the brittle part of Earth’s crust.Multiple feedback cycles,such as crustal deformation,crustal shortening,and post-seismic creep,occurring over millions of years beneath the Himalaya have evolved into a non-linear dynamic system that may cause earthquakes(Shcherbakov et al.,2005,2015;Dal Zilio et al.,2021).Therefore,the Himalayan orogeny,delineated by major continental thrusts,is a natural laboratory for the study of earthquake systematics.Despite their complexities,earthquakes can be considered as a point process in space and time that occurs within seismically dynamic fault sectors (Ogata,1999;Ogata and Tsuruoka,2016).Moreover,these sectors are complex systems with heterogeneously distributed stress and strength (Huang J and Turcotte,1988).The continuous process of slow energy accumulation and fast energy redistribution inside the crust drives it towards the self-organized critical point,i.e.,the mainshock (Mandal and Rastogi,2005;Teotia and Kumar,2011;Pastén et al.,2015;Aggarwal et al.,2017).
The spatiotemporal distribution of earthquake epicenters is fractal (Turcotte,1989;Dimri,2005;Nampally et al.,2018).Fractal scaling relation is used to characterize the mathematical expression of the natural pattern of an earthquake;therefore,it can be used to study the seismicity of a region.Numerous studies have been conducted in the factors that trigger earthquakes.This study focuses on three of the most used techniques,i.e.,determining thebvalue of the Gutenberg-Richter relation,fractal dimension orD-value,andp-value of the Omori-Utsu relation(Bachmann et al.,2012;Jena et al.,2021),to study earthquake distribution in the Himalayan region.These scaling exponents obey fractal statistics,and their behavior can be considered as the end-product of a self-organized critical state of the Earth’s crust at the time of the mainshock.This study estimates the stress level,frequency,and patterns of earthquakes of the region between 26.5°N–29°N latitude and 84°E–87°E longitude in the central Himalaya.
1.1.b-value estimation
Theb-value in the Gutenberg-Richter frequencymagnitude relation (Gutenberg and Richter,1944;Huang J and Turcotte,1988;Dimri,2005) is the power law indicating a self-similar fractal property of earthquakes.This relation can be expressed as

whereNis an integer describing the number of earthquakes per unit time,with magnitudes greater than or equal tomfor a given time and space.The constant “a” denotes the seismicity and the constant “b” denotes the level of stress in the region.Theb-value is the ratio of the number of weak and strong events,and is estimated to be 0.8–1.2(Enescu and Ito,2002;Enescu et al.,2011).An increasedb-value denotes a rise in the number of weak events compared to strong events,and vice versa (Caneva and Smirnov,2004).Several studies have shown orderly variations inb-values throughout major earthquake sequences,with changes in the ambient stress level and fractal dimension of the stress-strength distribution (Jiang HK and Diao SZ,1995;Yeken,2016;Nava et al.,2017;Hussain et al.,2020).It was observed that major earthquakes generally happen in areas with smallb-values(El-Isa and Eaton,2014;Wang R et al.,2021),which varies with time showing a decreasing trend before major earthquakes (Smith,1981;Rehman et al.,2015;Chiba,2019;Jena et al.,2021).
1.2.Fractal dimension
It is believed that a straight line,plane,and volume have dimensions of 1,2,and 3,respectively.However,if we consider a rough surface covering a part of a plane,its dimensions would lie between 1 and 2,and a rougher surface corresponds to dimensions close to two.Fractals are rough objects with no specific scale,and cannot be described using traditional measurement procedures,i.e.,length or area.The concept of fractal dimension was proposed during a problem encountered while measuring the length of a coastline (Mandelbrot,1967;Mandelbrot and Wheeler,1983).Fractal methods describe the properties of an object by estimating its fractal dimension(Chen YG and Wang JJ,2013).A smaller value of the fractal dimension represents smooth coastlines,while a larger value represents rugged coastlines (Smalley et al.,1987).In fractal distribution,the number of objectsNwith a characteristic size greater thanrcan be expressed as
whereDis the fractal dimension andCis a proportionality constant.Fractal statistics are associated with several natural processes (Mandelbrot,1967;Mandelbrot and Wheeler,1983;Goltz,1997;Malischewsky,2014).For earthquake distribution,theD-value characterizes the degree of homogeneity of spatial events,and its decrease suggests the grouping of earthquake events (Caneva and Smirnov,2004).Several authors have observed a decrease in the value of the fractal dimension before a large earthquake (Wyss et al.,2004;Fayou et al.,2010;Ghosal et al.,2012;Hamdache et al.,2019;Yin LR et al.,2019).Fractal dimensions increase with an increase in the differential stress and decrease with the evolution of the fracture process (Lei XL and Kusunose,1999;Chingtham et al.,2016;Firoozfar and Ansari,2019;Lei XL,2019).The spatial correlation dimension,a lower level of fractal dimension,is ameasure of scaling in the spatial distribution of events,and is calculated by defining the correlation integral functionc(r) for the epicenter distribution (Roy and Padhi,2007;Roy and Mondal,2009;Mondal et al.,2019) as follows:
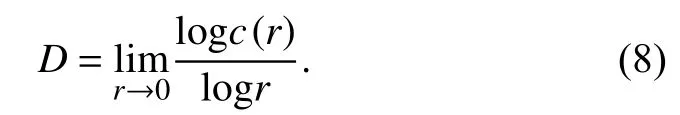
whereNis the total number of earthquakes in the given window,Xi-Xjisthe angular distance between two events calculated by the spherical triangle method (Hirata,1989),H(·) is theHeaviside step function,andris the scaling radius.Aftercalculatingc(r),the spatial correlation dimension can be defined from the power-law relation (Kagan,1981,2007;Kagan and Houston,2005):
The slope of the linear part of the logr-logc(r) plot provides the correlation fractal dimension (D),as explained in the data and methodology section.
1.3.Omori-Utsu law
Aftershocks are manifestations of relaxation phenomena observed in various physical systems,such as solar flares,acoustic emissions,and seismicity.In seismicity,aftershocks indicate that the total strain energy was not released by the mainshock of the earthquake.Occurrence of aftershocks in a brief period and in small areas provide information about the Earth’s crust and helps understand the mechanism of earthquakes.Omori Law (Omori,1894;Žalohar,2018) states that the frequency of aftershocks decays with time in a hyperbola that involves the statistics of both mainshocks and aftershocks,indicating that they are created by the same mechanism.After being replaced by a power-law function (Utsu,1969;Utsu et al.,1995;Guglielmi,2016,2017),it can be written as
whereK,c,andpare constants that represent the number of observed earthquakes,rate of decay,and delay of the decay,respectively;tis the time since the mainshock andn(t) is the aftershock frequency measured over a certain interval of time.This equation can be temporally integrated to estimate the expected number of aftershocks.
This decay law reflects the temporal self-similarity of earthquake source processes.pvaries according to the heterogeneity,stress,and temperature of the crust (Mogi,1967;Trivedi,2015;Guglielmi,2016).It widely differs among different locations and cases,indicating the rapid rate of decay of aftershocks,and has a value close to 1.0.For example,p-values denoting seismicity are usually in the range of 0.8 to 1.2 (Utsu et al.,1995),and ap-value of 0.5–1.5 was observed for the earthquake study in California (Reasenberg and Jones,1989;Guglielmi,2016).Generally,a reliablep-value is required to understand the mechanism of stress relaxation and the friction law in seismic zones (Hainzl et al.,1999;Helmstetter and Shaw,2006).The parameterKrepresents productivity,while the constantcis necessary to avoid singularity in the number of aftershocks.However,the value ofcand its significance remain debatable.It has been suggested that the value ofcis essentially zero,and all reported positive values are owing to incomplete sequencing in the early stage of an aftershock (Utsu,1971;Utsu et al.,1995).
The Himalaya is divided into four litho-tectonic units,from north to south: the Tethyan Himalaya,Higher Himalaya,Lesser Himalaya,and Sub-Himalaya (Figure 1).These units are separated by the South Tibet Detachment(STD),Main Central Thrust (MCT),Main Boundary Thrust (MBT),and Main Frontal Thrust (MFT),respectively (Bai L et al.,2016).The MCT is the oldest thrust in the Himalayan region,and was activated at~22 Ma followed by reactivation~15 Ma and 6 Ma (Yin A et al.,2010).The MFT and MBT also run along the strike of the Himalaya,and the MFT is the youngest of the three.
The slip along a major basal thrust,the Main Himalayan Thrust (MHT),which surfaces along the front of the Himalayan foothills,contributes majorly to the convergence rate between the Indian and Tibetan plates across the Himalaya (~17–21 mm/a) (Ader et al.,2012;Mugnier et al.,2013).The MFT,MBT,and MCT are believed to be attached to the MHT at the deeper level(Bilham,2015,2019;Elliott et al.,2016;Dal Zilio et al.,2021;Michel et al.,2021).MHT is one of the largest(~2,400 km long),and fastest slipping active continental megathrusts that separates the underthrusting Indian Plate from the overriding Himalayan orogeny.Most earthquakes have occurred in the frictionally sealed part of the MHT in the roots of Nepal Himalaya (Pandey et al.,1995;Mugnier et al.,2013;Bilham,2019;Ghosh,2020).
Located in a seismically active region,Nepal has hosted several large earthquakes in the past.The first documented earthquake occurred on June 7,1 255,and had a magnitude of 7.8.The next recorded major earthquake occurred in 1 260,and had a magnitude of 7.1 in the Mt.Everest region (Chaulagain et al.,2018).The 1 408 earthquake of magnitude 8.2 is another mega event that killed around 2 500 people.The devastating earthquake of 1 767 (M7.9) took 4 000 lives.TheMS8.0 Kathmandu-Bihar earthquake of August 26,1833 struck Nepal and the northern part of India and was equally devastating,taking 6 500 lives (Martin et al.,2015;Bilham,2019).On January 15,1934,the greatest earthquake (MW8.0) of modern times,known as the Nepal-Bihar earthquake,occurred in the eastern mountains of Nepal.The Udayapur earthquake(MW6.9) in 1988,240 km southeast of the Gorkha event,led to~1 500 fatalities (Chen H et al.,2017).
On April 25,2015,a major earthquake (MW7.8)occurred in the Himalayan region of central Nepal(Adhikari et al.,2015;Baillard et al.,2017).The event was followed by thousands of aftershocks,with some of them even having magnitudeMW> 6,and it triggered theMW7.3 event (Kodari earthquake) to the east 17 days after the mainshock.Aftershocks were generated at the boundary of these ruptures,predominantly in the droopy part of the MHT (Letort et al.,2016;Miyake et al.,2017;Yamada et al.,2020).The Gorkha and Kodari events are the latest major earthquakes in the Himalaya,and the best-recorded events in the region (Figure 1).The amount of energy dissipated by these events to nearby faults is sufficient to activate earthquakes in adjacent areas (Avouac et al.,2015;Bilham et al.,2017).This study attempts to understand the behavior of the aftershocks to examine the future seismicity pattern.
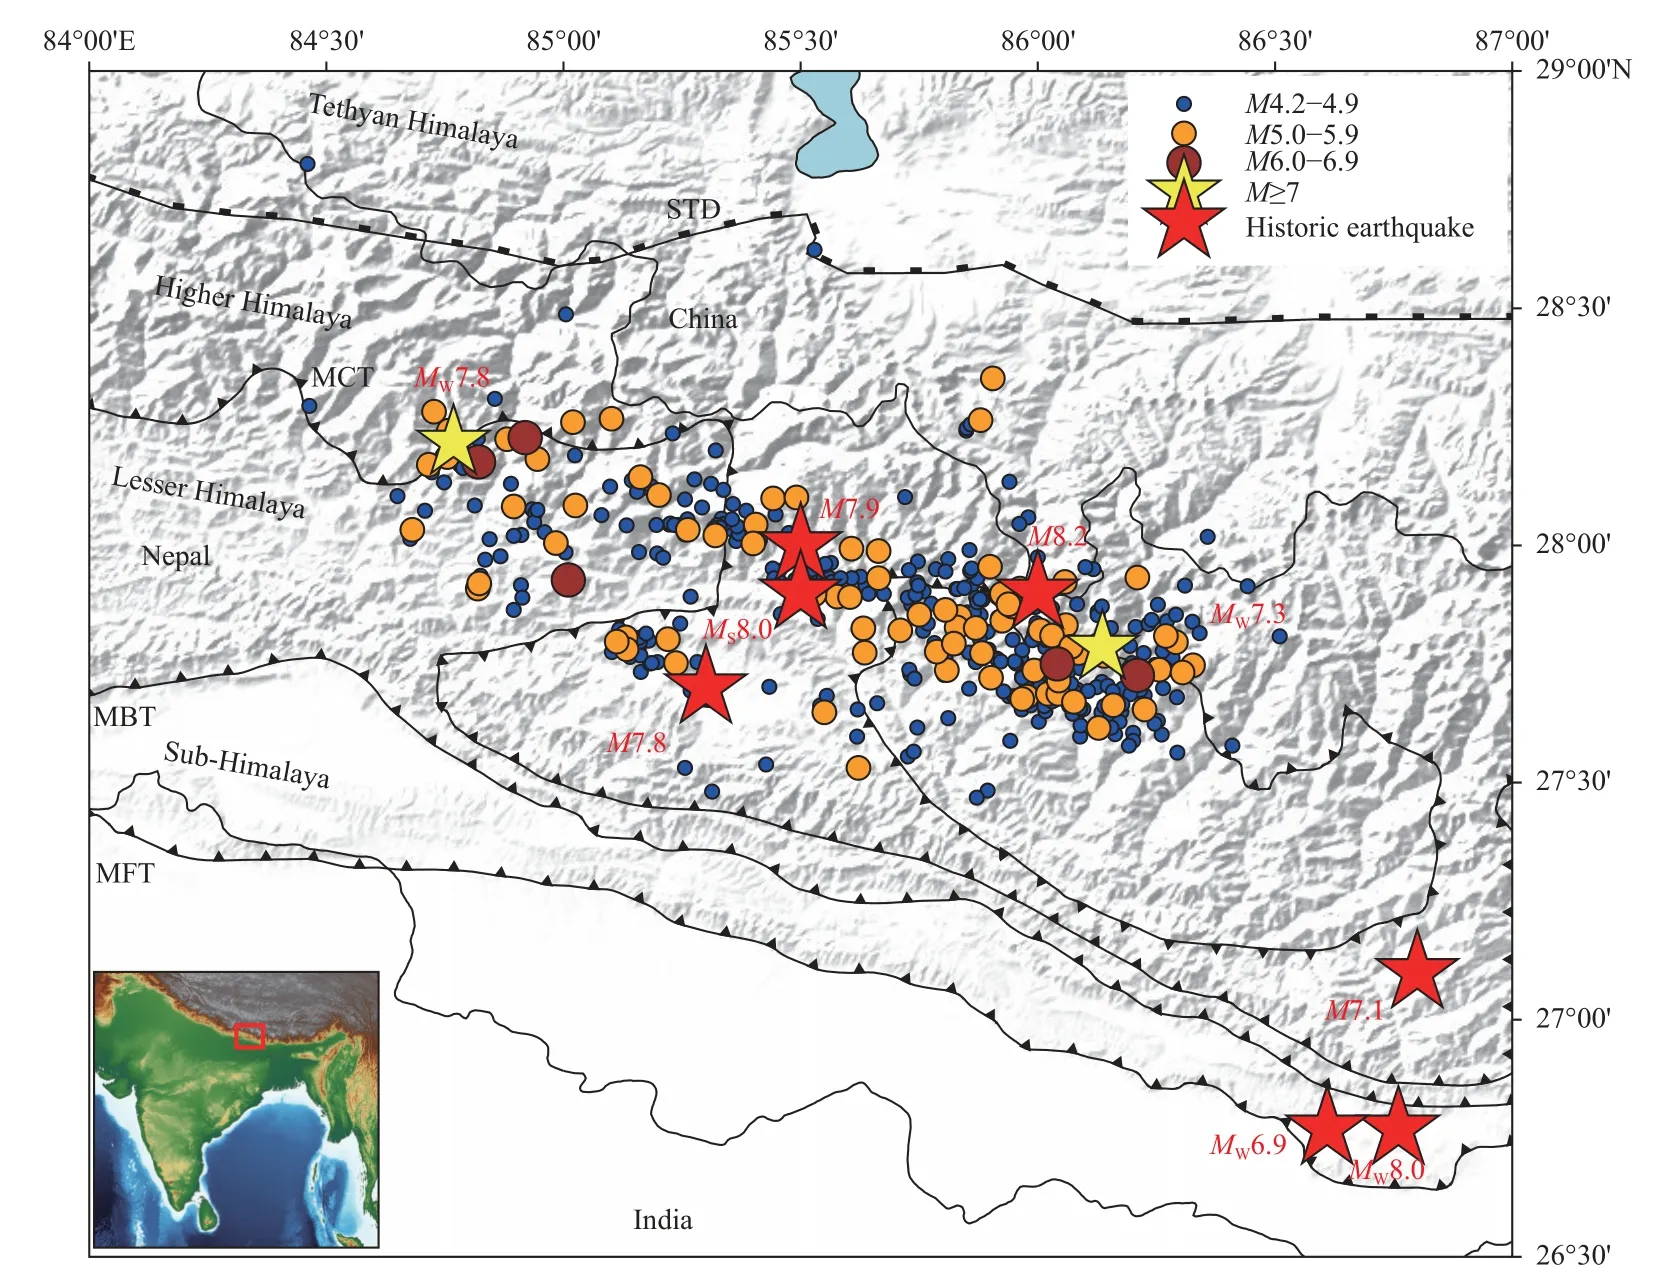
Figure 1.Epicenter location of the 429 earthquake events.Yellow stars stand for the MW7.8 Gorkha earthquake and its largest aftershock,the Kodari earthquake (MW7.3).MCT: Main Central Thrust,MBT: Main Boundary Thrust,and MFT: Main Frontal Thrust.Red stars represent historical earthquakes in the region.M7.8: 1 255 Kathmandu earthquake,M7.1: 1 260 Everest earthquake,M8.2: 1 408 Nepal-Tibet earthquake,M7.9: 1 767 northern-Bagmati region earthquake,MS8.0: 1833 Kathmandu-Bihar earthquake,MW8.0: 1934 Nepal-Bihar earthquake,and MW6.9: 1988 Udayapur earthquake (Goda et al.,2015;Chaulagain et al.,2018).The red box in the inset map marks the study region.
2.Data and methodology
In this work,earthquake data for the first 45 days after the Gorkha earthquake (2015-4-25–2015-06-07) was analyzed.Earthquake data were collected from the local network of the National Seismic Center,Nepal (Adhikari et al.,2015).The total number of recorded earthquakes in the catalog was 554.Completeness of the data was estimated to be 4.2 using the maximum curvature technique in the software ZMAP (Wiemer,2001).Therefore,the final dataset comprised 429 earthquakes with magnitude of completeness 4.2 (Figure 2).For the accuracy and precision of the estimatedb-value andDvalue,a time window of 100 events was considered,having an interval of 20 events (Table 1).

Figure 2.Frequency magnitude (b-value) and magnitude of completeness (Mc) of the earthquake’s distribution.
The temporal distribution of magnitude and 3D distributions of the earthquakes are depicted in Figure 3.
Theb-value of the frequency magnitude distribution was calculated using the maximum likelihood estimation method (Aki,1965;Bender,1983)

whereMais the average of all magnitudes,ΔMis the binning width of the catalogue,and the standard error in theb-value calculation is computed using the technique by Shi YL and Bolt (1982).
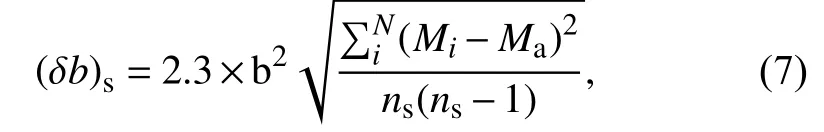
wherensis the number of earthquakes in the given sample.
The fractal dimension was calculated using the correlation integral method (Grassberger and Procaccia,1983).The correlation dimensionD,in terms of the correlation sumc(r) is defined as
To demonstrate the fractal nature of the aftershocksequence,we depicted the logr-logc(r) plot for window 1 containing the Gorkha earthquake (2015-4-25–2015-4-25)and window 11 containing the Kodari earthquake (2015-4-27–2015-5-12) (Table 1 and Figure 4).Although,Nerenberg and Essex (1990) provided a formula for selecting the scaling region between depopulation and saturation,we used aconservative approach to identify theD-value for the range ofr∈ [1,38.90] km.
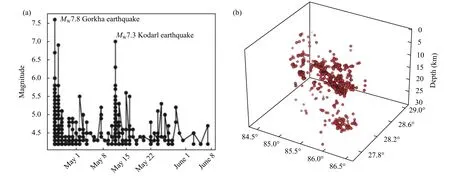
Figure 3.Graphs showing temporal distribution of earthquakes magnitude for the study period (a) geographical distribution of earthquakes along with their depth (b).
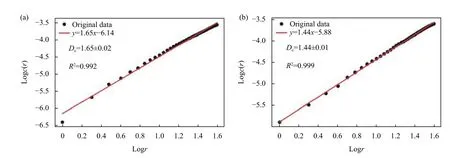
Figure 4.An example of D-value estimation from the correlation integral for the time windows including (a) the mainshock (2015-4-25–2015-4-25) and (b) the major aftershock (2015-4-27–2015-5-12).
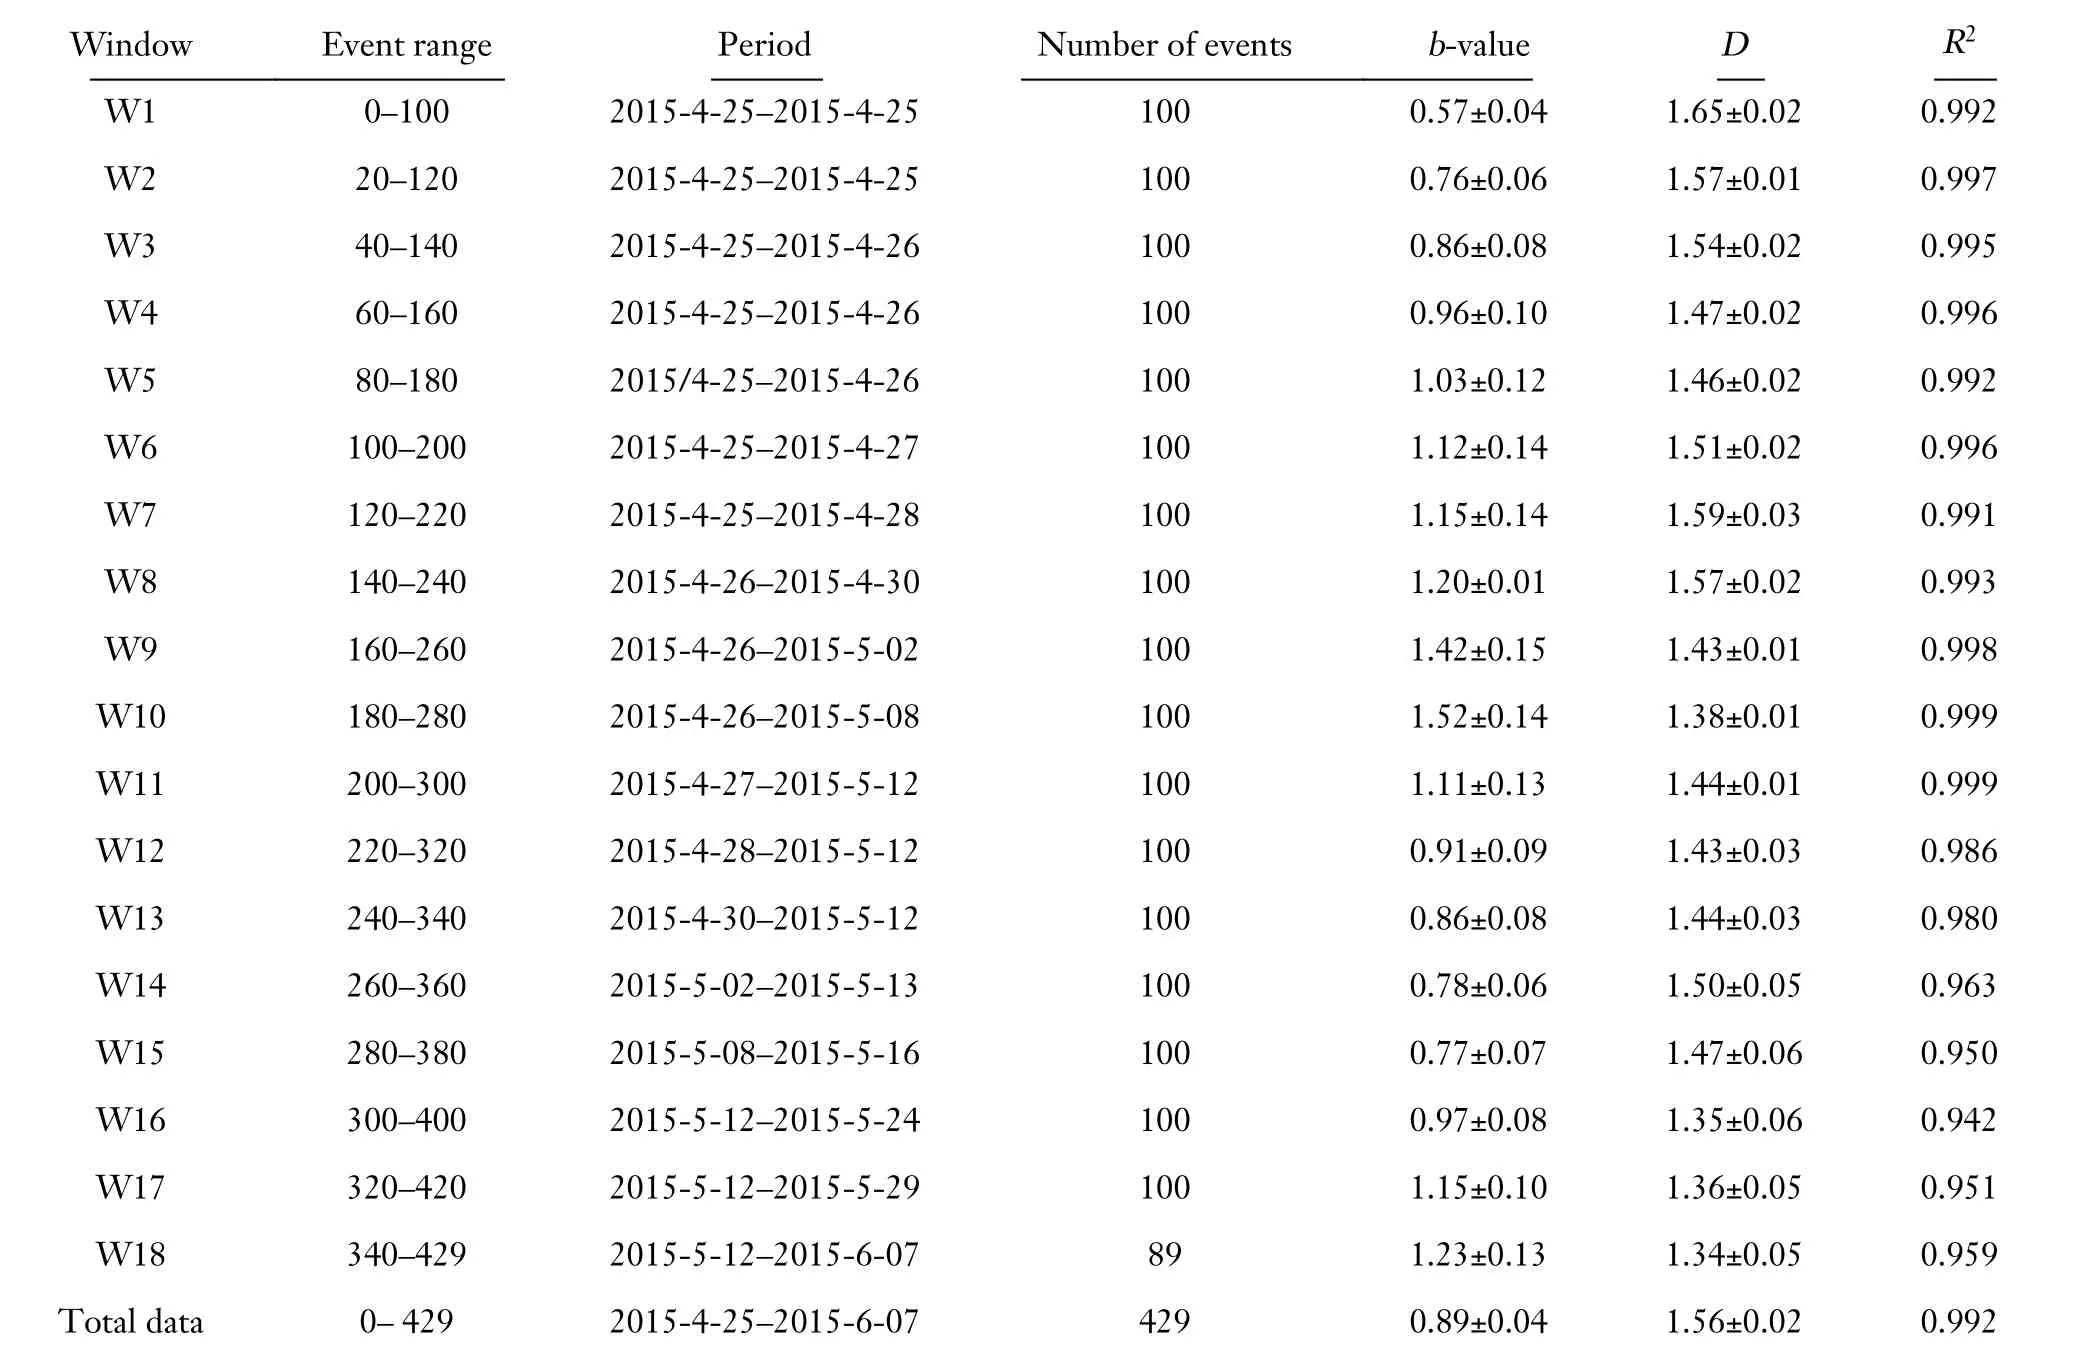
Table 1.Data for the time window,number of earthquakes,frequency size distribution (b-value),correlation fractal dimension (D),and coefficient of determination (R 2).
The parameters of the Omori-Utsu law (p,c,andKvalues) were estimated using the maximum likelihood method (Omori,1894;Utsu et al.,1995).
3.Results and discussion
A significant variation was observed in theb-values from analysis of the aftershock sequence,which increased rapidly after the main shock from 0.57 ± 0.04 to 1.52 ±0.14 within 14 days,and then decreased to 0.77 ± 0.07 till the occurrence of the largest aftershock (Kodari earthquake);subsequently,it increased again to 1.23 ± 0.13 after the Kodari event (Table 1).The drop in theb-value before both earthquakes are consistent with the results of Chingtham et al.(2016),and indicates that the critically stressed fault could be the source of these earthquakes.The increase inb-value after the main event implies that most of the energy was released through the aftershocks,especially toward the east of the main event and might have also activated the nearby faults.
Decrease in theb-value before a large earthquake reflects the fluctuations in the order parameter upon approaching the critical point,i.e.,occurrence of the mainshock (Zhuang JC et al.,2021),and are normally linked to asperities (Oncel and Wilson,2002;Kawamura and Chen KH,2017).Lowb-value during the Gorkha earthquake indicates that the event could have been initiated by breaking of the asperity of the region.This study also showed thatb-values are highly sensitive to variations in temporal stress.At the beginning of the event,theb-value was~0.9,and increased rapidly to 1.55 around May 1,2015 (Figure 5).By May 13,2015,theb-value decreased rapidly to 0.93.b-values <1 indicate areas of crustal homogeneity and high stress,and vice versa(Bridges and Gao SS,2006).Therefore,the increasingbvalue after the Gorkha and Kodari earthquakes indicates that although some stress is released in both events,the material heterogeneity increased in the region and could contribute to moderate to large earthquakes in the future.
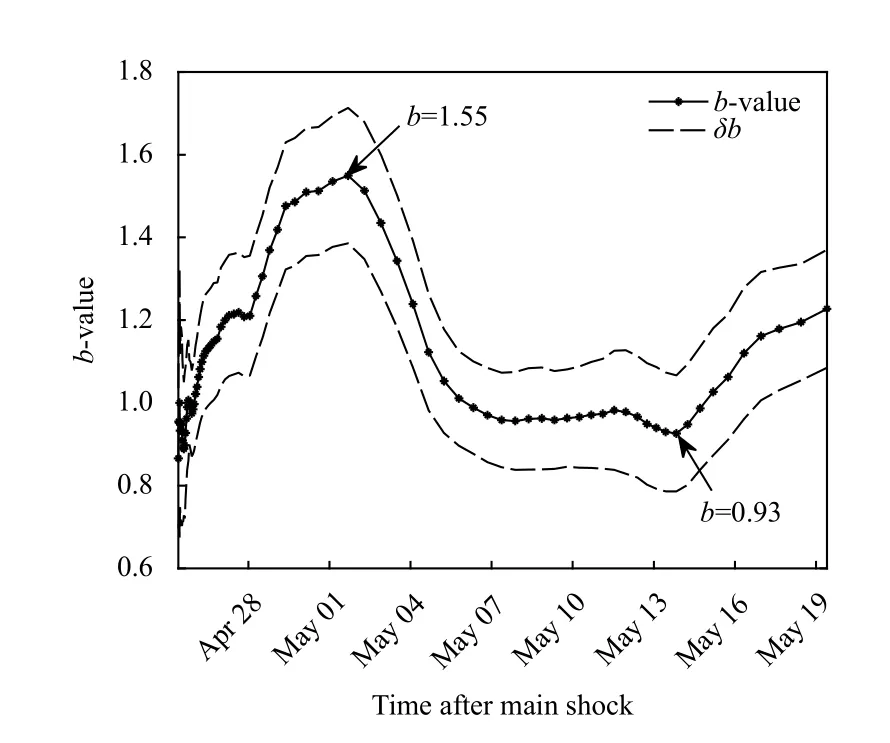
Figure 5.Temporal variation of the b-value for sample window of 100 events with a 4% window overlap.The b-value is maximum after the Gorkha earthquake and decreases by the time of the Kodari earthquake.It rises again after the Kodari earthquake.
Fractal dimension generally fluctuates following a large earthquake (Tang YS et al.,2020).TheD-value range from 1.65±0.02 to 1.34±0.05 (Table 1) observed during period between the Gorkha and Kodari earthquakes may indicate such fluctuations.Decrease in the fractal dimension from 1.65 ± 0.02 to 1.46 ± 0.02 just after the Gorkha event indicates clustering of epicenters during a large event (Bayrak and Bayrak,2012).The limiting value of the dimension can be interpreted asDclose to 0,signifying that the earthquakes are concentrated in a limited area or are sparsely distributed.Dclose to 1 suggests a linear configuration of the epicenters,andDclose to 2 indicates that the earthquakes are densely distributed over the entire area (Rodríguez Pascua et al.,2003;Borgohain et al.,2018;Mondal et al.,2019;Hussain et al.,2020;Tosi,1998).Moreover,it is believed thatDis regulated by pre-existing geological,mechanical,structural,and stress field heterogeneity (Öncel et al.,1996).Therefore,the range of fractal dimension (1.34–1.65)estimated in this study indicates a shift from linear to more planar structure of the seismogenic source,with densely distributed events.The spatial correlation dimensions exhibited one slope,indicating a single source.TheDvalue estimated in this study can be related to the previous work of Nampally et al.(2018),in which a fractal correlation dimension of 1.66 was estimated for 820 aftershocks of the Gorkha earthquake between April 25 and November 12,2015.
Faulting is generally scale invariant,and the fractal dimension (D) of the source can be related to theb-value of the earthquake distribution (Huang J and Turcotte,1988).The temporal variation ofb-value represents differential stress conditions,and the fractal dimension acts as an indicator of material heterogeneity and strength(Srivastava et al.,2015).A sudden decrease in theD-value followed by an increase (Figure 6) immediately after the mainshock can be easily correlated with the clustering and scattering of earthquakes in a fault zone,and reflect the stress accumulation and strain release patterns in the region (Roy and Nath,2007).Increasedb-value (from <0.6 to >1.5) after the Gorkha earthquake may be associated with a decrease in the fractal dimension (from 1.65 to<1.40) of the associated heterogeneities and supports the theory that most of the large earthquakes are marked by relatively a highD-value and lowb-value.The Gorkha event might have witnessed the introduction of small-scale heterogeneities (compared to the size of the fault zone) by stress accumulation after a major shock and led to the associated aftershock sequence.This result supports the findings of Bayrak and Öztürk (2004),where a comparatively lowb-value and highD-value were correlated to a small degree of heterogeneity of the cracked surface,substantial stress,and large faults,with broadly distributed significantly stressed asperities.
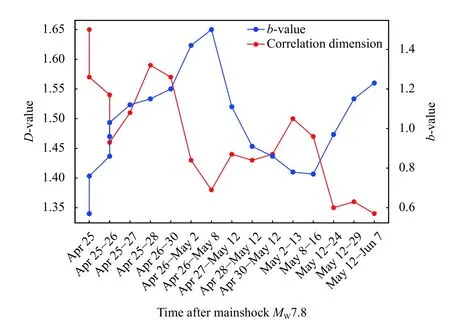
Figure 6.Temporal variation of the D-value and b-value.Time after the main shock is presented along the x axis.
Previous studies have shown both positive and negative correlation between theb-values and the fractal dimension of earthquakes (Ogata,1999;Dimri,2005;Teotia and Kumar,2011).We estimated this correlation to be negative,with the regression functionD=-0.18b+1.66 anda coefficient of determination (R2)=0.243(Figure 7).This indicates that the accumulated stress discharged along the fault zone with a larger surface area,and the medium has not yet achieved a steady state of stress distribution.The negative correlation may have developed in response to an increase in stress (lowerb) and a decline in epicenter clustering,i.e.,an increasedD-value (Oncel and Wilson,2002).Similar type of correlation was also observed for the region in a previous study (Ghosh,2020).Furthermore,a weak correlation was observed between theD-value andb-values for the earthquake epicenter distribution in western Taiwan region as well (Wang JH and Lee,1996)
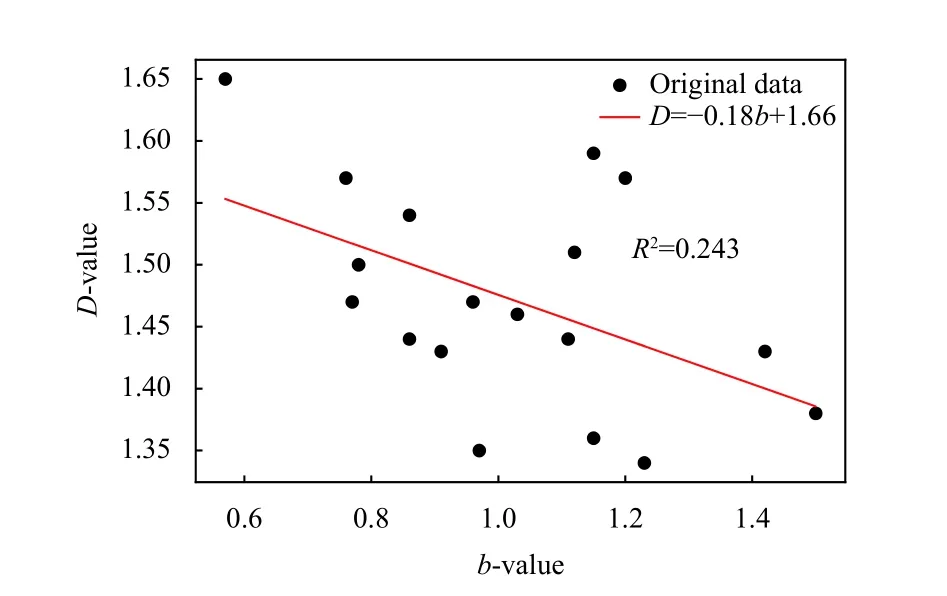
Figure 7.Relationship between fractal dimension (D) and b-value.
Theb-value contour map (Figure 8a) depicts the spatial variation of earthquake frequency in the region.A comparatively lowb-value contour (~0.7–0.9) was observed for the region of 84.5° E–85° E and 28° N–29° N(along the MCT) and the region of 86° E–87° E,27° N–28.75° N.Comparatively highb-value contours (~1.2–1.3)were observed towards the southwest of the study area.The averageb-value in the study area was 1.04.Areas with lowb-value are said to be under high stress,i.e.,slip movement is yet to occur,and vice versa (Enescu and Ito,2002).Mapping of theb-value identified the high stress region towards the west of the Gorkha earthquake and east of the Kodari earthquake,which can be considered as the future seismogenic sources.The fractal dimension (D)value contours reveal spatial variation in the fractal features of the earthquake source.The study area was dominated byD-value contours of~1.4–1.8 (Figure 8b).LowD-value contours (~1.4) were observed for the eastern section of the north-dipping active faults (MCT,MBT,and MFT) within the study area.The averageD-value of the region was observed to be 1.6,indicating that the earthquakes were widely distributed along the fault plane;therefore,the heterogeneity developed in the fault plane may be responsible for triggering the events.Some areas withD-value >1.5 reflect a tendency of planar epicenter distribution and low clustering.The relatively highDvalues and lowb-values along the west of the Gorkha earthquake and east of the Kodari earthquake indicate a more heterogeneous structure.Such values may be the dominant in these regions and may arise from clusters because the uniform distribution of events decreases with their increased clustering.
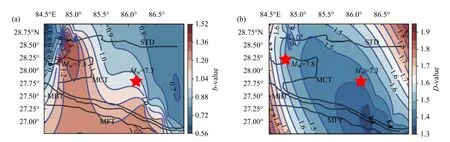
Figure 8.(a) b-value contour map for the study region with major faults STD,MCT,MBT,and MFT,(b) D-value contour map for the study region.Low b-value contour (~0.7–0.9) are observed for the Gorkha (84.5° E–85° E,28° N–29° N) and Kodari (86° E–87° E,27°N–28.75° N) earthquake regions.
Figure 9 depicts the rate of occurrence of aftershocks within 45 days of the Gorkha earthquake,which was observed to rise rapidly within the first 10 days and was followed by a steady increase.The modified Omori parameters (p=0.86 ± 0.04,c=0.005 1 ± 0.019,andK=57.9 ± 3.7) were estimated for the aftershock sequence.The exponentp(0.86 ± 0.04) was low compared to the universal value of 1.0,suggesting that the temporal disintegration patterns of aftershock sequences can be efficiently modeled by the Omori-Utsu law.The lowerpvalue also signified that the study area did not experience significant rupture during the earthquake.The parameters of Omori’s law mainly vary with the faulting style.Lowpvalues and largerKvalues denote thrust faulting events(Tahir and Grasso,2015).Thep-value estimated by this study (0.86) was slightly greater than the values 0.80 ± 0.4 estimated for the 2015 main cluster (Adhikari et al.,2015),0.82 ± 0.02 for thrust faulting events (Tahir and Grasso,2015),and 0.79 ± 0.24 for the 298 aftershocks withmb≥4.0 (Thapa et al.,2018).The smallc-value (0.051 ± 0.019)observed in this study could be the result of a heterogeneous Coulomb stress adjustment (Dieterich,1994;Helmstetter and Shaw,2006).Understanding the decay rate of early aftershocks is significant in aftershock risk assessments (Mignan and Woessner,2012).Therefore,characterization of aftershock parameters (this study)provides useful information for aftershock estimation.

Figure 9.Omori-Utsu parameters and their standard deviations for the 429 aftershocks of the Gorkha earthquake sequence.
4.Conclusions
To determine the seismicity distribution and probability of the occurrence of future earthquakes in central Himalaya,this study analyzed the aftershock sequence of the 2015 Gorkha earthquake covering a period from 2015-4-25 to 2015-06-07.Theb-value and Omori-Utsu parameters (p,c,andK) were estimated using the maximum likelihood method,while the fractal dimension was estimated using the correlation integral method.Very lowb-value was observed during the Gorkha earthquake,after which it increased.Theb-value again decreased at the time of the Kodari earthquake.This reducedb-value before the earthquakes reflects the situation when the stress of the subsurface rock mass reaches a critical value,transforming the stable locked segment into a comprehensive fault failure.Continuous aftershock activity was observed in response to the high-stress level of the underlying crust.
TheD-value rapidly decreased initially,after which an undulating decrease was observed during the study period.This variation can be correlated with the clustering and scattering of earthquakes along a fault.This study suggests that theD-value andb-values can gradually increase and decrease,respectively,before a large earthquake.Thebvalue contour map identified the eastern part of the study region as a high stress region (b=~0.8),implying that the stress shifted to that region.TheD-value contour map reveals that the seismogenic structure (fault) acquires shifts from a linear to a planar structure in this region.TheDvalue correlated negatively with theb-value,indicating that the medium has not yet achieved a steady state of stress distribution.The decay rate of aftershocks (p=0.86 ± 0.04) for a brief period reflects that the stressrelease process is fast,and can be used to evaluate the degree of destruction of the aftershocks.The results of this study are useful for explaining the level of stress patterns in earthquake activity and provide information on aftershock decay.
Acknowledgements
This investigation was funded by the University Grant Commission (UGC) Nepal as a PhD fellowship and supported by Tribhuvan University,Nepal that allowed a sabbatical leave to the author Tiwari RK.The authors would like to thank the two anonymous reviewers and the associate editor for their suggestions on improving the quality of the manuscript.
杂志排行
Earthquake Science的其它文章
- Investigation on variations of apparent stress in the region in and around the rupture volume preceding the occurrence of the 2021 Alaska MW8.2 earthquake
- A comparative study of seismic tomography models of the Chinese continental lithosphere
- Emergence of non-extensive seismic magnitude-frequency distribution from a Bayesian framework
- Correlation between the tilt anomaly on the vertical pendulum at the Songpan station and the 2021 MS7.4 Maduo earthquake in Qinghai province,China