Investigation on variations of apparent stress in the region in and around the rupture volume preceding the occurrence of the 2021 Alaska MW8.2 earthquake
2022-11-03XuezhongChenYaneLiandLijuanChen
Xuezhong Chen ,Yane Li and Lijuan Chen
1 Institute of Geophysics, China Earthquake Administration, Beijing 100081, China
2 Chongqing Earthquake Agency, Chongqing 401147, China
ABSTRACT On July 29,2021,a large earthquake of MW8.2 occurred south of the Alaska Peninsula.To investigate the spatial-temporal changes of crustal stress in the earthquake-stricken area before this event,we selected 159 earthquakes of 4.7 ≤ MW ≤ 6.9 that occurred in the epicentral region and its surroundings between January 1980 and June 2021 to study the temporal variation and spatial distribution of their apparent stress.In addition,we analyzed the correlation between seismic activities and Earth’s rotation and explored the seismogenic process of this earthquake.The crustal stress rose from January 2008 to December 2016.This period was followed by a sub-instability stage from January 2017 until the occurrence of the MW8.2 earthquake.The average rate of apparent stress change in the first five years of the stress increase period was roughly 2.3 times that in the last four years.The lateral distribution of the apparent stress shows that the areas with apparent stress greater than 1.0 MPa exhibited an expanding trend during the seismogenic process.The maximum apparent stress was located at the earthquake epicenter during the last four years.The distribution of the apparent stress in the E-W vertical cross section revealed that an apparent stress gap formed around the hypocenter during the first five years of the stress increase period,surrounded by areas of relatively high apparent stress.After the Alaska earthquake,most parts of this gap were filled in by aftershocks.The seismic activities during the sub-instability stage exhibited a significant correlation with Earth’s rotation.
Keywords: MW8.2 earthquake in Alaska;apparent stress;variation characteristics;Earth’s rotation;correlation.
1.Introduction
The results of rock mechanics experiments indicate that the tectonic stresses at a seismogenic fault and in its surroundings increase during the seismogenic process of a large earthquake and then drop rapidly after the seismic event.Since it is difficult to measure stress values directly at seismic source regions with depths of several to tens of kilometers,direct evidence of stress enhancement at the source region before a strong earthquake is extremely difficult to obtain.Earthquakes excite seismic waves whose signals are affected by both tectonic stress and source characteristics.When the stress on the seismic source is high,the seismic waves generated during the earthquake will be rich in high-frequency components(Aki,1979,1984;Das and Aki,1977;Madariaga,1976;Zuñiga et al.,1987).Therefore,if the tectonic stress increases,the high-frequency components in the seismic waves excited by small earthquakes will be enhanced.Although we are concerned with the ratio of highfrequency to low-frequency content,we can quantify this ratio in terms of apparent stress (Zuñiga et al.,1987).The apparent stress is defined as the product of the seismic energy released per unit seismic moment and the shear modulusμ.Not only can the apparent stress express the ratio of high-frequency to low-frequency content of seismic waves but also,for a seismogenic fault plane,the apparent stress itself is equal to the product of the seismic efficiency and the average stress on the fault plane (Wyss,1970a;Wyss and Molnar,1972).When the seismic efficiency is 1,the apparent stress is equal to the average stress,so the apparent stress can also characterize the lower limit of the average stress on the fault plane.Therefore,the crustal stress state can be obtained indirectly through the apparent stress.The apparent stress increases with depth at Borrego Mountain in California,yet it remains constant at all depths at Parkfield,California(Wyss and Brune,1971).The magnitude of apparent stress depends on the seismogenic fault properties.Thrustfaulting earthquakes are generally associated with higher apparent stress than normal-faulting and strike-slipfaulting earthquakes (Zobin,1996;Margaris and Hatzidimitriou,2002).The average apparent stress is higher in regions where the subducting oceanic plate and the continental plate interact or beneath the axes of oceanic trenches,and it is relatively low near oceanic trenches(Zobin,1996).Earthquakes that occur within obstacles are associated with relatively high apparent stress (Zuñiga et al.,1987).McGarr and Fletcher studied the apparent stress distribution on the seismogenic fault plane for five earthquakes,including the 1979M6.5 Imperial Valley,1989M6.9 Loma Prieta,1992M7.3 Landers,1994M6.7 Northridge,and 1995M6.9 Kobe,Japan earthquakes.They discovered that the distribution of apparent stress on the seismogenic fault plane was prominently heterogeneous,with the highest apparent stress value reaching 8 MPa.The initial rupture points of three earthquakes were close to or within the regions with the highest apparent stress,and the initial rupture points of the other two earthquakes were located near the region with the second-highest apparent stress and within the low apparent stress zone,respectively(McGarr and Fletcher,2002).Information on the apparent stress of small earthquakes has been used to explore the stress variations that exist before stronger earthquakes.For instance,before themb5.8 earthquake in Adak,Alaska in 1984,the apparent stress of small earthquakes had been increasing for more than 3 years,and the high apparent stress areas were converging on the seismic source region(Scherbaum and Kisslinger,1984).The apparent stress in the rupture area before the 2011MW9.0 Honshu,Japan earthquake increased gradually for approximately 8.5 years,during which large areas of high apparent stress values occurred in the rupture zone (Li YE and Chen XZ,2017).However,there are individual exceptions.For example,no apparent stress increase was observed prior to theMW6.1 L’Aquila earthquake on April 6,2009 (Calderoni et al.,2019).Some studies have shown that an increase in apparent stress is accompanied by ab-value decrease before strong earthquakes (Chen XZ et al.,2021;Li YE et al.,2021).
At 06:15:49 UTC on July 29,2021,an earthquake ofMW8.2 occurred to the south of the Alaska Peninsula,with an epicenter located at 55.364°N,157.888°W and a focal depth of 35.0 km.This event was caused by thrust-faulting due to the subduction of the Pacific plate beneath the North American plate.The focal mechanism solution and aftershock distribution suggest that the rupture occurred on an SE-trending,steeply dipping fault.This earthquake occurred in an area where the Pacific plate is moving northwestward toward the North American plate at a convergence rate of approximately 64 mm/a and subducted in the Alaska-Aleutian Trench approximately 125 km southeast of the epicenter.According to the earthquake catalog of the China Earthquake Networks Center,the magnitude of this seismic event wasMS8.1.Since 1900,there have been sevenMS≥ 7.0 earthquakes within 150 km of this earthquake’s epicenter,including one earthquake with a magnitude greater thanMS8.0: the 1938MS8.7 earthquake,located less than 20 km northwest of the 2021MS8.2 event.
The crustal stress changes in the area around the epicenter prior to the 2021MW8.2 earthquake south of the Alaska Peninsula have not been studied.We investigated the characteristics of the pre-earthquake crustal stress variations in terms of apparent stress,seeking evidence of crustal stress changes before the earthquake and clues to identifying earthquake precursor anomalies.
2.Study area and data
TheMW8.2 earthquake in Alaska on July 29,2021,occurred south of the Alaska Peninsula,at the boundary between the Pacific plate and the North American plate.The Pacific plate is subducting beneath the North American plate and subsides in the Alaska-Aleutian Trench,causing frequent strong earthquakes in this region.The study area selected for consideration in this research is shown by the black quadrilateral region enclosed by the thick solid line in Figure 1a,which is slightly larger than the aftershock distribution zone of theMW8.2 earthquake in Alaska on July 29,2021 (the rectangular region enclosed by the thick dashed line in Figure 1a).This selection was based on the following two considerations:first,the study area needed to encompass the aftershock region;second,there needed to be a sufficient number of seismic events in the study area to examine.The latitudinal and longitudinal ranges of the study area were approximately 51°N–59°N and 153°W–162°W.

Figure 1.(a) Distribution of MW ≥ 3.0 aftershocks from July 29 to September 5,2021 and the range of the study area,the area enclosed by the thick black solid line is the study region.(b) Epicenter distribution of 4.7 ≤ MW ≤ 6.9 earthquakes between January 1980 and June 2021 used in this study.The red star represents the epicenter of the MW8.2 earthquake in Alaska on July 29,2021.The source mechanism solution was obtained from the GCMT catalog,and the dashed red line denotes the plate boundary.
To analyze the spatial-temporal variations of apparent stress in the area around the epicenter before and after the 2021MW8.2 earthquake in Alaska,we collected data on a total of 176 earthquakes of 4.7 ≤MW≤ 6.9 that occurred in the study area between January 1980 and June 2021 from the source parameter catalog published by Harvard University (http:// www.globalcmt.org/CMTsearch.html,last accessed November 10,2021).One hundred and fifty-nine of the events,or 90%,were shallow-focus earthquakes (H≤70 km).We selected these 159 shallow-focus earthquakes for consideration in this study.The locations of their epicenters are shown in Figure 1b.
3.Calculation method
The definition of seismic apparent stress (Wyss,1970b) is

where μ is the shear modulus (3×10⁴MPa for crustal media) andEsandM0are the radiated seismic energy and scalar seismic moment,respectively.The seismic energy can be determined by integrating the squared velocity source spectrum,inverting the source function,or using the following equation (Gutenberg and Richter,1956).

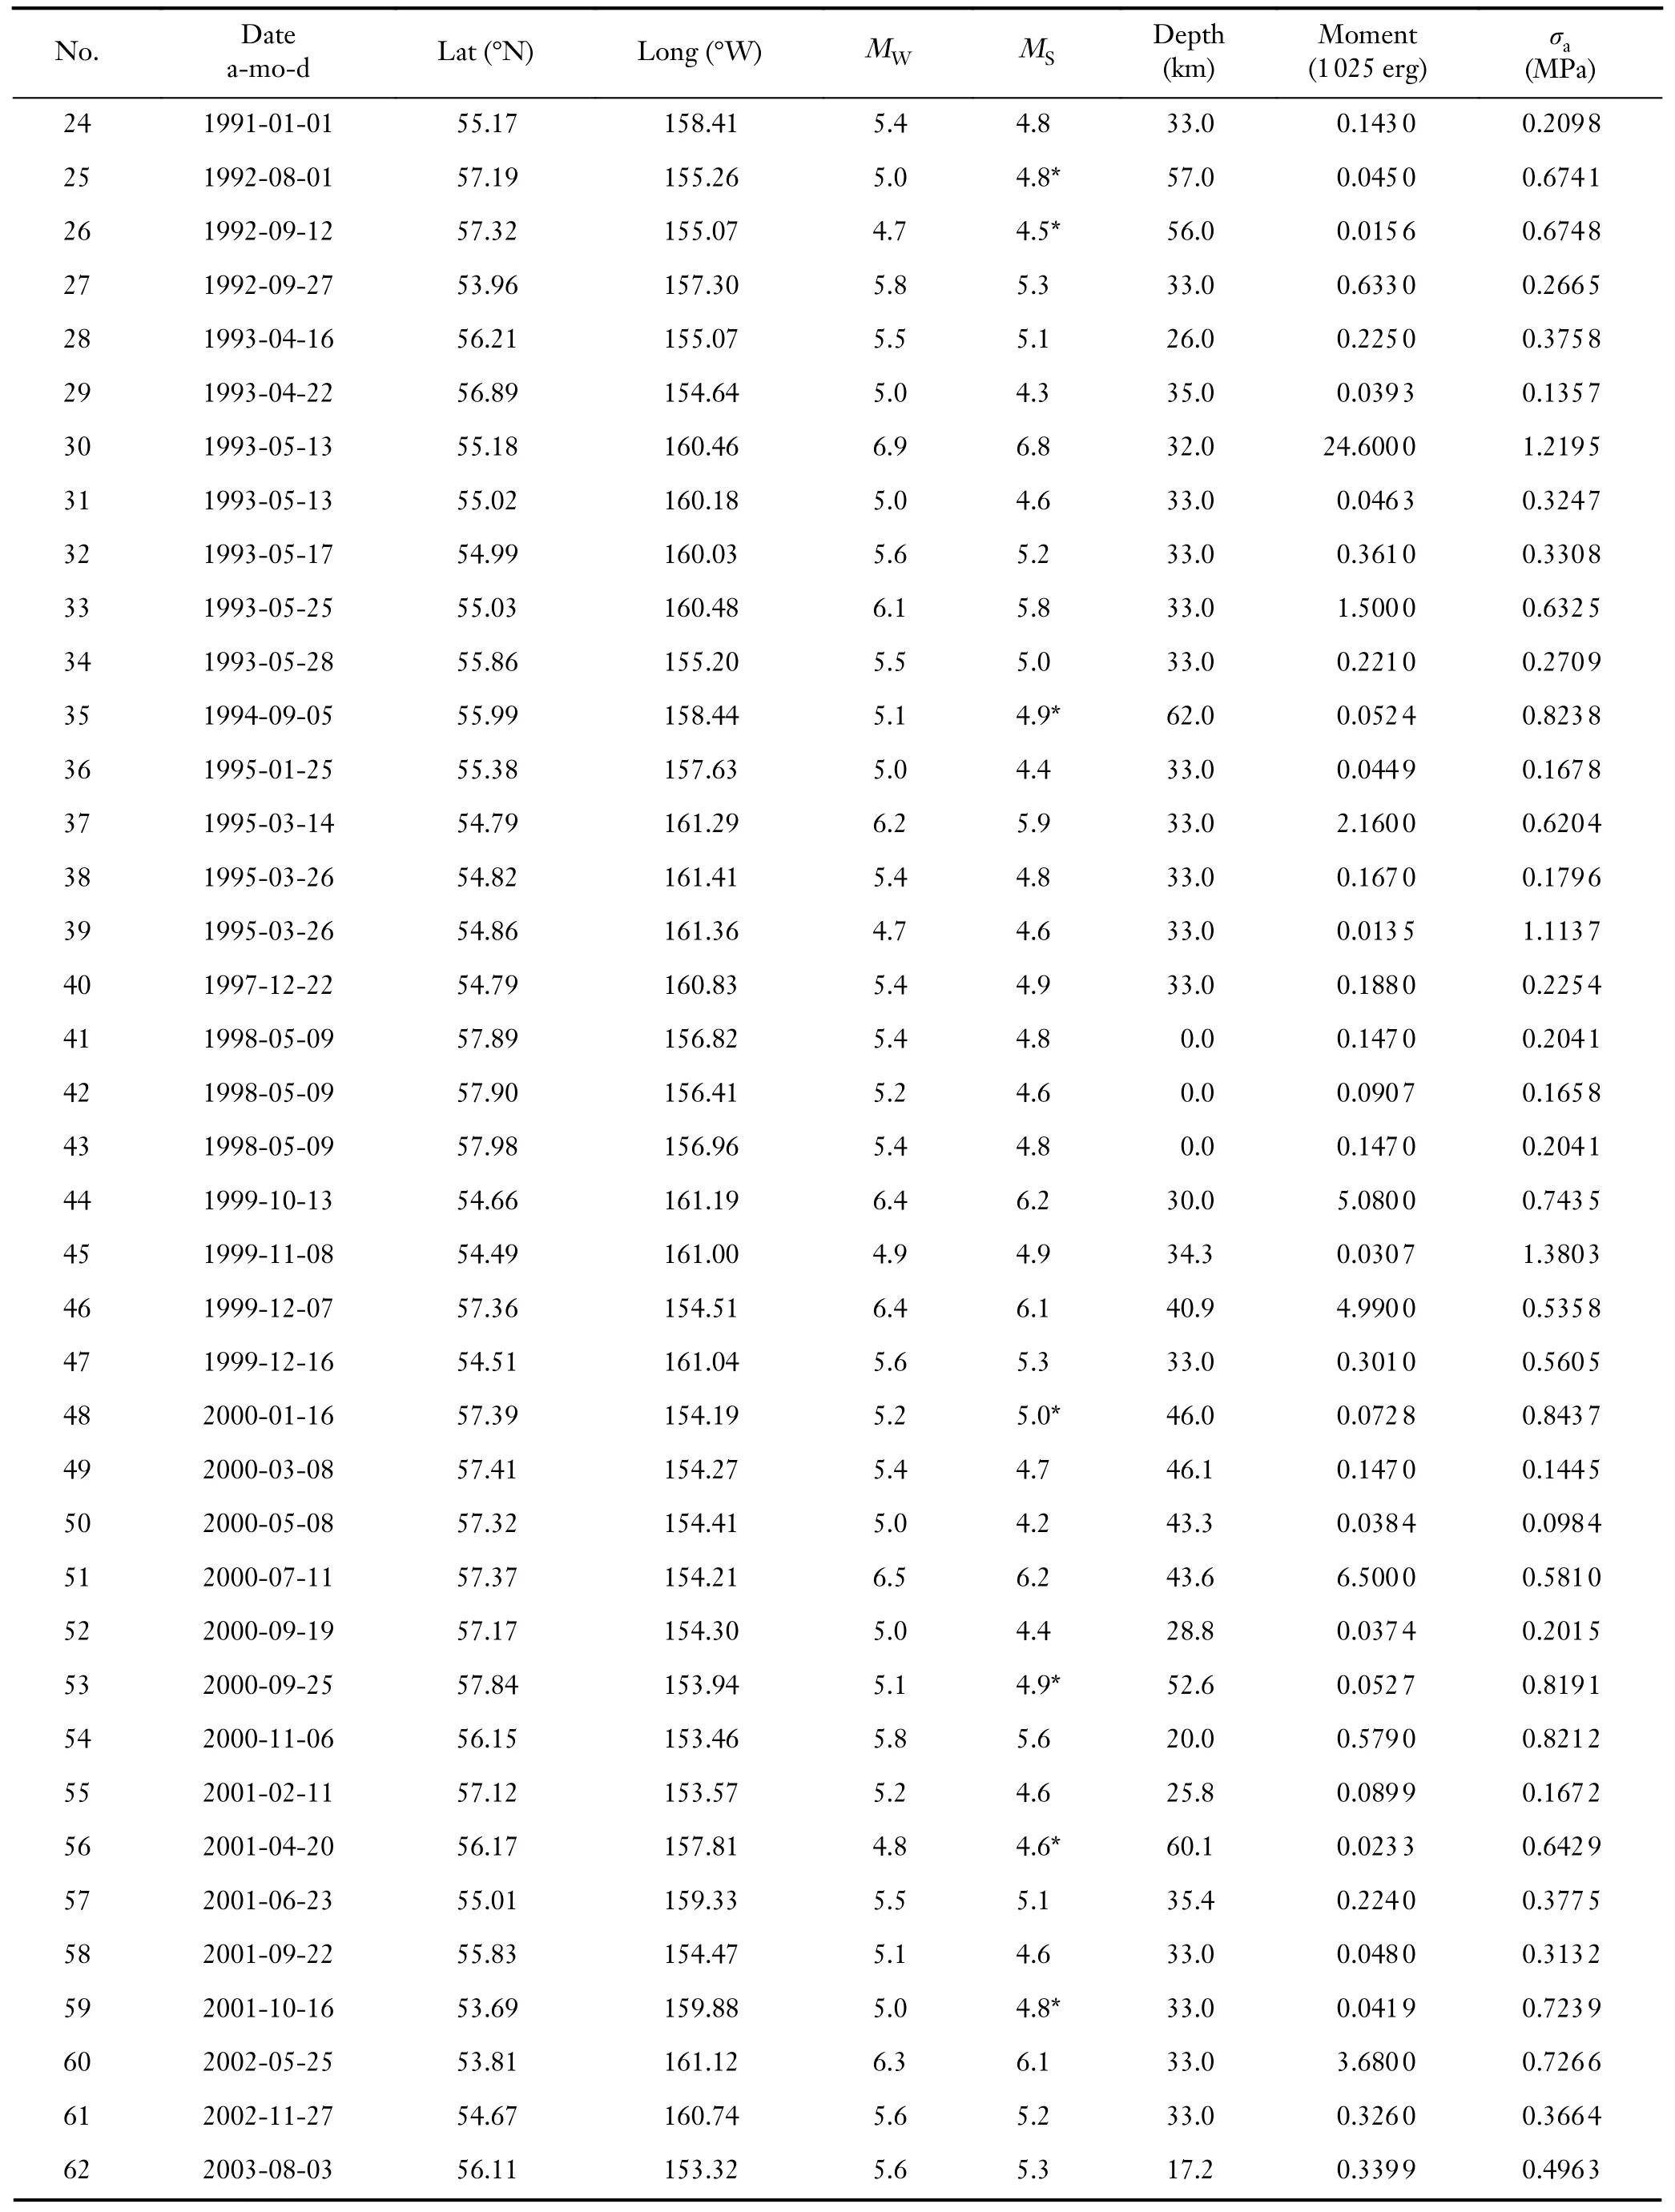
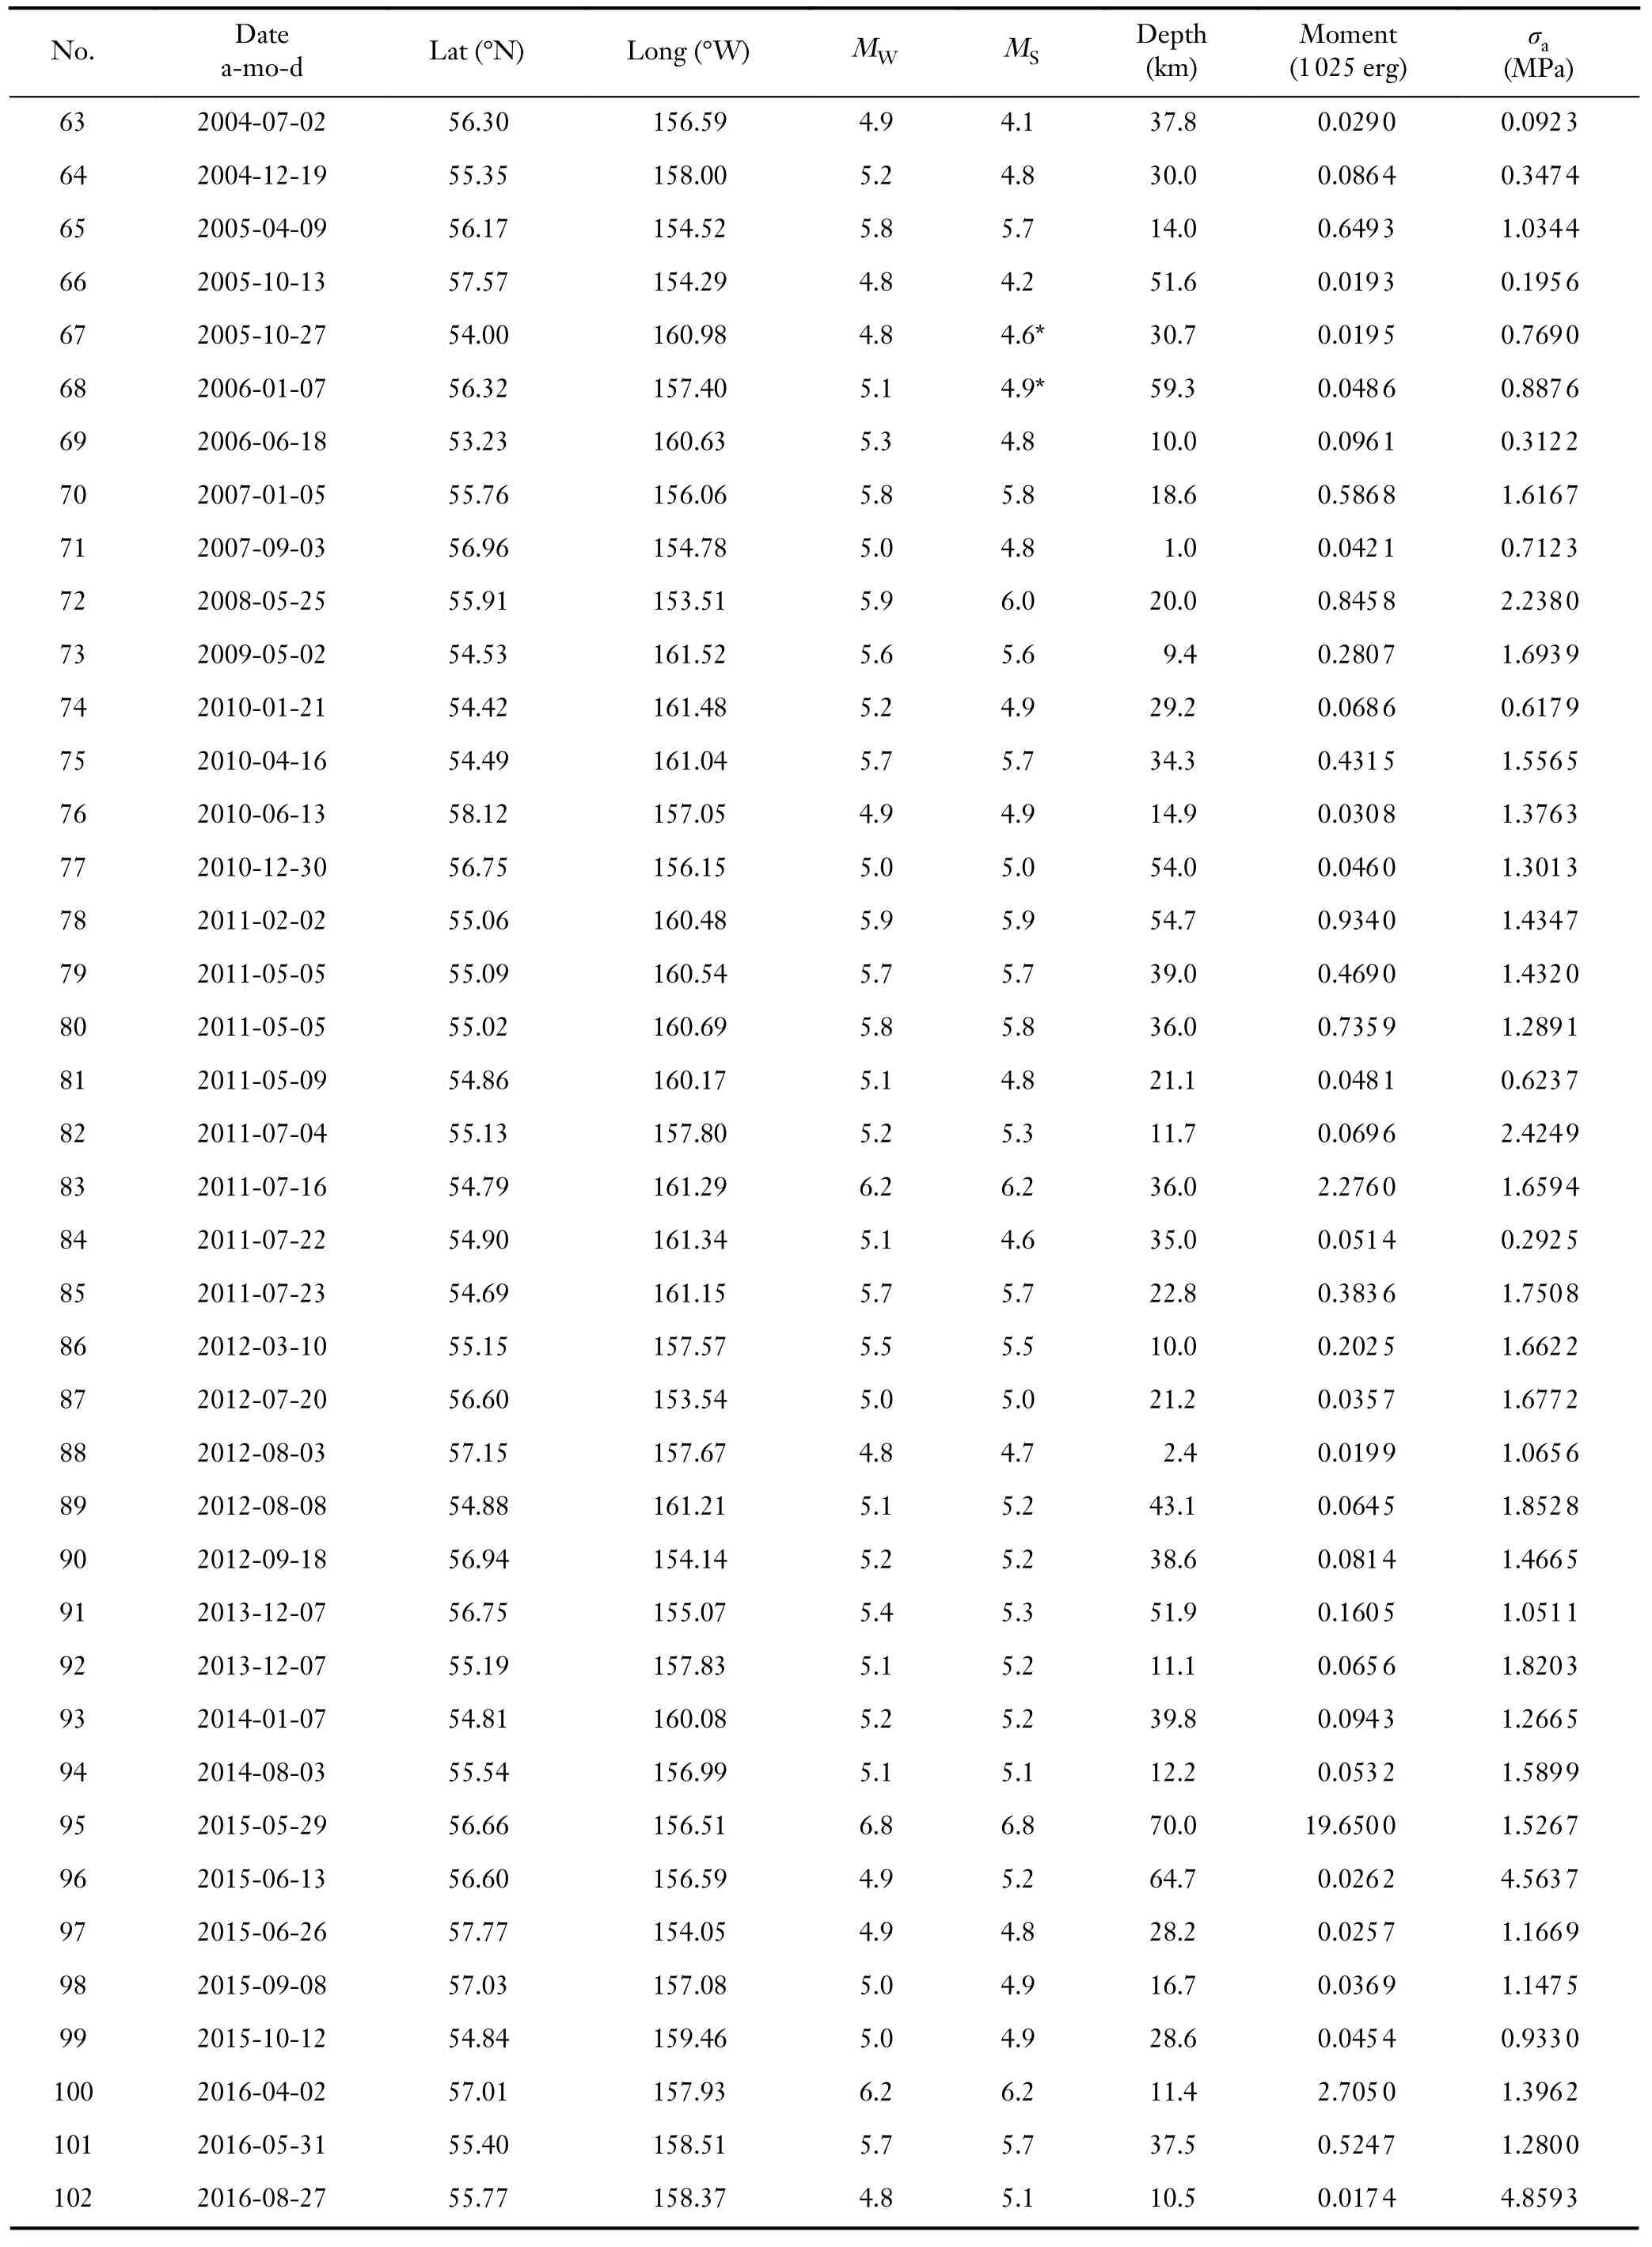
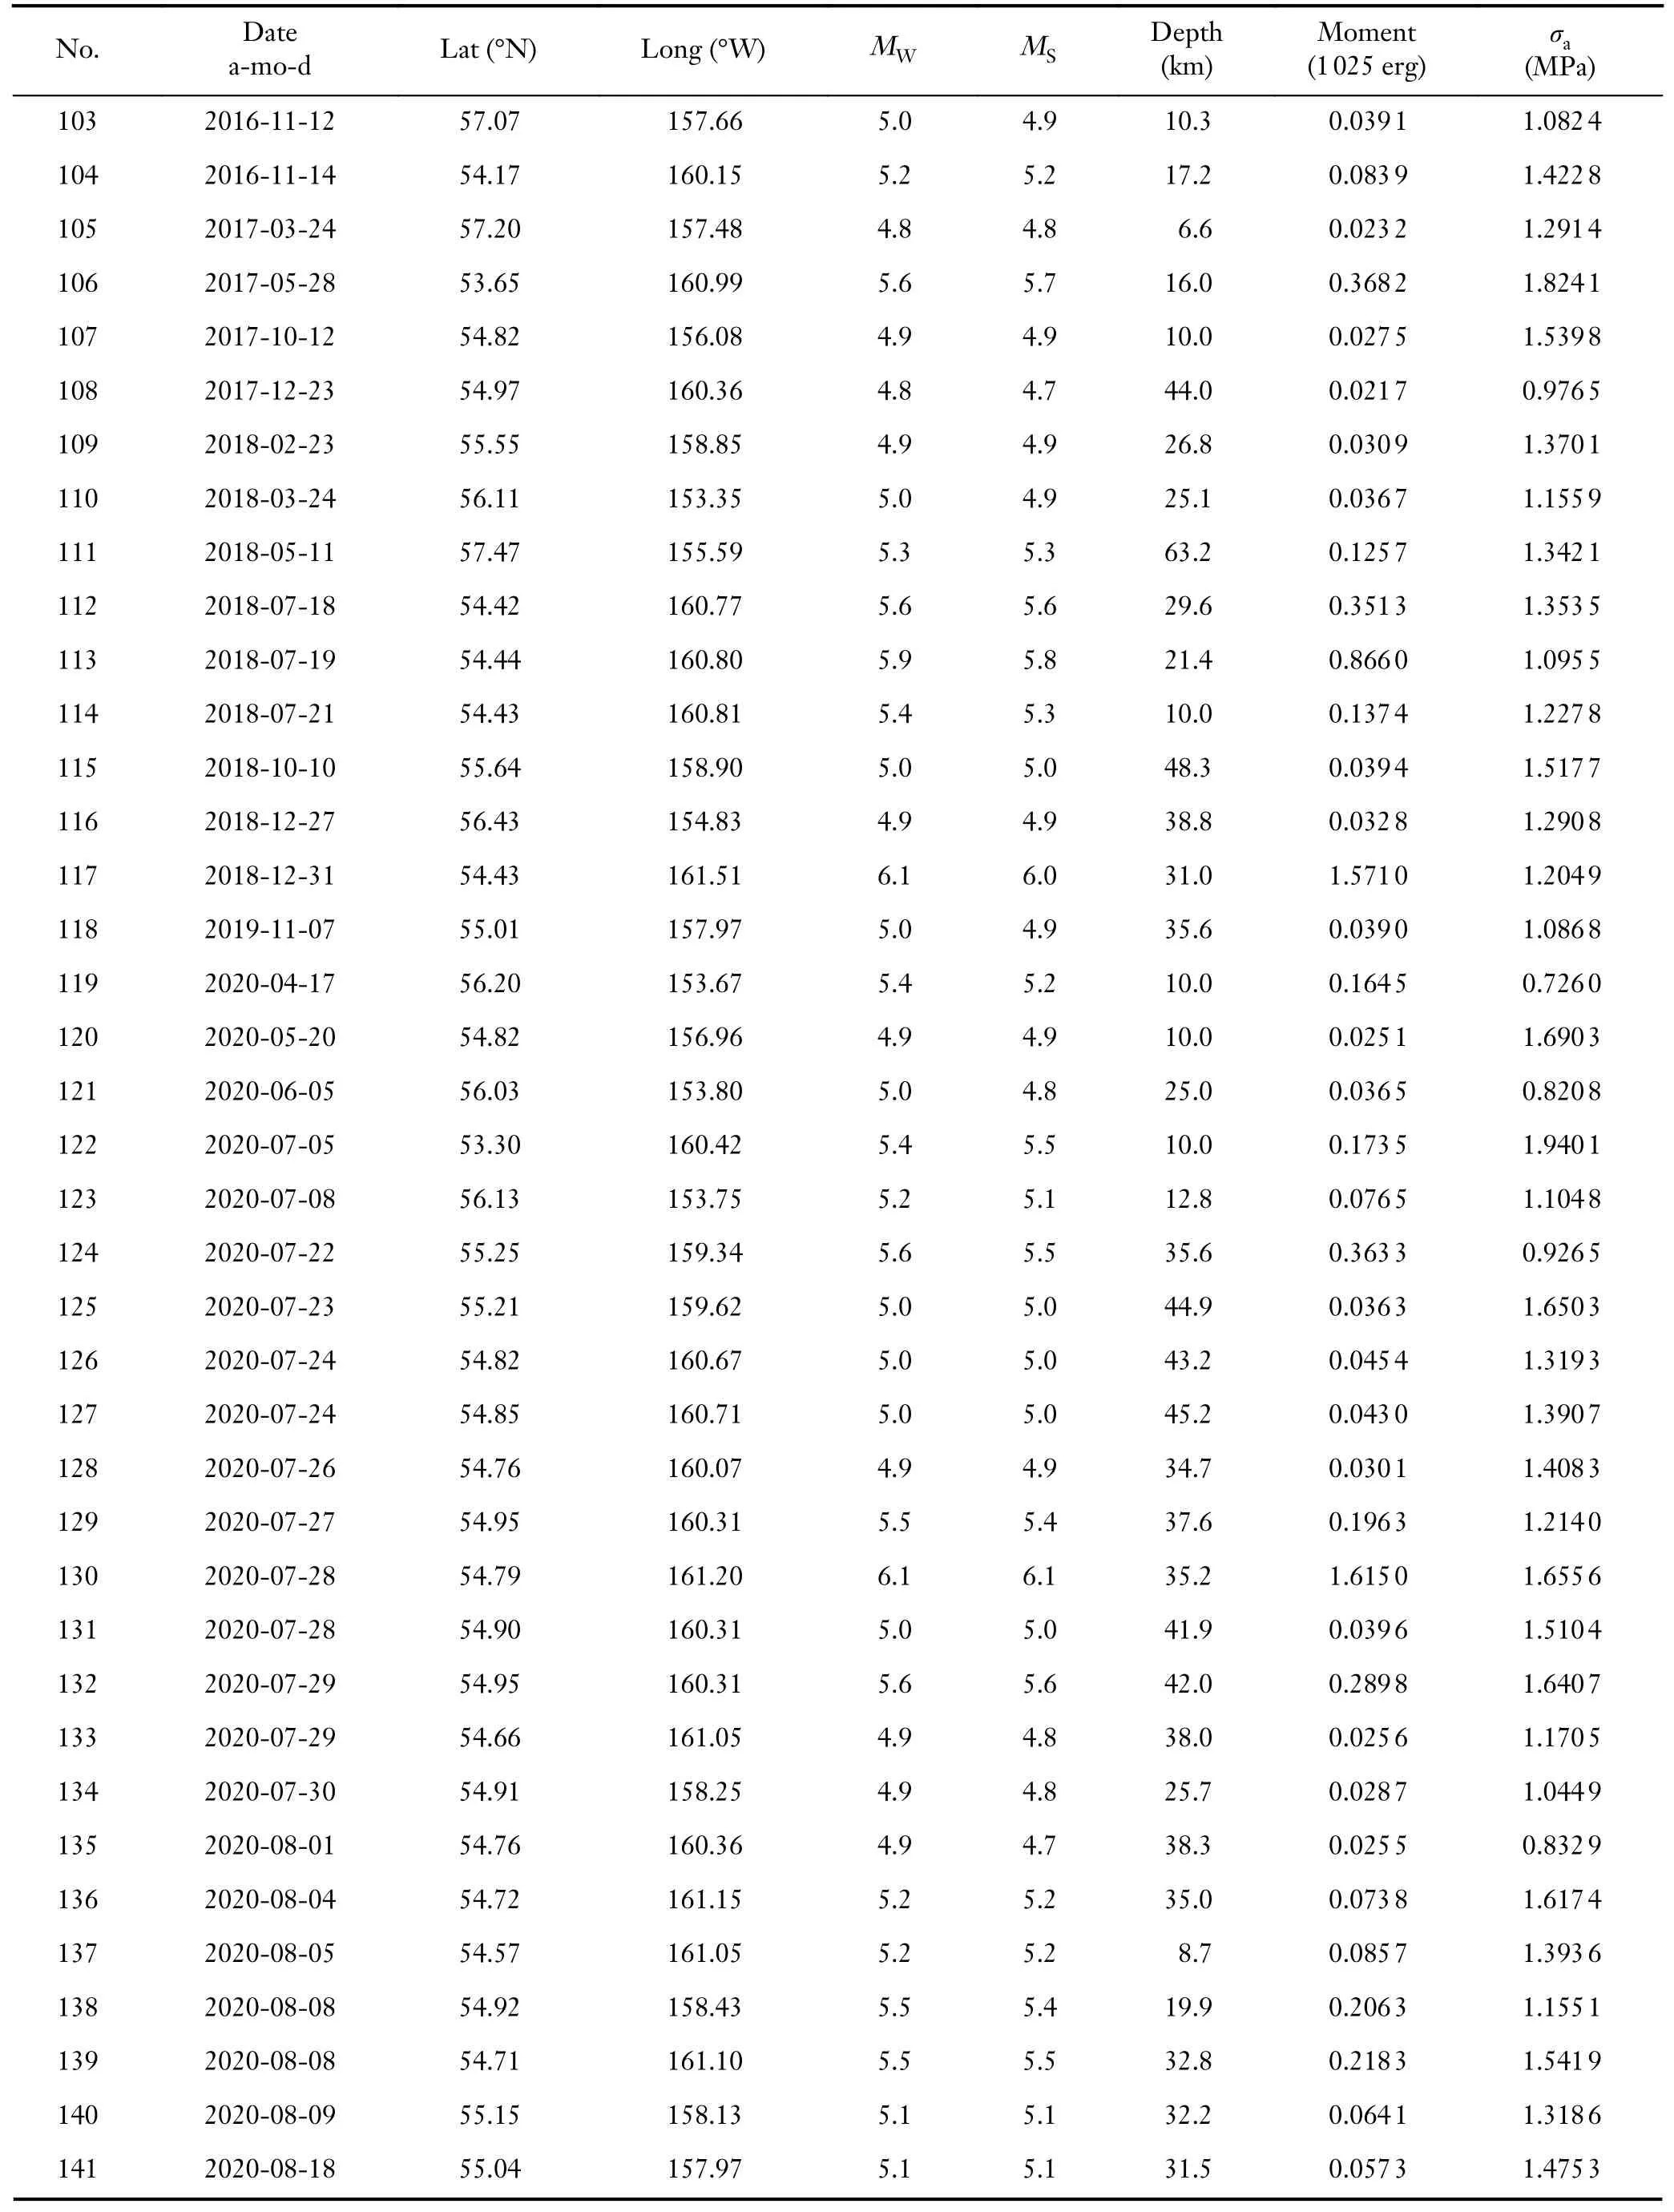
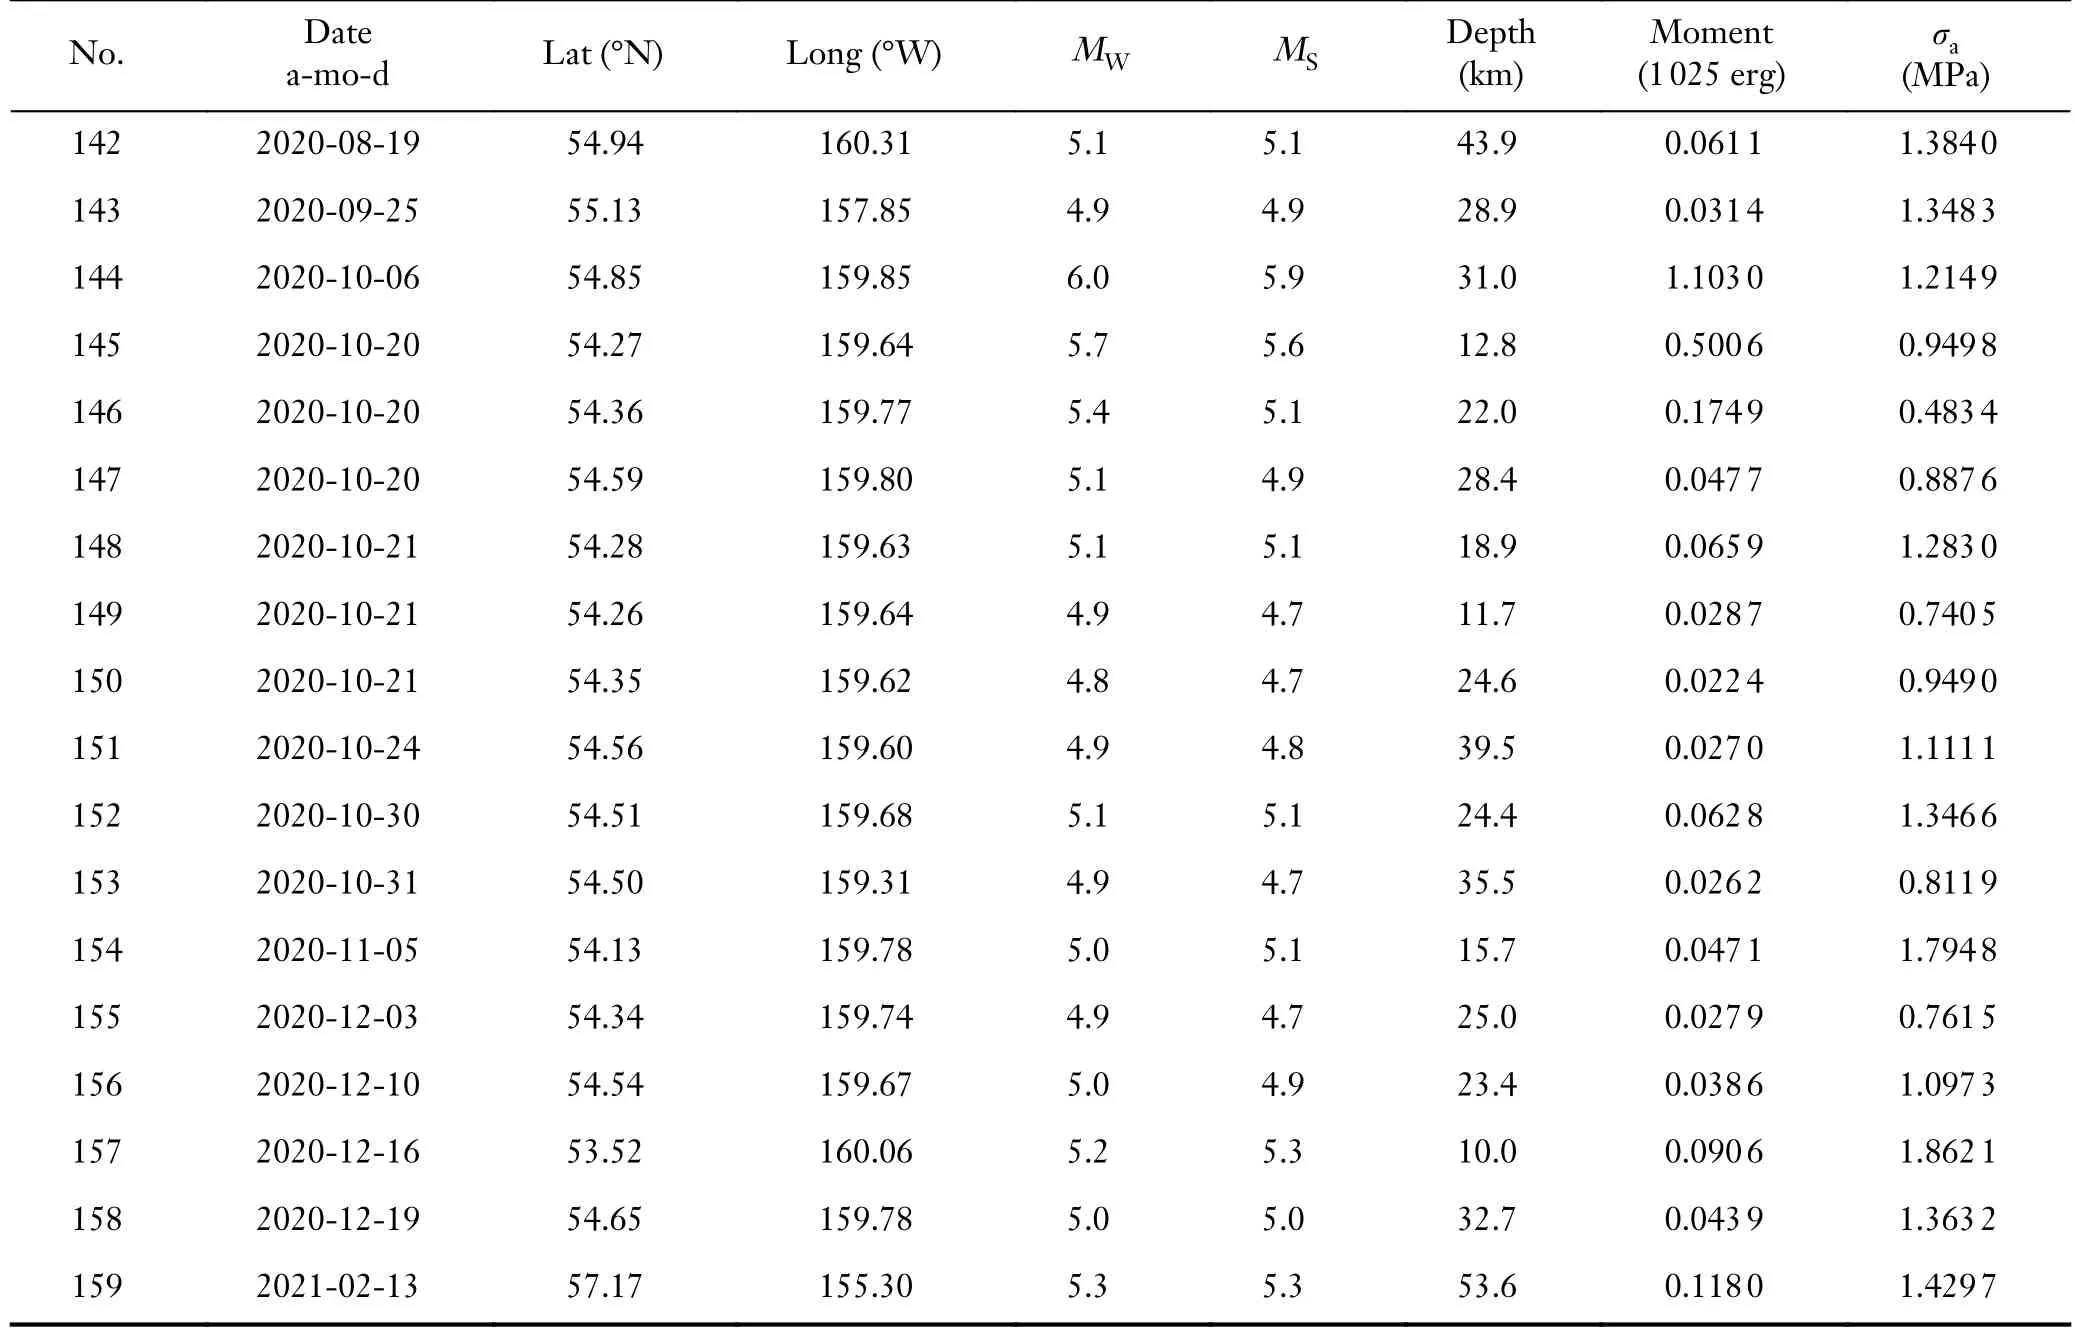
Zobin calculated the seismic energy of five earthquakes in the Kamchatka region using the conversion method given by Equation (2) and the Boatwright-Choy spectral integration method (Boatwright and Choy,1986)and found no significant difference between the results of the two methods (Zobin,1996;Wyss and Brune,1971).In this study,the seismic energyEswas obtained using the conversion method given by Equation (2).It should be noted that theMSdata are missing for 15 of the 159 selected earthquakes.TheMSvalues of these 15 events were obtained from the following regression relationship betweenMWandMS(Figure 2),with a correlation coefficient ofr=0.91.The source parameters and apparent stress values of the 159 earthquakes are listed in Appendix Table 1.

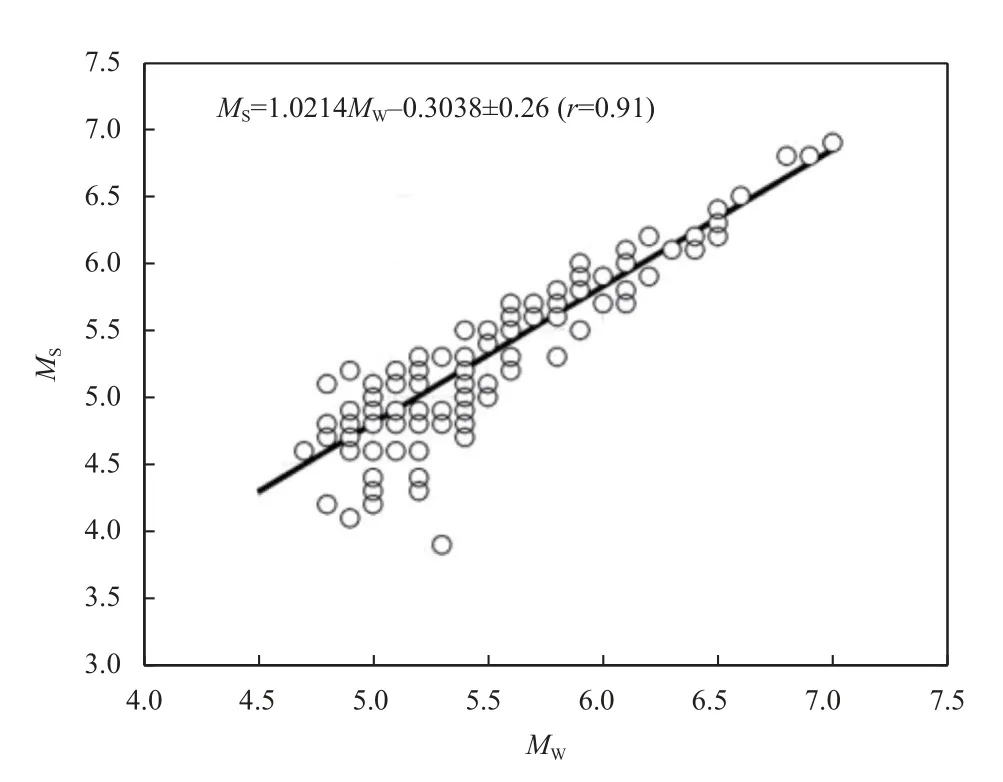
Figure 2.Relationship between MS and MW.
4.Results
We calculated the average apparent stress using sliding windows of equal time length and equal number of earthquakes.For the 159 earthquakes of 4.7 ≤MW≤ 6.9,the average apparent stress was calculated with a five-year time window moved by six months each time.The average apparent stress for 20 earthquakes was calculated with a sliding window moved by three events each time.The occurrence time of the last event in the window was taken as the time of the calculated average apparent stress,yielding the temporal variation of the average apparent stress,as shown in Figure 3.Figure 3a shows the average apparent stress calculated with the five-year time window.The number of earthquakes in each window was 16 on average,with a minimum of 7 and a maximum of 59.
Figure 3b shows the results calculated with the 20-event sliding window.The two sets of results are in good agreement.Before 2008,the average apparent stress was changing smoothly between 0.4 MPa and 0.7 MPa.From early 2008 to December 2016,the apparent stress exhibited an increasing trend over nine years,and its value rose from 0.7 MPa to 1.7 MPa,with an average change rate of approximately 0.11 MPa/a.A detailed analysis reveals that the rate of change was approximately 0.148 MPa/a during the first five years and approximately 0.065 MPa/a during the last four years,a decrease of approximately 56%.From the beginning of 2017 until June 2020,the average apparent stress decreased from a high level to approximately 1.2 MPa immediately before the earthquake.
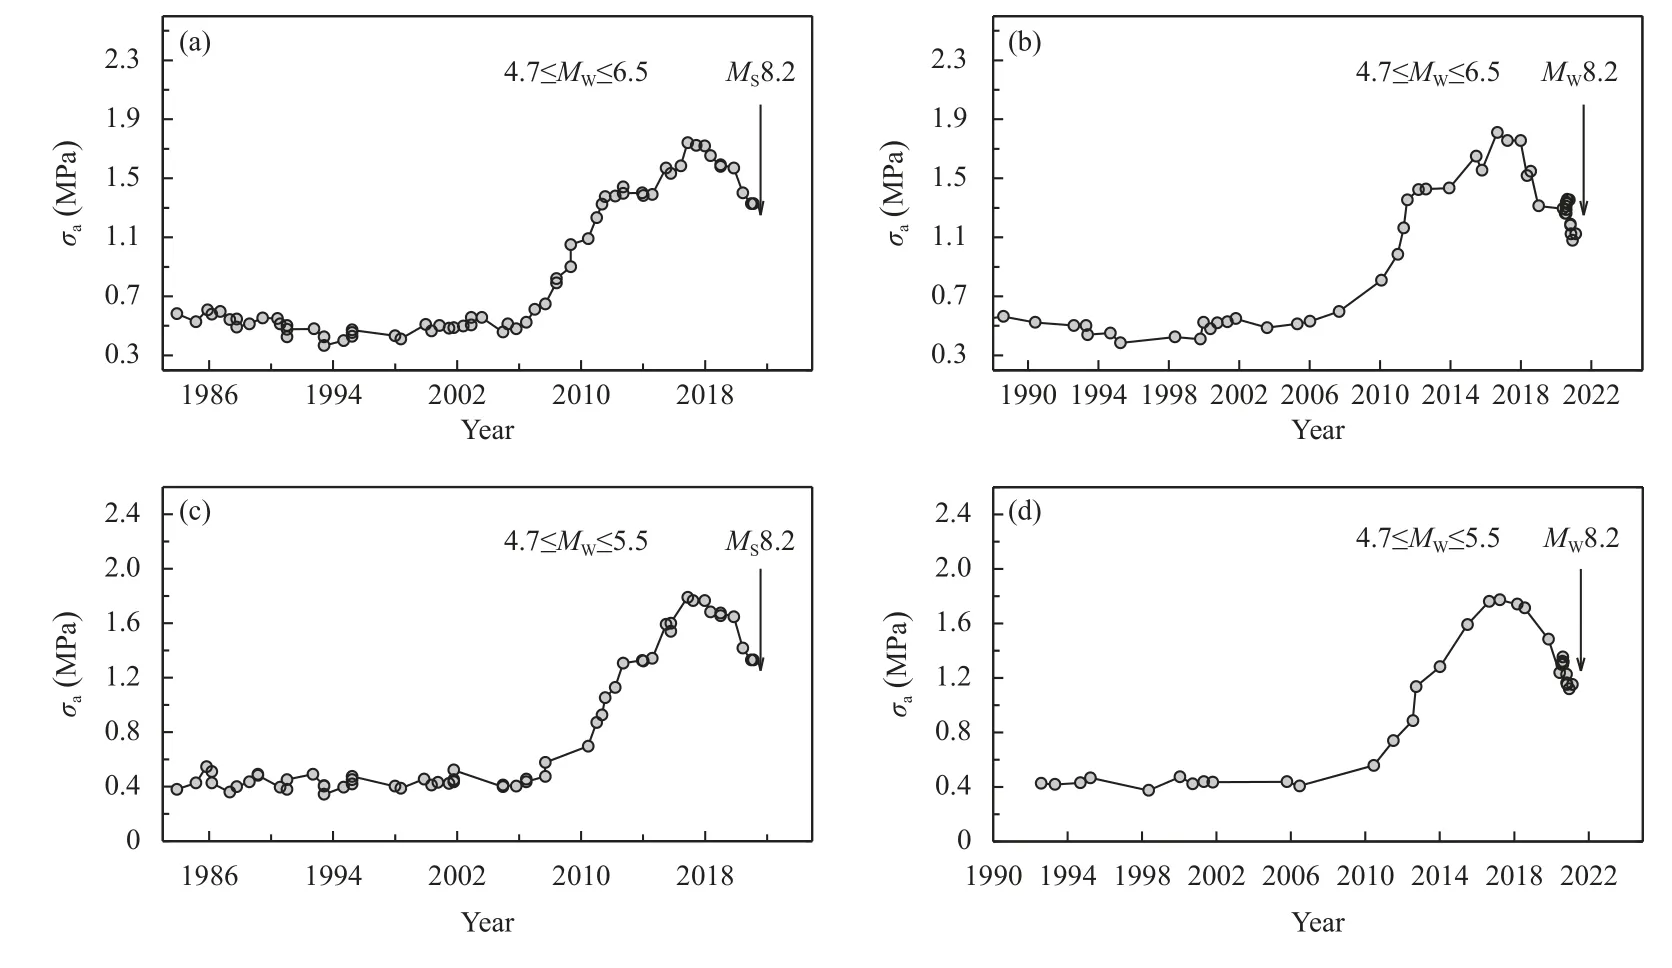
Figure 3.Average apparent stress as a function of time.The vertical arrow “↓” indicates the occurrence of the 2021 MW8.2 mainshock in Alaska.(a) and (c) are the results obtained by applying a five-year time window moved by six months each time.(b) and (d) are the results obtained by using sliding windows of 20 events and 15 events,respectively,both of which were moved by three events each time.
There were 114 earthquakes of 4.7 ≤MW≤ 5.5 among the 159 events of 4.7 ≤MW≤ 6.9,accounting for approximately 72%.We also calculated the variation of the average apparent stress for these 114 events over time.The results are shown in Figures 3c and 3d.Figure 3c shows the average apparent stress calculated with the five-year time window.The number of earthquakes in each window was 10.8 on average,with a minimum of 4 and a maximum of 49.Figure 3d shows the results calculated with a 15-event sliding window.The variation pattern of the average apparent stress of the 4.7 ≤MW≤ 5.5 earthquakes was generally consistent with that of the 4.7 ≤MW≤ 6.9 earthquakes.
The temporal variation of the average apparent stress reveals that the average apparent stress was almost unchanged from January 1980 to December 2007.It increased rapidly from January 2008 to December 2012,and its rate of increase slowed from January 2013 to December 2016,followed by a decreasing pattern from January 2017 to June 2021.We calculated the spatial distributions of apparent stress during these periods,and the results are shown in Figure 4.A 1° × 1° spatial window was applied in the calculation and was moved by 0.1° each time in the longitudinal and latitudinal directions,respectively.The apparent stress in the areas enclosed by dashed lines in the diagram is greater than 1.0 MPa.In the following description,the “relatively high apparent stress”refers to apparent stress greater than 1.0 MPa.The number of points with relatively high apparent stress was used to represent the size of the region with apparent stress greater than 1.0 MPa indirectly.From January 1980 to December 2007,the number of points with relatively high apparent stress was 84.This number increased to 666 from January 2008 to December 2012,and the distribution range of the points significantly expanded and spread to the epicenter.From January 2013 to December 2016,the number of points with relatively high apparent stress increased to 756,with two high-apparent stress zones of more than 3.0 MPa appearing at the epicenter and approximately 170 km to the northeast,and the area with the highest apparent stress was located at the epicenter.From January 2017 to June 2021,the number of points with relatively high apparent stress increased to a maximum of 1,111,but there was no region with an apparent stress of more than 2.4 MPa.
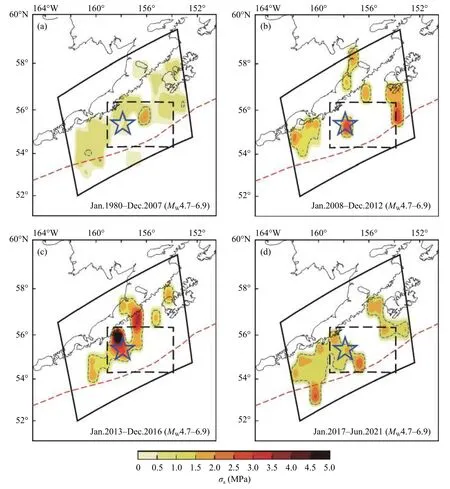
Figure 4.Lateral distribution of the apparent stress for (a) earthquakes between January 1980 and December 2007,(b)earthquakes between January 2008 and December 2012,(c) earthquakes between January 2013 and December 2016,and (d)earthquakes between January 2017 and June 2021.A 1° × 1° spatial window was applied in the calculation and was moved by 0.1° each time in the longitudinal and latitudinal directions.The area enclosed by the thick black solid line is the study region.The apparent stress in the areas enclosed by the dashed lines was greater than 1.0 MPa.The blue hexagram represents the epicenter of the 2021 MW8.2 mainshock in Alaska,and the dashed red line denotes the plate boundary.
In summary,an interesting spatial evolution process of apparent stress can be found by dividing the seismogenic process into an early stage (January 2008–December 2012),middle stage (January 2013–December 2016),and final stage (January 2017–June 2021).In non-seismogenic periods,the areas with relatively high apparent stress (>1.0 MPa) were scarce.In the early seismogenic stage,relatively high apparent stress values showed up in large areas.In the middle stage,the regions with relatively high apparent stress continually increased,high-apparent stress zones appeared,and the area with the highest apparent stress appeared near the epicenter of the strong earthquake,where the apparent stress level was 4–5 times greater than the normal level (approximately 0.5 MPa).In the final stage,the areas with relatively high apparent stress continually expanded,reaching the maximum range,but there was no region with an apparent stress greater than 2.4 MPa.
We also plotted the distribution of the apparent stress in an E-W vertical cross section (Figure 5).A spatial window of 5 km × 1° was moved by 0.5 km and 0.1° each time along the depth and longitudinal directions,respectively.It can be seen from the figure that a gap surrounded by relatively high-apparent stress zones appeared near the hypocenter in the early seismogenic stage.In the middle stage,the relatively high-apparent stress zones migrated to the hypocenter within this gap,forming high-apparent stress areas above and below the hypocenter,respectively.In the final stage,the regions with relatively high apparent stress continued to expand near the hypocenter.Interestingly,most parts of this gap were filled in by aftershocks (Figure 6).
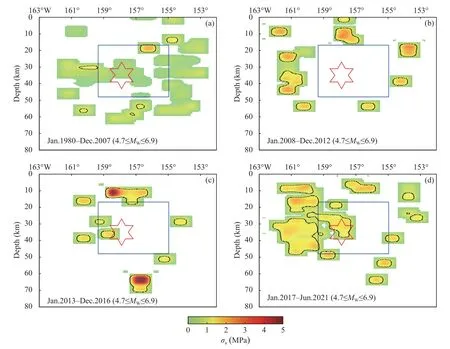
Figure 5.Distribution of apparent stress in the E-W vertical cross section for (a) earthquakes occurring between January 1980 and December 2007,(b) earthquakes occurring between January 2008 and December 2012,(c) the earthquakes occurring between January 2013 and December 2016,and (d) the earthquakes occurring between January 2017 to June 2021.A spatial window of 5 km × 1° was moved by 0.5 km and 0.1° each time in the depth and longitudinal directions.The apparent stress in the areas enclosed by the dotted lines is greater than 1.0 MPa.The red hexagram represents the hypocenter of the 2021 MW8.2 mainshock in Alaska.The area enclosed by blue line represents the gap near the hypocenter in the early seismogenic stage in (b).
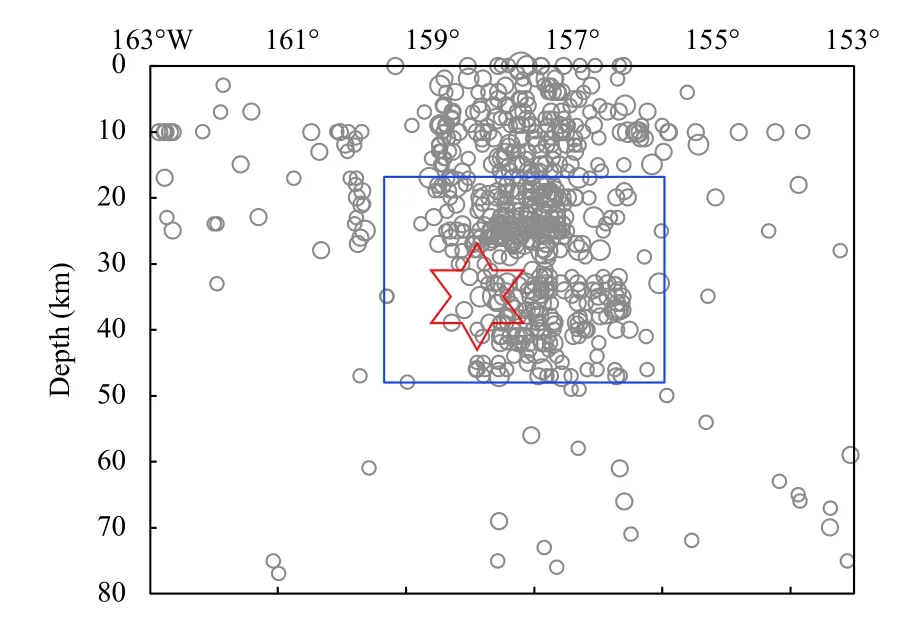
Figure 6.Distribution of M ≥ 2.0 aftershocks between July 29 and September 5,2021 in the E-W vertical cross section.The red hexagram represents the hypocenter of the 2021 MW8.2 mainshock in Alaska.The area enclosed by blue line represents the gap near the hypocenter in the early seismogenic stage in Figure 5b.
5.Discussion and conclusions
It is generally believed that earthquakes are caused by the destabilization of crustal rocks under tectonic stress.Thus,the variation of crustal stress in the vicinity of the epicenter of an earthquake during the seismogenic process is naturally one of the main concerns in earthquake prediction studies.Since apparent stress can indirectly reflect the crustal stress,this study focused on the spatialtemporal variation characteristics of apparent stress in areas around the epicenter of the 2021MW8.2 earthquake in Alaska from January 1980 to June 2021.
The apparent stress exhibited an obvious upward trend before the earthquake,beginning in early 2008.Before then,the apparent stress remained at a low level of approximately 0.5 MPa.From 2008 to 2016,the apparent stress increased rapidly,with an average rate of change of approximately 0.11 MPa/a.The rate of change was approximately 0.148 MPa/a during the first five years and approximately 0.065 MPa/a during the last four years,a decrease of approximately 56%.The apparent stress then exhibited a decreasing trend for four years and seven months,dropping to approximately 1.2 MPa immediately before the earthquake.The variation pattern of the apparent stress is very similar to the experimental constitutive relation curve of rocks,indicating that the change in apparent stress is very likely to reflect actual crustal stress variations.Thirteen years and seven months passed from the beginning of the crustal stress increase in early 2008 to theMW8.2 earthquake in Alaska on July 29,2021.The crustal stress increased for nine years and decreased for four years and seven months.The period of increase accounts for approximately 2/3 of the entire process,while the period of decrease accounts for 1/3.
Earthquakes are mechanical processes during which accumulated stress is rapidly released.According to the results of biaxial compression experiments,a fault will undergo four stages during the deformation process: a steady stage,a sub-stable stage,a sub-instability stage,and a destabilized stage.These correspond to four segments of the differential stress-time process curve,divided by the point of deviation from linearity (yield pointM),the peak stress point (strength limit pointC),and the destabilization point (B) (Figure 7).From pointOto pointMis the steady stage,during which the fault is in a state of elastic deformation.In this stage,when the external stress is removed,the strain recovers immediately.From pointMto pointCis the sub-stable stage,during which the fault deviates from the elastic state.In this stage,when the external stress is removed,part of the strain recovers immediately,the other part recovers gradually and slowly,and the local damage is irreversible.From pointCto pointBis the sub-instability stage,during which the fault is already in a deformation state dominated by energy release.As the degree of fault deformation increases,the quasi-static energy release transforms into irreversible quasidynamic energy release,finally causing fault destabilization (Ma J and Guo YS,2014;Ma J,2016).

Figure 7.Schematic diagram of differential stress as a function of time (based on rock test results).The point M,C,and B represent the yield point,the strength limit point,and the destabilization point,respectively.
Comparing the temporal variation process of apparent stress with the stress-time relationship obtained from rock tests,we can conclude that after 2017,the crustal rocks in the epicentral region and its surroundings were in a subinstability state.If this is the case,it should be observed that small and moderate earthquakes are sensitive to minor external factors.As the changes in Earth’s rotation rate can cause extremely weak crustal stress changes (Chen XZ et al.,2018),such tiny stress variations may also trigger some small and moderate earthquakes when the crustal rocks are in a sub-instability state,thereby revealing a significant correlation between seismic activities and Earth’s rotation rate (Wei YG et al.,2018;Chen XZ et al.,2019,2020;Chen XZ and Li YE,2019;Li YE and Chen XZ,2021).We selected theM≥ 3.8 earthquakes that occurred in the study area (Figure 1a) between January 2000 and June 2021 according to the US Geological Survey (USGS) earthquake catalog and analyzed the relationship between the seismic activities prior to theMW8.2 earthquake in Alaska and the seasonal variation of Earth’s rotation rate.
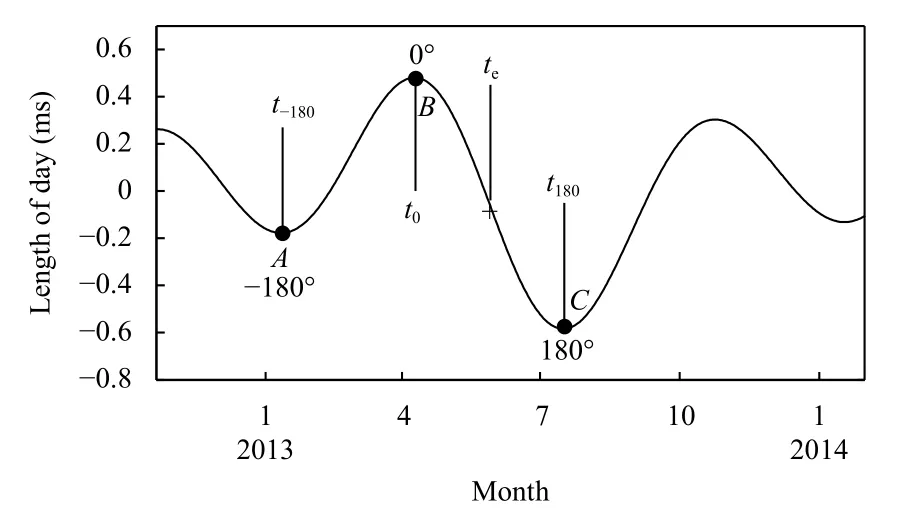
Figure 8.Seasonal variation of Earth’s rotation and determination of earthquake phase angle.The point A,B,and C represent the phase angle -180°,0° and -180°,respectively.The point te represents a given earthquake’s phase angle.
The phase angle of eachM≥ 3.8 earthquake in the study area was calculated based on the seasonal variation curve of Earth’s rotation (Figure 8).In the calculation,it was specified that at the maximum point of the seasonal variation curve of Earth’s rotation,the phase angle θ=0°,which is pointBin Figure 8;at the first minimum point to the left of pointB(pointA),the phase angle θ=-180°;and at the first minimum point to the right of pointB(pointC),the phase angle θ=180°.The phase angle of each earthquake was calculated using the following equations:
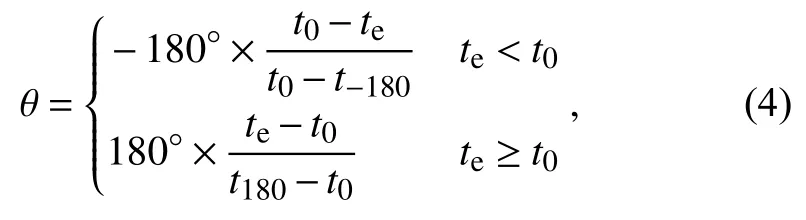
whereteis the time of occurrence of an earthquake,t0is the time of the nearest maximum point to the earthquake,andt-180andt180are the times of the nearest minimum points before and after the earthquake,respectively.Based on the phase angle of all earthquakes,whether the occurrence time of an earthquake is close to the time of a certain phase angle can be tested by applying Schuster’s statistical test method.For a set of earthquakes consisting ofNevents,the basic parameters involved in the test are as follows (Schuster,1897):
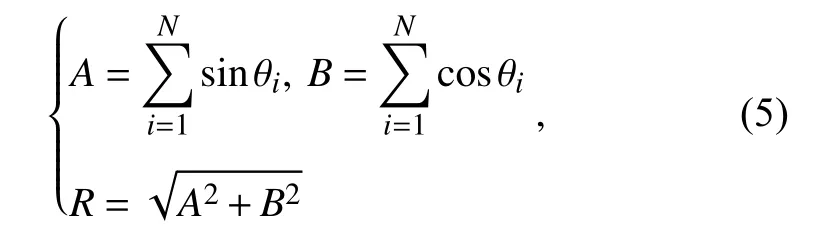
where θiis the phase angle of theith earthquake andNis the total number of earthquakes.If the earthquakes occurred randomly,independently of Earth’s rotation,the distributions ofAandBare zero on average,with a variance ofN/2.R2follows a χ2distribution with two degrees of freedom.The probability for a set of randomly occurring events withRgreater than or equal to a specific value is as follows:

whereN> 10 and 0 ≤P≤ 1 represents the significance level associated with rejecting the null hypothesis that the earthquakes occurred randomly,independent of Earth’s rotation.The smaller theP-value is,the higher the confidence level is for rejecting this hypothesis.In general,ifP≤ 5%,the occurrence of the earthquakes is considered non-random (Heaton,1975).
The variation ofP-value over time was calculated with a five-year time window moved by six months each time(Figure 9).The minimum number of earthquakes in the window is 31,and the maximum is 62,with an average of 42.In Figure 9,threeP-values below 5% can be found between June 2018 and April 2019,with a minimumPvalue of 0.53%,indicating that the correlation between the seismic activities and the variation of Earth’s rotation rate was significant during this period.This result can serve as evidence that the crustal rocks in the epicentral area and its surroundings were in a sub-instability state after 2017.It also proves the feasibility of using apparent stress to reflect the crustal stress.

Figure 9.P-value as a function of time for M ≥ 3.8 earthquakes in the study area.The vertical arrow “↓” indicates the occurrence time of the 2021 MW8.2 earthquake in Alaska.
From early 2008 to December 2016,the apparent stress increased,and after 2017,a stage of sub-instability occurred.The average rate of apparent stress change in the first five years of the stress increase period was roughly 2.3 times greater than that in the last four years.Throughout the nine-year stress increase period and the subsequent sub-instability stage,the areas with relatively high apparent stress were gradually expanding,and the region with the highest apparent stress was located at the epicenter during the last four years of the stress increase period.The distribution of apparent stress in the E-W vertical cross section reveals that an apparent stress gap formed around the hypocenter during the first five years,surrounded by areas of relatively high apparent stress values.With the development of the seismogenic process,the region with relatively high apparent stress gradually migrated to the hypocenter within this gap and expanded.After the strong earthquake,most parts of this gap were filled in by aftershocks.This gap was probably formed as a result of the closure of microfractures in the early crustal stress increase period,and the seismic energy was mainly concentrated in this zone.After the earthquake,the accumulated energy in the gap region was released,and aftershocks occurred.
In summary,we can draw the following conclusions:The seismogenic process of the 2021MW8.2 earthquake in Alaska consisted of a crustal stress increase period of approximately nine years and a subsequent sub-instability period of more than four years.In the first five years of stress increase,the average rate of stress increase was much higher than that in the last four years,and a region of seismic energy concentration was formed at the hypocenter and its surroundings as a result of the closure of microfractures.During the sub-instability period,the seismic activities exhibited a significant correlation with Earth’s rotation,indicating that the seismic region had become unstable.At the same time,the region with relatively high stress was spreading toward the seismic energy concentration zone,eventually causing fault destabilization and the occurrence of theMW8.2 earthquake in Alaska.
Acknowledgment
The authors are grateful to the two anonymous reviewers,whose constructive comments have improved this paper.This study is supported by the the Special fund of the Institute of Geophysics,China Earthquake Administration (No.DQJB22Z04).
Appendix
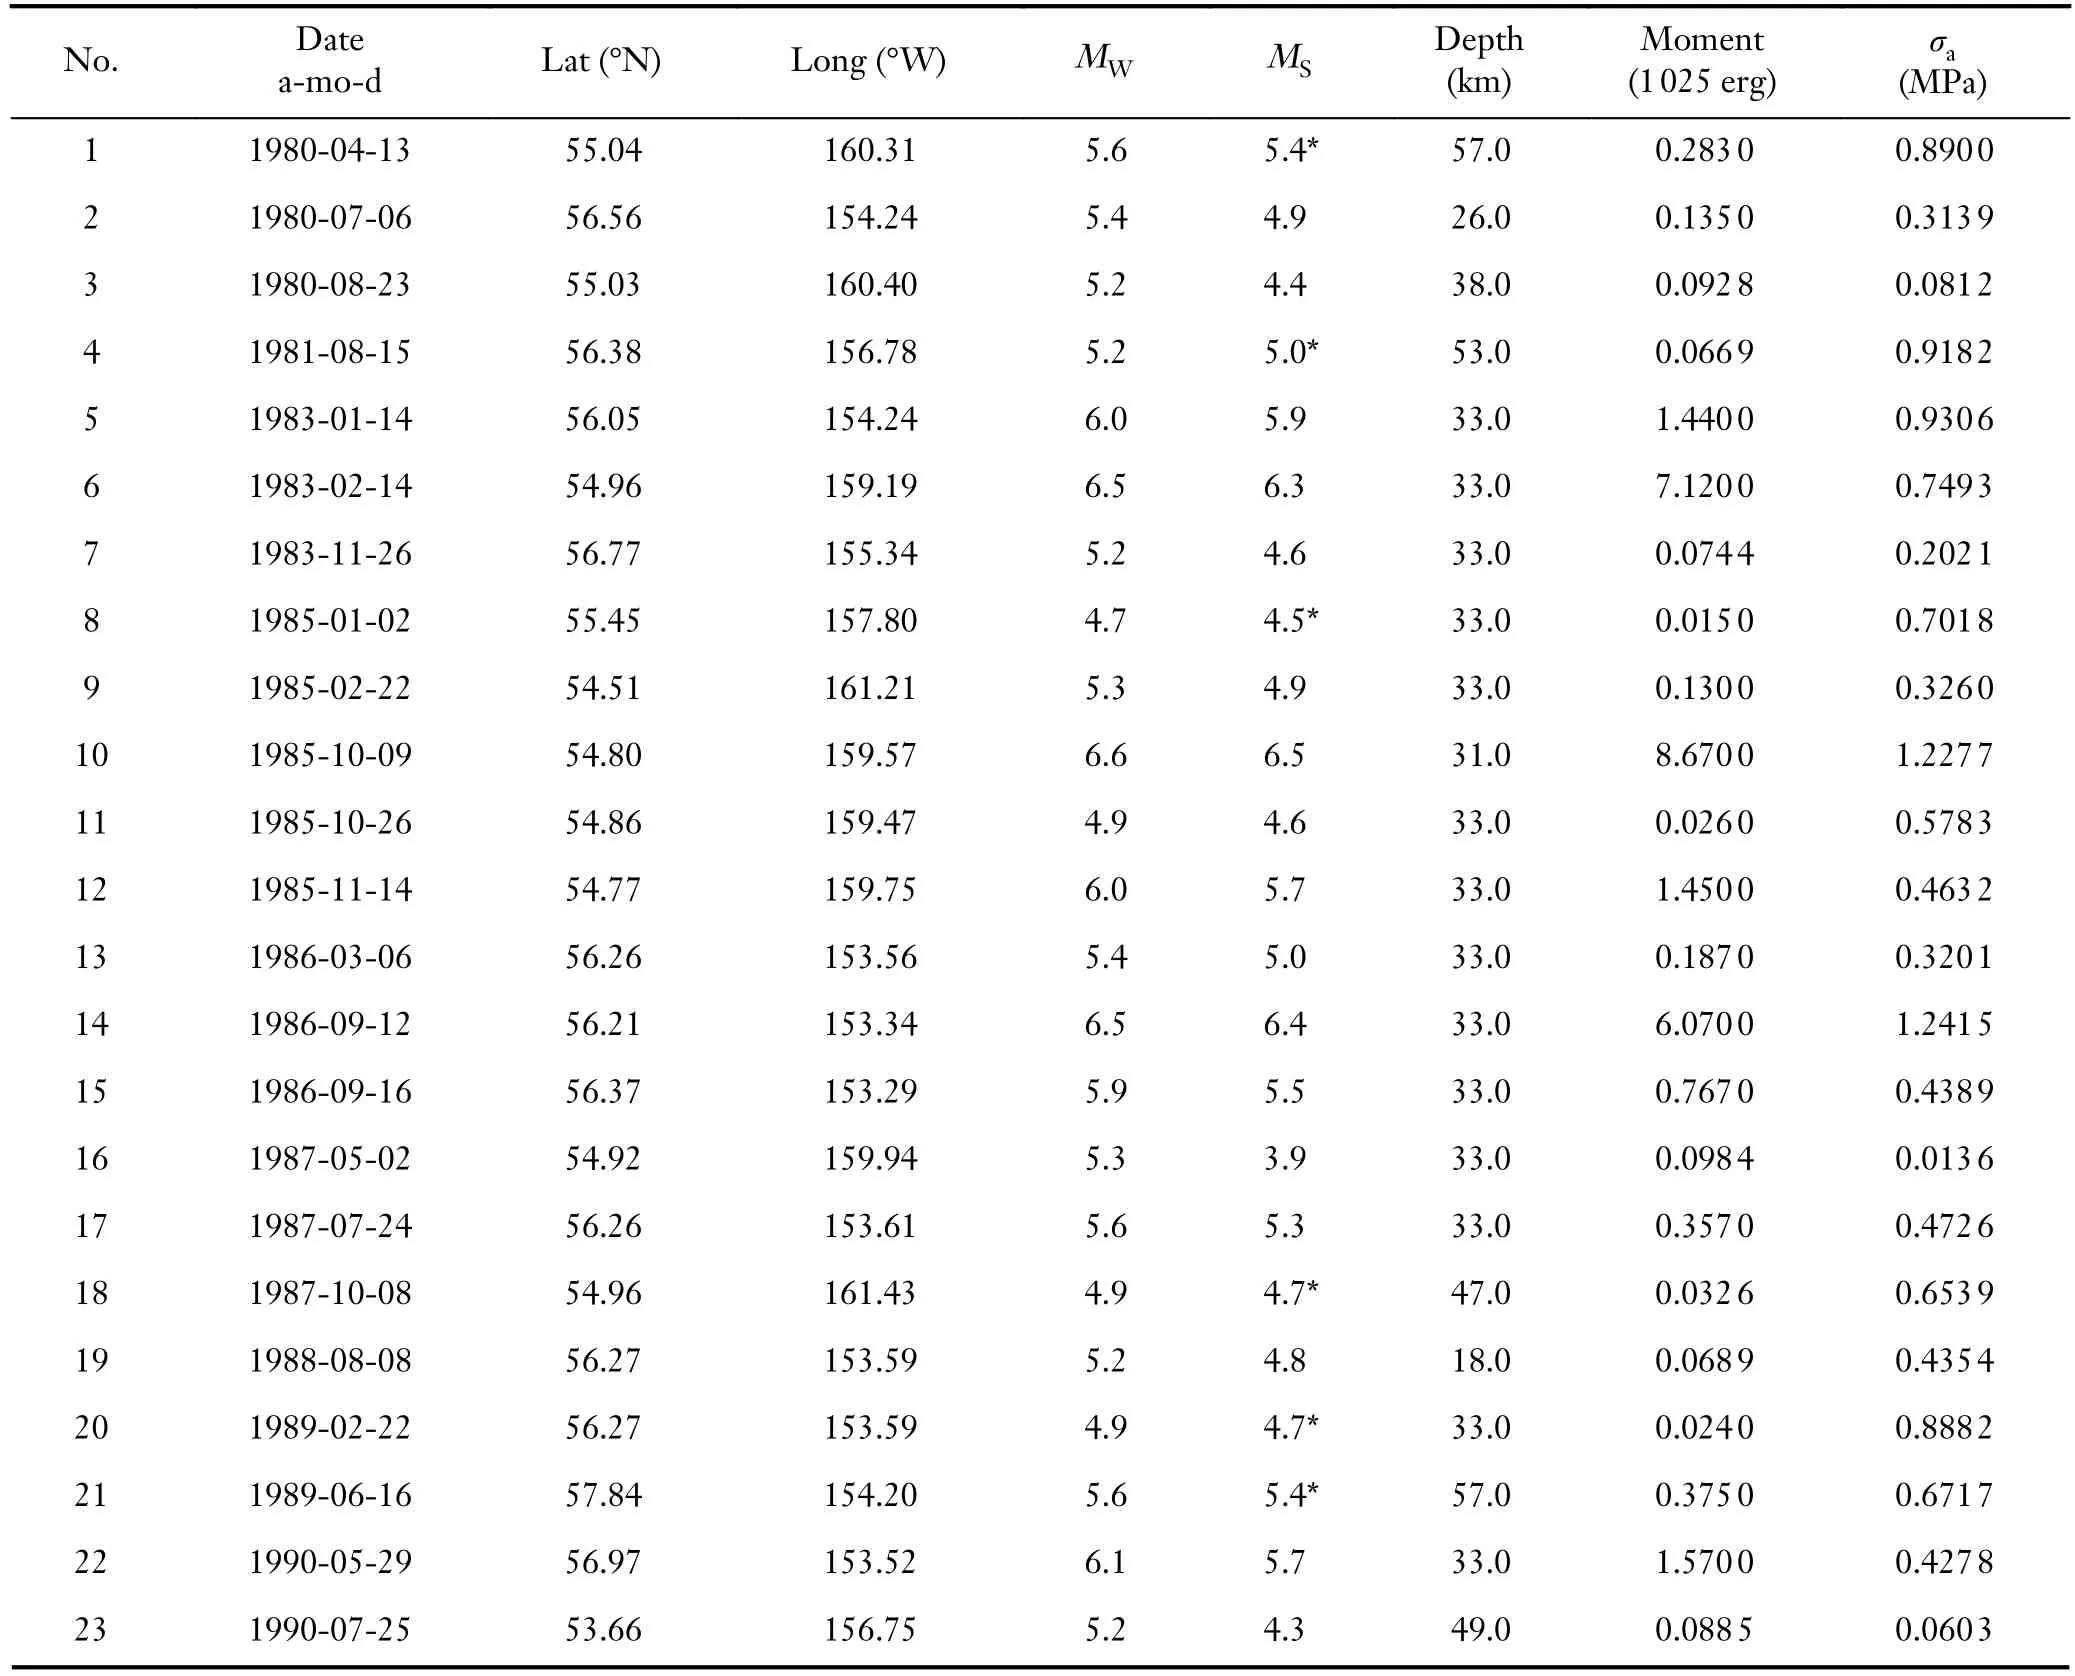
Table S1.Source parameters and apparent stress values of earthquakes in the study area prior to the MW8.2 event in Alaska.
Continued
Continued
Continued
Continued
杂志排行
Earthquake Science的其它文章
- A comparative study of seismic tomography models of the Chinese continental lithosphere
- Emergence of non-extensive seismic magnitude-frequency distribution from a Bayesian framework
- Gorkha earthquake (MW7.8) and aftershock sequence:A fractal approach
- Correlation between the tilt anomaly on the vertical pendulum at the Songpan station and the 2021 MS7.4 Maduo earthquake in Qinghai province,China